Optogenetic identification of GABAergic and non-GABAergic (putative projection) neurons within the solitary nucleus suggests that hyperpolarization-sensitive channels impact the transfer of information across the synapse. GABAergic neurons transfer afferent information with less fidelity compared with non-GABAergic neurons; however, the fidelity of GABAergic neurons with Ih is similar to that of non-GABAergic neurons. In non-GABAergic neurons with IA, the interaction between the IA current and inhibition suppresses the transfer of information proportionally compared with non-GABAergic neurons without IA.
Keywords: optogenetics, taste, nucleus of the solitary tract, inhibition
Abstract
Inhibition is presumed to play an important role in gustatory processing in the rostral nucleus of the solitary tract (rNST). One source of inhibition, GABA, is abundant within the nucleus and comes both from local, intrasolitary sources and from outside the nucleus. In addition to the receptor-mediated effects of GABA on rNST neurons, the hyperpolarization-sensitive currents, Ih and IA, have the potential to further modulate afferent signals. To elucidate the effects of GABAergic modulation on solitary tract (ST)-evoked responses in phenotypically defined rNST neurons and to define the presence of IA and Ih in the same cells, we combined in vitro recording and optogenetics in a transgenic mouse model. This mouse expresses channelrhodopsin 2 (ChR2) in GAD65-expressing GABAergic neurons throughout the rNST. GABA positive (GABA+) neurons differed from GABA negative (GABA−) neurons in their response to membrane depolarization and ST stimulation. GABA+ neurons had lower thresholds to direct membrane depolarization compared with GABA− neurons, but GABA− neurons responded more faithfully to ST stimulation. Both IA and Ih were present in subsets of GABA+ and GABA− neurons. Interestingly, GABA+ neurons with Ih were more responsive to afferent stimulation than inhibitory neurons devoid of these currents, whereas GABA− neurons with IA were more subject to inhibitory modulation. These results suggest that the voltage-gated channels underlying IA and Ih play an important role in modulating rNST output through a circuit of feedforward inhibition.
NEW & NOTEWORTHY
Optogenetic identification of GABAergic and non-GABAergic (putative projection) neurons within the solitary nucleus suggests that hyperpolarization-sensitive channels impact the transfer of information across the synapse. GABAergic neurons transfer afferent information with less fidelity compared with non-GABAergic neurons; however, the fidelity of GABAergic neurons with Ih is similar to that of non-GABAergic neurons. In non-GABAergic neurons with IA, the interaction between the IA current and inhibition suppresses the transfer of information proportionally compared with non-GABAergic neurons without IA.
inhibition is presumed to play an important role in gustatory processing in the rostral nucleus of the solitary tract (rNST), with GABA, glycine, opioids, and somatostatin all identified as potential sources of this inhibition (Lasiter and Kachele 1988; Li et al. 2003; Lundy and Norgren 2015; Sweazey 1996). GABA, in particular, is abundant in the rNST and derives from local, intrasolitary interneurons (Davis 1993; Lasiter and Kachele 1988) in addition to more distant sources, e.g., the central nucleus of the amygdala (Saha et al. 2002). Local infusions of GABA have a profound effect on rNST neurons and suppress both spontaneous activity and solitary tract (ST)-evoked responses in vitro (Grabauskas 2005; Grabauskas and Bradley 1998; Liu et al. 1993; Wang and Bradley 1993). Similarly, infusions of the GABA antagonist bicuculline alter gustatory tuning profiles in vivo (Smith and Li 1998). GABAergic inhibition has the capacity to modulate afferent signaling via feedforward inhibition, as ST stimulation elicits GABA-mediated hyperpolarization in rNST neurons via polysynaptic pathways (Grabauskas and Bradley 1996). Although GABAergic neurons in rNST can be monosynaptically activated by ST stimulation, thus providing a substrate for feedforward inhibition (Boxwell et al. 2013), how afferent responsiveness of GABAergic neurons compares to that of non-GABAergic neurons is not known.
In addition to the receptor-mediated inhibitory effects of GABA (Liu et al. 1993; Wang and Bradley 1993, 1995), inhibition can further influence the excitability of rNST neurons through ion channels activated or deinactivated by hyperpolarization. When hyperpolarized, rNST cells show evidence of both the nonspecific cation current Ih and/or a transient outward K+ current, IA (Corson and Bradley 2013; Suwabe and Bradley 2009; Tell and Bradley 1994; Uteshev and Smith 2006; Wang and Bradley 2010a). These currents do not appear to be ubiquitous. For example, IA was present in subsets of neurons that projected to the parabrachial nucleus (PBN) (Suwabe and Bradley 2009) or reticular formation (RF) (Corson and Bradley 2013) but absent in GABAergic neurons (Wang and Bradley 2010a). This latter conclusion, however, was based on identifying GABAergic neurons in the “GIN” mouse (Oliva et al. 2000), in which EGFP in inhibitory rNST neurons was found principally in a circumscribed region, the ventral subdivision (Travers et al. 2005; Wang and Bradley 2010a). Thus it remains possible that other GABAergic neurons express IA. Similarly, Ih was detected in subsets of both PBN- and RF-projecting neurons, but its prevalence in GABAergic neurons was not specified (Corson and Bradley 2013; Suwabe and Bradley 2009; Wang and Bradley 2010a).
Importantly, these hyperpolarization-sensitive currents modulate neuron excitability (e.g., Gu and Barry 2011; He et al. 2014; Johnston et al. 2010; Tell and Bradley 1994). Indeed, in the caudal NST (cNST), neurons with projections to the paraventricular nucleus preferentially expressed IA, in contrast to cells with local medullary projections (Bailey et al. 2007; Strube et al. 2015), and, compared with local projection neurons without IA, responded with lower “fidelity” to trains of ST stimulation. Moreover, deinactivating IA with a hyperpolarizing prepulse further reduced their output, suggesting an important gating function on afferent signals. In the rNST, the relationship between hyperpolarization-gated currents and responsiveness to ST stimulation and inhibitory modulation has not been delineated.
To investigate responses to ST stimulation in phenotypically defined neurons, elucidate effects of GABAergic modulation on ST-evoked responses, and define the presence of IA and Ih in the same cells, we combined in vitro recording and optogenetics in a transgenic mouse model. This mouse expresses channelrhodopsin 2 (ChR2) in GAD65-expressing GABAergic neurons (Taniguchi et al. 2011) throughout the rNST. Our results provide evidence that afferent responsiveness and inhibitory modulation vary markedly in subclasses of excitatory and inhibitory rNST neurons defined on the basis of their light-driven responses and the presence of hyperpolarization-activated ion channels.
MATERIALS AND METHODS
Animals (electrophysiological experiments).
Experiments were conducted in transgenic mice (4–12 wk; either sex) that expressed channelrhodopsin (ChR2 H134R) in GABAergic neurons by placing its expression under the control of the promoter for either glutamic acid decarboxylase-65 (GAD65, also known as GAD2) or the vesicular GABA transporter, VGAT. Animals were bred by crossing a Cre-dependent ChR2-EYFP mouse line (JAX no. 012569) with mice expressing Cre recombinase under the control of the endogenous promotor for GAD65 (GAD2-IRES-Cre, Jax no. 010802; n = 34) or VGAT (VGAT-IRES-Cre, Jax no. 016962; n = 7). Animals were maintained on ad libitum water and food until use. All experimental protocols were approved by the Ohio State University Institutional Animal Care and Use Committee in accordance with guidelines from the National Institutes of Health.
Slice preparation.
Acute slices were prepared for electrophysiological recording following anesthetization with isoflurane, decapitation, and rapid removal and cooling of the brain. The blocked brain stem was glued to a ceramic block with cyanoacrylate glue, and 250-μm-thick coronal brain stem slices were cut with a sapphire blade on a vibratome (model 1000, Vibratome, St. Louis, MO) in an ice-cold carboxygenated cutting solution containing (in mM) 110 choline, 25 NaHCO3, 3 KCl, 7 MgSO4, 1.5 NaH2PO4, 10 d-glucose, and 0.5 CaCl2.
Slices were incubated in a carboxygenated artificial cerebrospinal fluid (ACSF) containing (in mM) 124 NaCl, 25 NaHCO3, 3 KCl, 1 MgSO4, 1.5 NaH2PO4, 10 d-glucose, and 1.5 CaCl2 at 32°C for 1 h prior to recording. Slices were transferred to a recording chamber and perfused with 36°C ACSF at a rate of 1–2 ml/min. Neurons identified with DIC optics were recorded in whole cell patch-clamp mode with 4- to 6-MΩ pulled glass pipettes filled with an intracellular solution containing (in mM) 130 K-gluconate, 10 EGTA, 10 HEPES, 1 CaCl2, 1 MgCl2, and 2 ATP, at pH 7.2–7.3 and osmolality of 290–295 mosmol/kg. Recordings were made with an A-M Systems model 2400 amplifier using pCLAMP software (Molecular Devices, Sunnyvale, CA).
Recording protocols.
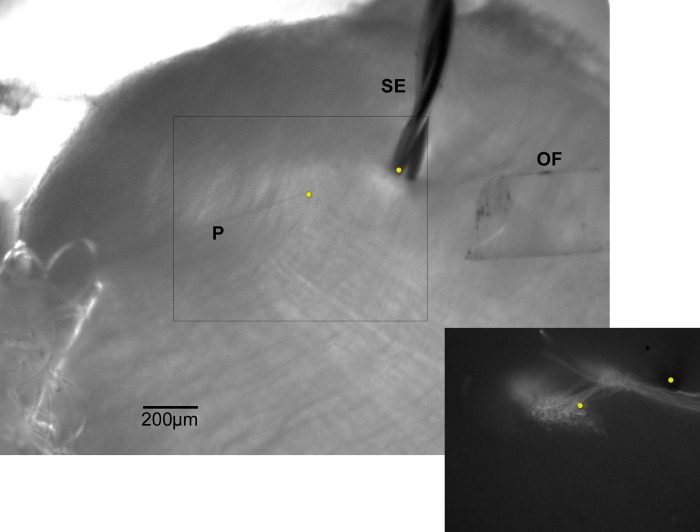
Neurons in the solitary nucleus were visualized under DIC optics with a Nikon E600FN microscope. Photomicrographs were taken of the slice at both high (×40) and low (×4) magnification under both DIC and epifluorescence to aid in the localization of the neuron within the rNST (Fig. 1). Although EYFP expression could be observed under epifluorescence, it was usually not adequate for identifying GABAergic neurons because it was localized to membranes and thus soma were obscured by dense labeling of the neuropil. Therefore, we identified GABAergic neurons by their physiological response to optical stimulation and avoided unnecessary (epifluorescent) light exposure. A bipolar stimulating electrode made of twisted insulated wire (67 μm, NiCr) was placed on the ST under visual guidance, and in some instances placement was confirmed at the conclusion of the experiment by immunohistochemistry for P2X2, which labels incoming afferent fibers and the afferent terminal field (Bartel 2012; Breza and Travers 2016) (Fig. 1). A fiber-optic probe (200 μm, NA = 0.39) connected to an LED (Thor Labs, model 4100 4-channel LED Driver) emitting 455-nm light at an intensity of 2.3 mW at the tip was positioned close to the slice and centered to illuminate the rNST.
Fig. 1.
Photomicrograph of a rostral NST slice preparation showing the placements of the stimulating electrode (SE), optical fiber (OF), and patch electrode (P). Inset: same slice after immunohistochemical staining for P2X2, verifying that the recorded cell was in the primary afferent field (yellow dot, left) and that the stimulating electrode was on the incoming solitary tract (yellow dot, right).
Membrane resistance test.
Testing began with a membrane resistance test. Cells held in current clamp were injected with current steps (0.02 nA, 250 ms) ranging from −0.1 to 0.36 nA or until the number of action potentials began to decrease, to define a threshold, maximum firing frequency, and breakpoint (Table 1). Cells were classified as either “burst” or “tonic” based on the response to 0.1-nA depolarization (Corson and Bradley 2013; Wang and Bradley 2010a). Neurons that responded with action potentials that did not extend past 125 ms were deemed burst; those that persisted throughout the stimulation period were classified as tonic. Criteria for inclusion of the neuron in the data set included an initial seal >1 GΩ, a membrane resistance exceeding 100 MΩ, and a positive action potential overshoot.
Table 1.
Comparison of GABAergic and non-GABAergic neurons
| GABA− | GABA+ | Statistics | |
|---|---|---|---|
| RMP, mV | −52.5 (1.36) (n = 33) | −52.6 (1.16) (n = 38) | NS |
| MR, MΩ | 589.3 (66.28) (n = 20) | 649.5 (73.33) (n = 20) | NS |
| CAP, pF | 33.2 (3.48) (n = 20) | 25.8 (1.86) (n = 20) | P = 0.07 |
| Threshold, nA | 0.031 (0.004) (n = 16) | 0.019 (0.003) (n = 20) | P = 0.027 |
| Max firing, Hz | 12.3 (0.969) (n = 16) | 11.8 (1.8) (n = 20) | NS |
| Breakpoint, nA | 0.14 (0.014) (n = 16) | 0.09 (0.016) (n = 20) | P = 0.047 |
| IA | 52% (17/33) | 31% (11/35) | P = 0.09 |
| Ih | 15% (4/27) | 38% (12/32) | P = 0.05 |
| PIR | 43% (13/30) | 43% (17/40) | NS |
| Burst | 24% (7/29) | 50% (17/34) | P = 0.035 |
| Tonic | 76%(22/29) | 50% (17/34) |
Parameter values are means (SE).
RMP, resting membrane potential; MR, membrane resistance; CAP, capacitance; PIR, postinhibitory rebound; NS, not significant.
Cell classification.
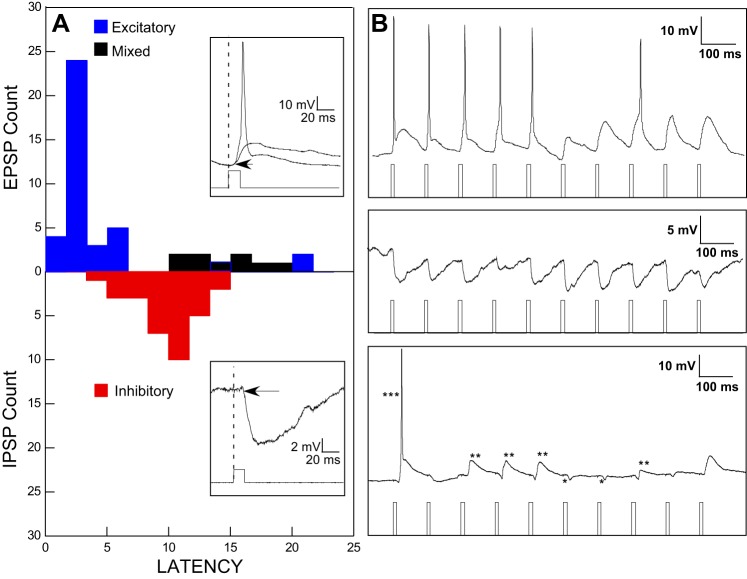
As mentioned above, neurons were classified based on their physiological response to light (e.g., Pi et al. 2013). Neurons were optically stimulated with 1-s trains of light (10 Hz, pulse duration = 10 ms). Optical stimulation evoked excitatory responses (action potentials and/or excitatory graded potentials), inhibitory potentials, or in a few instances both (Fig. 2). Response latencies were calculated from the onset of the optical pulse to a deflection exceeding baseline, and both the mean latency and the “jitter,” defined as the standard deviation of the latency (Doyle and Andresen 2001), were derived. Neurons were considered to be GABAergic (GABA+) when they exhibited reliable, short-latency excitatory responses. In contrast, non-GABAergic (GABA−) neurons responded with longer-latency inhibitory potentials (see results for details).
Fig. 2.
A: histograms of optically evoked response latencies for neurons with purely excitatory responses (blue), inhibitory responses (red), and mixed excitatory and inhibitory responses (black). Insets: examples of responses at expanded time bases illustrating short-latency action potentials or excitatory graded potentials (top) and an optically evoked inhibitory potential (bottom). B: examples of responses to trains of optical stimulation illustrating each of the 3 categories in the histogram: purely excitatory (top), purely inhibitory (middle), and mixed (bottom). For the mixed responses, *** indicates an action potential (truncated), ** indicates graded excitatory responses usually preceded by an inhibitory response, and * indicates a purely inhibitory response. Excitatory responses could indicate either postinhibitory rebound or effects of disinhibition.
Light modulation protocols.
In one group of animals (n = 28), the effects of optical (inhibitory) stimulation were tested on responses elicited by ST stimulation. The ST was electrically stimulated (150 μA) at frequencies ranging from 1 to 50 Hz for 1 s, and responses were quantified as the number of action potentials at each frequency of stimulation. In a second group of animals (n = 10), a depolarizing current was applied through the patch electrode (250 ms, 0–0.48 nA, 0.04-nA steps) and the number of action potentials was determined at each level of depolarization above threshold. For both groups, protocols were carried out in the presence and absence of simultaneous optical stimulation (2.3 mW, 10 Hz, 10-ms duration pulses), where trials with and without light stimulation were interdigitated. Protocols were repeated whenever possible.
Voltage-gated channels.
After the light modulation protocols, we assessed the presence of voltage-gated channels. The presence of IA was tested in voltage clamp by hyperpolarizing the cell from resting membrane potential to −100 mV for 1 s followed by a depolarization step for 2 s (Boxwell et al. 2015). Depolarizing steps reached a maximum of −40 mV in 5-mV steps. In a subset of cells, the effects of hyperpolarization followed by depolarization were recorded in current clamp to monitor the onset or delay of the first action potential. The effects of the potassium channel blocker 4-aminopyridine (4-AP; 0.5 mM–1.0 mM) were tested in several cells together with 0.5 μM tetrodotoxin (TTX) in the bath solution. The hyperpolarization-activated inward cation current Ih was tested in current clamp. Neurons were injected with 0.2 nA preceded by hyperpolarizing steps from resting membrane potential to −0.2 nA in 0.05-nA steps. Membrane sag was measured as the difference in membrane voltage from the most negative value during the hyperpolarization step to the value at the end of the step. A membrane sag > 2 mV was used as the criterion to categorize cells with Ih (Hsiao et al. 2007; Venugopal et al. 2010).
Analysis.
Data were analyzed with ANOVA or χ2 with SYSTAT (v13). For several analyses we conducted a repeated-measures ANOVA across different rates of afferent stimulation. In these cases we show a graph including all five levels of stimulation: 2, 5, 10, 20, and 50 Hz. However, because of missing values in some of the initial cases, we did not include 2 Hz in the ANOVA. The critical value for significance was set at P < 0.05; SEs of the mean are provided in parentheses. P values between 0.05 and 0.0001 are given as exact values; smaller P values are designated as <0.0001.
For neurons tested with the ST stimulation protocol, we also calculated a threshold linear function, i.e., the response of each neuron under optical stimulation (inhibition) was normalized to the largest response elicited by ST stimulation under the no-light condition and fit to a linear equation (Atallah et al. 2012; Semyanov et al. 2004; Wilson et al. 2012). This procedure yields both a slope and an intercept of the linear fit. The slope captures the proportional (divisive) effect of inhibition, while the intercept provides a measure of the subtractive effects of inhibition. No effect of light yields a line with a slope = 1 and a y-intercept = 0. A purely divisive effect of inhibition changes only the slope, while a purely subtractive effect yields a line with a slope of 1 but with a y-offset.
Neuroanatomical experiments.
To better label soma to describe the distribution and phenotype of GAD65 Cre-expressing NST neurons we bred the same GAD65-Cre mice used for the GAD65/ChR2 cross with a tdTomato reporter line (JAX no. 007908). After deep anesthetization with a ketamine-xylazine cocktail, mice (n = 3) were perfused with phosphate-buffered saline (PBS) and then a mixture of 4% paraformaldehyde, 1.4% l-lysine, and 0.2% sodium (meta)periodate. Brains were extracted and cryoprotected overnight in a 20% sucrose PBS solution. Sections were cut on a freezing microtome at 40–50 μm and immunostained for the transcription factor PHOX2b. In rats, previous studies have shown that immunostaining for PHOX2b is present in dorsal motor nucleus of the vagus (DMV) neurons positive for choline acetyltransferase immunostaining and in the NST PHOX2b immunostaining colocalizes in neurons with mRNA for VGlut2 but not GAD67. Thus PHOX2b is considered to be a marker for excitatory, glutamatergic neurons in NST and preganglionic parasympathetics in DMV (Kang et al. 2007). We employed standard fluorescent immunohistochemical techniques using an antibody against the COOH-terminal sequence of the PHOX2b protein (Pattyn et al. 1997) (a kind gift of Dr. J. F. Brunet). Briefly, after rinsing, soaking in 1% sodium borohydride, and blocking for nonspecific staining (5% donkey serum and 1% bovine serum albumin in PBS with 0.3% Triton X-100), the primary antibody was added to the blocking serum at a dilution of 1:1,000 and incubated overnight. Subsequently, tissues were rinsed extensively, soaked in an anti-rabbit secondary antibody tagged with Alexa Fluor 488 (1:500), and then rinsed again before the sections were mounted and coverslipped with a water-based mountant (Vectashield). All procedures were carried out at room temperature. Confocal photomicrographs (Olympus FV 1000) were taken of sections from three mice for examination. In addition, in two cases the cell counter module in ImageJ was used to construct plots of the distribution of tdTomato- and PHOX2b-stained neurons from ×20 confocal images of three sections approximately equally spaced in the rNST. Plots of the different types of neurons were made independently and combined, and then marked cells in close proximity were examined to determine whether they were double-labeled.
RESULTS
Distribution and phenotype of GAD65-Cre neurons.
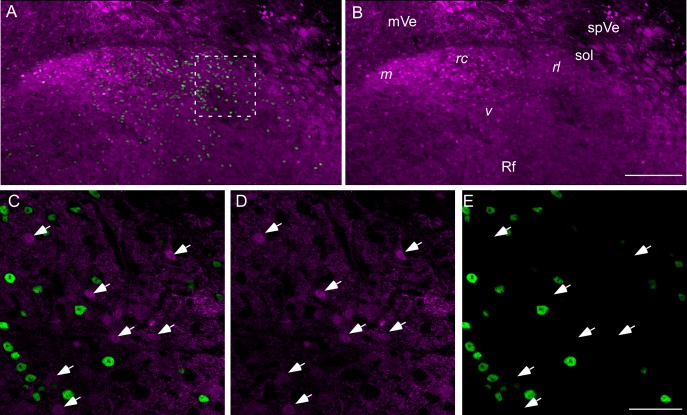
Figure 3 shows photomicrographs of tdTomato expression under the control of the GAD65 promoter in sections immunostained for PHOX2b, and Fig. 4 shows plots from three levels of the rNST from another case. PHOX2b neurons were distributed throughout the nucleus, although they are difficult to appreciate in the medial half of the NST in the double-stained photomicrograph (Fig. 3A) because of the dense GAD65 neuropil in this zone. Neurons expressing GAD65 were sparse at the extreme medial pole of the nucleus. With this one exception, however, GAD65 neurons were also evident throughout the rNST and displayed no obvious topography. Moreover, they comprised a population distinct from neurons immunostained for PHOX2b, although the two populations were intermingled. Across the two cases quantified, <1% of neurons were double-labeled for both PHOX2b and tdTomato-GAD65 (0.2 ± 0.1%). GAD65tomato neurons comprised 29.7 ± 7.8% of the total population stained with either marker. Similar results were apparent in confocal photomicrographs from another mouse that was a cross between the same tdTomato reporter line and the mouse line expressing Cre-recombinase under the control of VGAT (not shown).
Fig. 3.
Confocal photomicrographs of an rNST section approximately midway between where the NST moves away from the IVth ventricle and the rostral pole of the nucleus. A and B: low-power maximum-intensity projections of a composite of 2 photomicrographs (×20, z = 2-μm steps). A: the native GAD65 tdTomato staining (magenta) with PHOX2b immunostaining (green). B: tdTomato staining alone. GABA soma are widespread throughout the nucleus. However, with these low-magnification maximum-intensity projections, the copious GAD65 neuropil obscures some of the GAD65 somal labeling and many of the PHOX2b-labeled neurons in the middle half of the nucleus apparent in the plots of Fig. 4. The boxed region in A can be more clearly viewed in the single z level, higher-power photomicrographs in C–E (×60, 1-μm z steps). C: overlay. D: GAD65 tdTomato. E: PHOX2b. Several GAD65 neurons are marked with arrows; GAD65 and PHOX2b neurons show almost no overlap. Interestingly, the GAD65 soma appear to be approximately the same size as the PHOX2b-stained nuclei. mVe, medial vestibular nucleus; spVe, spinal vestibular nucleus; sol, solitary tract; Rf, reticular formation. Labels in italics denote the locations of the 4 rNST subdivisions: m, medial; rc, rostral central; rl, rostral lateral; v, ventral (Ganchrow et al. 2014; Whitehead 1988). Scale bars, 200 μm (A and B), 50 μm (C–E).
Fig. 4.
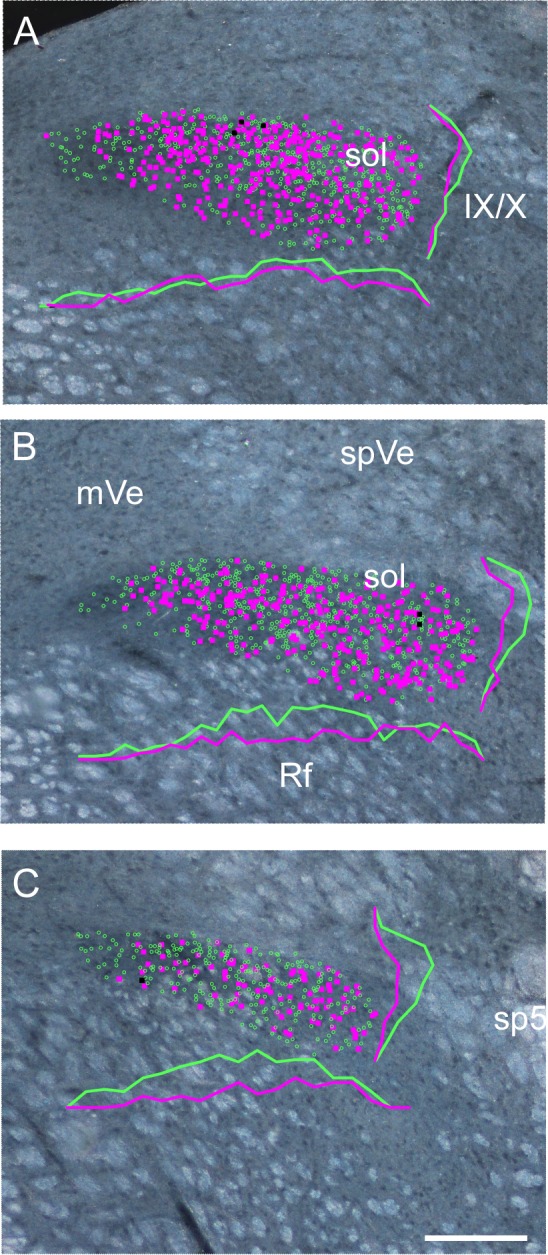
Plots of the distribution of rNST GAD65 and PHOX2b neurons from a different GAD65-Cre × tdTomato mouse than shown in Fig. 3. GAD65/tdTomato and PHOX2b neurons are depicted with magenta and green symbols, respectively. The few double-labeled neurons are shown with black symbols. Plots are superimposed upon darkfield photomicrographs of the same sections. A–C show successively more rostral levels of the nucleus. Frequency polygrams for the distributions of GAD65 and PHOX2b neurons along the mediolateral and dorsoventral axes appear in matching solid lines for each panel. GAD65 neurons are sparse at the most medial pole of the nucleus, but this region is occupied by PHOX2b-stained nuclei. We observed that these medial PHOX2b nuclei had a relatively large diameter, suggesting that they are associated with preganglionic parasympathetic neurons (Contreras et al. 1980; Kang et al. 2007). Otherwise, GAD65 neurons are distributed throughout the nucleus. Note that although this case showed a tendency for a higher proportion of GAD65 neurons caudally, this was not consistent in the other cases inspected. IX/X, incoming fibers of the glossopharyngeal and vagus nerves; mVe, medial vestibular nucleus; spVe, spinal vestibular nucleus; sp5, spinal trigeminal tract; sol, solitary tract; Rf, reticular formation. Scale bar, 200 μm.
Classification of GABA+ and GABA− neurons.
A total of 85 light-sensitive neurons were recorded from 41 transgenic mice expressing ChR2 in inhibitory neurons. We typically recorded from one to three neurons per mouse. Neurons were initially divided into those that responded to optical stimulation with excitatory responses (predominantly action potentials, n = 20; predominantly excitatory graded potentials, n = 22) and those that responded with purely inhibitory postsynaptic potentials (IPSPs, n = 34). Nine neurons responded with both excitatory responses and inhibitory potentials.
These types of cells were then categorized into GABA+ and GABA− neurons based on the valence of the optical response and latency. The GAD65/ChR2 (34 mice, 74 cells) and VGAT/ChR2 (7 mice, 11 cells) mice yielded similar results, and data were combined for analysis. Neurons with (purely) excitatory responses to optical stimulation produced a bimodal distribution based on latencies (Fig. 2). Three of the 42 neurons with purely excitatory responses had very long latencies and were subsequently grouped with those neurons that had both excitatory and inhibitory responses and similarly long latencies. The latencies of the optically driven responses in neurons with purely excitatory responses and short latencies (mean = 2.89 ± 0.21 ms) differed significantly from those in neurons with purely inhibitory responses (mean = 9.95 ± 0.43 ms; P < 0.001) and were termed GABA+ neurons, since these responses most likely reflected direct membrane depolarization via the ChR2 channel. Neurons with purely inhibitory potentials were deemed GABA− neurons since the longer-latency inhibitory potentials likely derived from a presynaptic source. In fact, GABA− neurons had significantly greater jitter (mean = 1.21 ± 0.117 ms) compared with GABA+ neurons (mean = 0.53 ± 0.051 ms; P < 0.001), consistent with an intervening synapse. Because the long latency and jitter associated with the inhibitory potentials likely reflect the addition of the latency and jitter of the action potential initiated by optogenetic stimulation of presynaptic GABA+ cells or terminals, we refer to them as inhibitory postsynaptic potentials (IPSPs).
Neurons with mixed potentials (n = 9) and/or (very) long-latency excitatory responses (n = 3) were not included in the subsequent comparison of GABA+ and GABA− cells. The identity of these neurons is open to interpretation and could reflect either postinhibitory rebound (PIR) or disinhibition in GABA− neurons (Pi et al. 2013). Indeed, 9/12 of these neurons had IPSPs that preceded the excitatory response, further supporting the interpretation that these were a special class of GABA− neurons. However, it is also possible that long-latency excitatory responses to optical stimulation reflect weak ChR2 expression in GABA+ neurons and/or those whose direct response to light was obscured by an inhibitory input.
Membrane properties.
There were no significant differences in passive membrane properties between GABA+ and GABA− cells, although there was a trend toward GABA+ neurons having a smaller capacitance (Table 1). There were, however, significant differences in neuron excitability in response to injected current and in the prevalence of several voltage-gated channels. Although membrane depolarization yielded equivalent maximal firing rates in both GABA+ and GABA− neurons, both the current necessary to evoke action potentials (threshold) and the current associated with maximal firing (breakpoint) were significantly lower for the GABA+ cells (Table 1: P = 0.027, P = 0.047, respectively). There were also differences in the patterns of responses to suprathreshold depolarization. An equivalent number of GABA+ cells responded with an initial “burst” pattern to depolarization (at 0.1 nA) as those that responded with a tonic response, but there were significantly more tonic than initial burst neurons among GABA− cells (Table 1: P = 0.035).
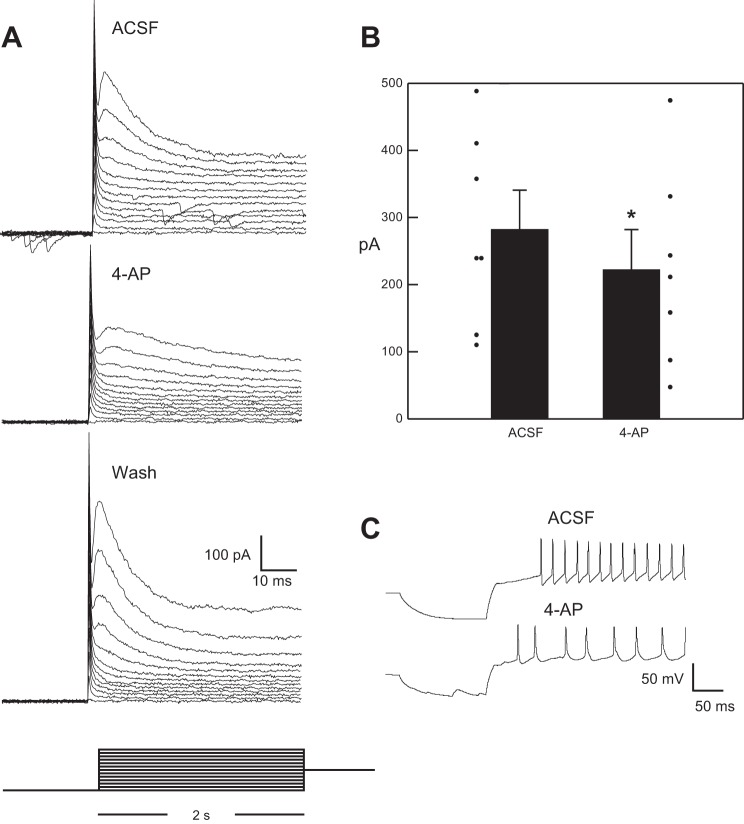
We observed both Ih and, in contrast to the GIN mouse (Wang and Bradley 2010a), a transient outward current, which we defined as IA, in GABA+ neurons. This transient outward current was significantly reduced by 4-AP in the subset of cells tested (n = 7, paired t-test: P = 0.005) but not in the steady-state phase (P > 0.05), supporting its identity as IA (Fig. 5) (Del Negro and Chandler 1997). There was no significant difference in the prevalence of IA between GABA+ and GABA− neurons, but Ih was found more often in GABA+ compared with GABA− cells (Table 1). PIR was apparent in both cell types, similar to several previous reports (Corson and Bradley 2013; Tell and Bradley 1994). Significantly, the presence of these voltage-gated channels in subpopulations of GABA+ and GABA− neurons was associated with differences in the response to ST stimulation and the response to optogenetic activation of GABAergic circuitry.
Fig. 5.
A: a series of 1-s hyperpolarizing pulses (−100 mV) followed by a 2-s depolarization (−95 to −40 mV in 5-mV steps) produced a transient outward current. B: this current was significantly suppressed by 4-AP (*paired t-test: P = 0.005). C: in current clamp, 4-AP also suppressed the delay to the first action potential.
Responses of GABA− cells to ST stimulation and optical modulation.
Across both cell types, increases in the frequency of ST stimulation led to modest increases in firing frequency that tended to asymptote or drop at the faster stimulation rates (Fig. 6A). This input-output relationship, however, was dependent on cell type; notably, the response of GABA− neurons to ST stimulation was larger compared with GABA+ neurons (ANOVA: cell type P = 0.029; stimulation rate P = 0.02; interaction P = 0.011).
Fig. 6.
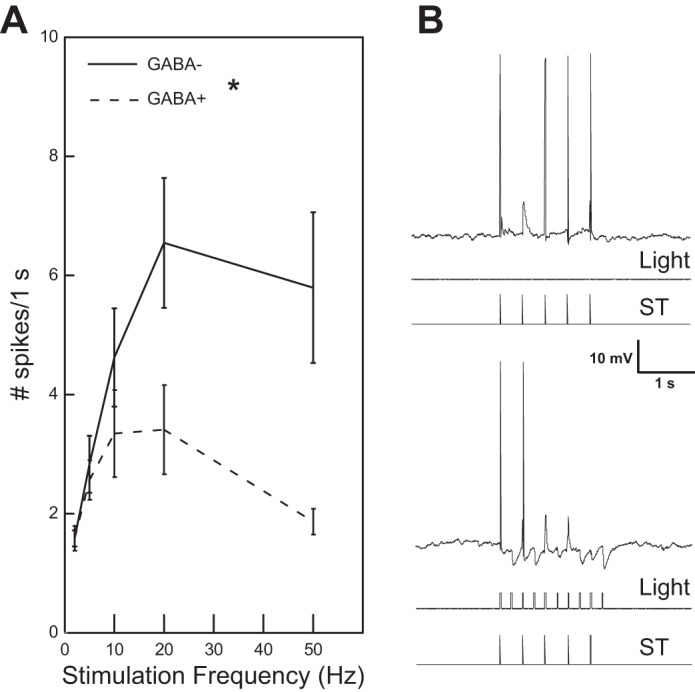
A: across solitary tract (ST) stimulation frequencies, neurons classified as GABA− responded at significantly higher rates (*ANOVA: effect of neuron type: P = 0.029) compared with neurons classified as GABA+. B, top: a GABA− neuron responds with 4 action potentials and 1 graded excitatory response to 5-Hz stimulation of the ST. Bottom: with concurrent light stimulation (10 Hz), the neuron responds with just 2 action potentials and inhibitory potentials can be seen as well.
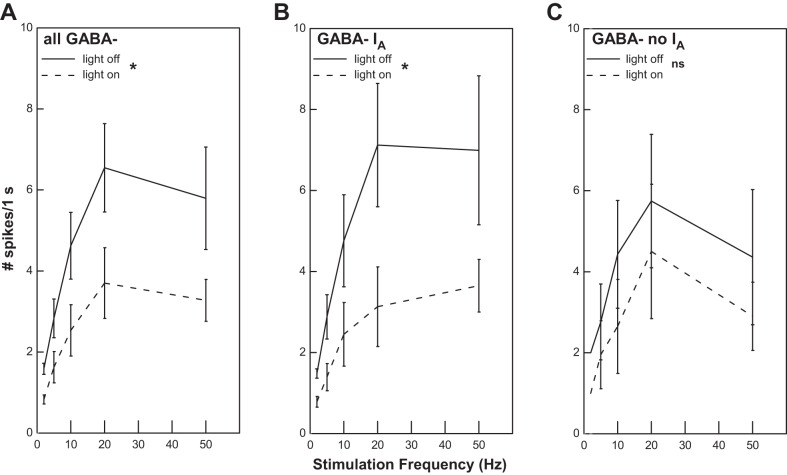
Optical stimulation significantly reduced the firing elicited by ST stimulation in GABA− cells (ANOVA: light P = 0.004; frequency P = 0.043; interaction P = 0.027) (Fig. 6B and Fig. 7A). Across frequencies, the mean reduction in response associated with light stimulation was 43.6%. Although the response to ST stimulation in the absence of light did not differ significantly between GABA− cells with and without IA (P > 0.05), the degree of suppression was related to the presence of IA in the cell. In neurons with IA (Fig. 7B), there was a greater degree of suppression (55.5%) compared with cells without IA (30.6%) (Fig. 7C). ANOVAs revealed a main effect of light for GABA− cells with IA (P = 0.016) but not for GABA− cells lacking this current (P > 0.05).
Fig. 7.
A: optical stimulation significantly suppressed the response to solitary tract stimulation across the entire population of GABA− cells (ANOVA: effect of light, *P = 0.004). B: this suppression was evident in the subpopulation of GABA− neurons with IA (ANOVA: effect of light, *P = 0.016). C: however, light did not produce a significant suppression in GABA− neurons without IA [ANOVA: effect of light, P > 0.05 (ns)].
To further quantify the difference in response suppression between GABA− neurons with and without IA, we derived threshold linear functions for ST responses under the condition of GABAergic modulation in the two populations of cells (Fig. 8). The mean slope for light-modulated responses from cells with IA (0.40 ± 0.04) was significantly smaller than that for cells without IA (0.77 ± 0.08, P = 0.006). Although the y-intercept for the mean regression line for cells with IA (0.014 ± 0.036) was closer to zero than the corresponding intercept for cells without IA (−0.084 ± 0.055), both intercepts were small and the difference between them was not statistically significant (P > 0.05). Thus, while activation of GABAergic circuitry produced both divisive and subtractive effects in both types of cells, divisive effects were more pronounced overall, especially in cells expressing IA, whereas subtractive effects were smaller, although they tended to be more notable in neurons without this current.
Fig. 8.
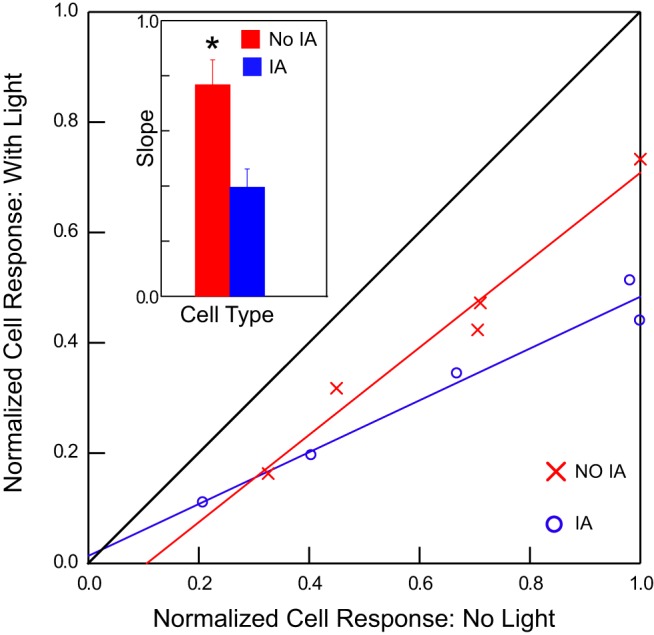
A threshold linear function was created by normalizing spikes in the no-light and light conditions to the maximum number of spikes obtained without light. No effect of light yields a line with a slope = 1 and a y-intercept = 0 (black). A purely divisive effect changes the slope, similar to what we observed in GABA− neurons with IA (blue). A subtractive element yields a line with a slope of 1 but has an offset, similar to GABA− neurons without IA (red). Inset: the mean slope for neurons with IA (blue) was significantly smaller than the mean slope for neurons without IA (red) (t-test: *P = 0.003). Note that the slopes and intercepts shown were calculated from the means of the populations whereas the statistics were calculated from the slopes and intercepts of the individual cells.
The effects of optical modulation were also apparent with the membrane depolarization protocol (Fig. 9). Increasing levels of depolarization of GABA− cells evoked increasing numbers of action potentials. At a certain level of depolarization, cells did not repolarize and this breakpoint was evident because the number of action potentials began to decrease. Because optical stimulation reduced the number of action potentials elicited by direct depolarization of GABA− cells but also shifted the breakpoint to more depolarized levels (ANOVA: effect of light, P = 0.045; applied current, P < 0.001; interaction, P < 0.001), it effectively increased the dynamic range of the neuron to excitatory inputs. The mean suppression across the three levels of depolarization in which there was suppression was 45.5%. The sample size for neurons tested in this protocol that were also tested for IA and Ih was not large enough to determine whether inhibitory modulation varied according to the presence of these ionic currents.
Fig. 9.
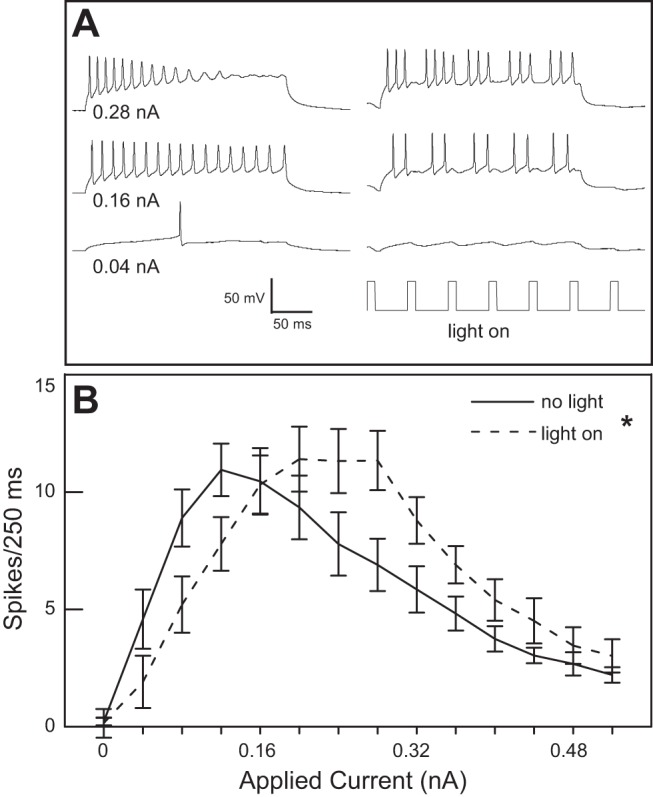
A: stimulation with light resulted in a shift of the breakpoint of the number of action potentials in response to applied current in a GABA− neuron. Traces on left are under conditions of no-light and show the threshold response (bottom), the breakpoint (middle), and depolarization block (top). Under conditions of optical stimulation (right) depolarization with the same applied currents shows inhibition at the lower levels of depolarization and a shifted breakpoint compared with stimulation in the absence of light. B: optical stimulation significantly altered the number of action potentials in 250 ms over 14 levels of depolarization for 8 neurons (ANOVA: effect of light, P = 0.045; applied current, P < 0.001; interaction, P < 0.001).
Responses of GABA+ cells.
Overall, GABA+ cells responded to electrical stimulation of the ST with only a modest increase in action potential frequency (Fig. 6) but the presence of voltage-gated channels greatly influenced this response (Fig. 10A). In particular, cells with Ih (only) responded significantly more vigorously than cells with neither IA nor Ih (P = 0.023). There was also a trend for cells with IA to be less responsive compared with cells with neither IA nor Ih, but this difference did not reach statistical significance (P = 0.095). Because many GABA+ cells also fired action potentials in response to optical stimulation, it was difficult to evaluate the effects of optically induced inhibition. Thus combining optical stimulation with ST stimulation did not suppress ST-evoked responses (as in the case of GABA− cells) but, rather, produced higher response rates than ST stimulation alone, presumably due to direct depolarization (Fig. 10B). It is perhaps revealing, however, that there was no additive effect of optical and ST stimulation, raising the possibility that optical stimulation-induced network inhibition counteracts the excitation from direct activation of the ST and ChR2 channels.
Fig. 10.
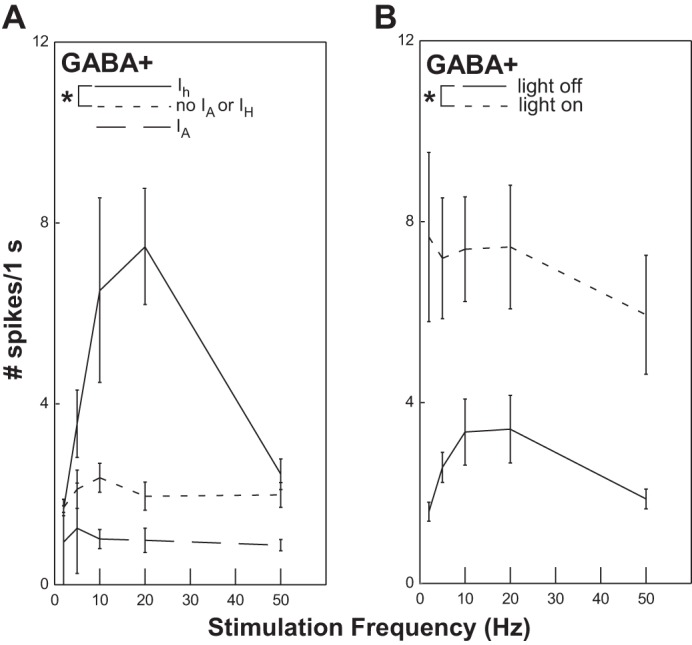
A: GABA+ neurons with Ih (only) respond significantly more to solitary tract stimulation compared with GABA+ neurons without Ih or IA (ANOVA: effect of Ih, P = 0.023). B: optical stimulation of GABA+ neurons in combination with solitary tract stimulation produces action potentials as a result of the direct depolarization, but there is not an additive effect of the 2 types of stimulation.
Location of cells in the nucleus.
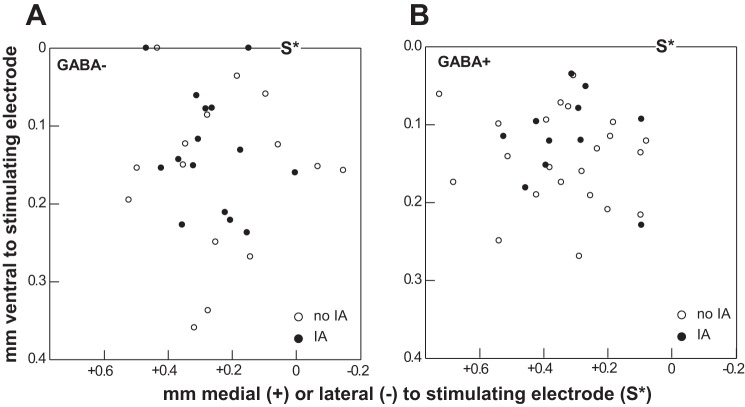
The locations of GABA+ and GABA− cells recorded within the rNST are shown in Fig. 11. Distances were measured from the tip of the stimulating electrode, positioned over the ST (Fig. 1). Regardless of type, most cells tended to be located dorsally within the nucleus, either in the central subdivision or straddling the central and ventral subdivisions. Many GABA+ neurons with IA were recorded dorsally, in locations where GABA+ cells in the GIN mouse are not apparent (Travers et al. 2007; Wang and Bradley 2010a).
Fig. 11.
Location of GABA− neurons (A) and GABA+ neurons (B) recorded from the rNST. Filled and open symbols depict neurons with and without IA, respectively. Measurements were made from the site of the stimulating electrode (denoted with S*), which was positioned over the solitary tract at the dorsolateral border of the nucleus (0,0); see Fig. 1.
DISCUSSION
A number of studies have identified neuron subtypes in the rNST based on morphology, location, membrane properties, projection status, and neurotransmitter phenotype (Corson and Bradley 2013; Davis 1993; King and Bradley 1994; Suwabe and Bradley 2009; Tell and Bradley 1994; Uteshev and Smith 2006; Wang and Bradley 2010a; Whitehead 1988; Whitehead et al. 1993). Here we identified neurons based on neurotransmitter phenotype and showed that both the neuron subtype and the presence of hyperpolarization-sensitive channels in GABA+ and GABA− cells were associated with differences in the transfer of information across the synapse. This analysis was facilitated by using a transgenic mouse model with a high efficiency and specificity for labeling GABAergic neurons. GABA− neurons, which likely included projection neurons, transferred afferent input more faithfully compared with GABA+ neurons. However, a subset of GABA+ neurons, those with Ih, had response fidelity comparable to GABA− neurons. Optogenetic stimulation revealed that GABA− neurons with IA showed augmented inhibition compared with GABA− neurons without IA. Thus, under conditions of inhibition, the presence of these ion channels can either augment or suppress neuron output.
Transgenic mice.
The specificity and efficiency of transgenic mice derived from the Gad2-ires-Cre driver line to label GABAergic neurons has been estimated to be >90% (Taniguchi et al. 2011). These estimates are consistent with our observations indicating that GAD65+ neurons identified in the rNST of mice derived by crossing this same Cre line with a tdTomato reporter line spanned the extent of the nucleus and comprised a population that was (virtually) mutually exclusive from that identified with an antibody directed against PHOX2b, a transcription factor found in glutamatergic NST neurons (Kang et al. 2007). Many GABA+ neurons that we recorded from were in the dorsal half of the nucleus (Fig. 11), and the extensive distribution of rNST GABA+ neurons that we observed in the GAD65-Cre × tdTomato cross is consistent with other studies that used in situ hybridization or knockin models to label GABAergic NST neurons [GAD65 (Stornetta and Guyenet 1999); GAD67 (Boxwell et al. 2013; Fong et al. 2005; Stornetta and Guyenet 1999); VGAT (Boxwell 2015)]. This distribution stands in contrast to the GIN mouse, a transgenic mouse that expresses EGFP under the control of the GAD67 promoter, but only in a subset of GABAergic neurons concentrated in the ventral subdivision (Travers et al. 2005; Wang and Bradley 2010a).
Synaptic depression.
We used ST stimulation as a proxy to study input-output relationships between gustatory afferents and first-order central neurons. We deliberately chose a stimulation intensity that, in our experience, could consistently elicit action potentials in rNST neurons, i.e., it was well above threshold. As such, we did not evaluate the contribution of potential convergent subthreshold inputs that are typically observed in voltage clamp (Grabauskas and Bradley 1996) or the contribution of different classes of afferent inputs, e.g., TRPV1+ vs. TRPV1−, that have been observed in the cNST (e.g., Doyle et al. 2002; Peters et al. 2011).
One of the more salient characteristics of this protocol was the degree to which cells failed to follow ST stimulation with action potentials. Much of this can be attributed to synaptic depression that has been described in both the cNST and the rNST. At 10 Hz, the degree of spike frequency suppression was similar for both GABA+ and GABA− neurons (∼60%; Fig. 6) and closely matched the previously reported degree of synaptic depression (at 10-Hz stimulation) of neurons of unknown phenotype in both the rNST (∼50%) (Wang and Bradley 2010b) and the cNST (60%) (Andresen and Yang 1995; Miles 1986). At stimulation frequencies above 10 Hz, the suppression of spike firing in GABA+ neurons was greater than that observed in GABA− neurons. These results are similar to differences in ST-evoked postsynaptic current amplitudes that we recently observed between VGAT+ and VGAT− neurons in mice expressing the Venus protein under the control of the VGAT promoter (Boxwell 2015). The increased firing fidelity of GABA− neurons also appears consistent with the synaptic facilitation observed in the paired-pulse ratio of GAD67− compared with GAD67+ neurons (Boxwell et al. 2013).
Distribution of voltage-gated currents.
Glutamatergic and GABAergic neurons constitute two major classes in the rNST (Boxwell et al. 2013; Davis 1993; Gill et al. 1999; Kang et al. 2007; Lasiter and Kachele 1988; Wang and Bradley 2010a). Projections to the PBN include glutamatergic neurons that originate primarily from the central subdivision; neurons in the ventral subdivision project more robustly to the subjacent RF (Gill et al. 1999; Halsell et al. 1996; Lasiter and Kachele 1988). Most GABAergic neurons, however, are considered to be local interneurons (Lasiter and Kachele 1988). The properties of these two neuron types differed significantly. In response to depolarization, GABA− neurons typically responded with a tonic discharge of action potentials, similar to PBN-projecting (likely GABA−) neurons in rat (Corson and Bradley 2013). However, the equal distribution of burst and tonic GABA+ neurons in the present study differed from GABA+ neurons in the GIN mouse, where rapidly adapting responses to direct depolarization were more common (Wang and Bradley 2010a). This difference may reflect a more inclusive population of GABA+ neurons in our transgenic strain. We further observed that GABA+ neurons had lower thresholds for eliciting action potentials in response to direct depolarization compared with GABA− neurons and that although the maximum firing rate achieved by both cell types was similar, GABA+ neurons had a lower breakpoint, similar to observations in VGAT+ and VGAT− neurons (Boxwell et al. 2015). A lower threshold for inhibitory neurons, in particular, may be important in “accelerating” feedforward inhibition (Roux and Buzsaki 2015) (see below).
The distribution and incidence of IA, Ih, and PIR further distinguished between the two neuron types. Although the incidence of PIR in our neuron types appeared roughly similar to reports in rat rNST for both identified (PBN projection) and unidentified neurons (Corson and Bradley 2013; Tell and Bradley 1994), the incidence of Ih and IA differed from previous reports. In particular, the proportion of GABA− neurons with Ih was smaller than observed in either PBN-projecting neurons or RF-projecting neurons (Corson and Bradley 2013; Suwabe and Bradley 2009). Furthermore, in contrast to the GIN mouse (Wang and Bradley 2010a), we observed both IA and PIR in GABA+ neurons. Although an explanation for less pronounced Ih in GABA− neurons is not clear, the presence of IA in GABA+ neurons likely results from using a different transgenic mouse that labels a larger proportion of GABAergic neurons as discussed above (Oliva et al. 2000; Taniguchi et al. 2011). These subpopulations of GABA+ and GABA− neurons expressing IA and Ih differed significantly in their response to ST and optogenetic, inhibitory GABAergic stimulation.
Interaction between inhibition and hyperpolarization-sensitive channels.
The rNST is endowed with a rich plexus of GABAergic terminals derived from a large population of intrinsic GABAergic neurons as well as extrinsic sources that induce inhibition through GABAA and, to a lesser extent, GABAB receptors (Liu et al. 1993; Wang and Bradley 1993). Evidence suggests several types of inhibition within the rNST including feedforward (Boxwell et al. 2013; Grabauskas and Bradley 1996; Wang and Bradley 1995), tonic (Smith et al. 1998), and presynaptic (Sharp and Finger 2002; Whitehead 1986) inhibition. GABAergic neurons within the rNST can be activated by monosynaptic afferent input (Boxwell et al. 2013), suggesting the presence of “feedforward” inhibition. Polysynaptic IPSPs in rNST neurons excited by afferent stimulation are consistent with such circuitry (Grabauskas and Bradley 1996; Wang and Bradley 1995). In addition to such feedforward (phasic) inhibition, there is also evidence for tonic inhibition in the rNST (Smith and Li 1998), since the addition of GABA antagonists has been demonstrated to enhance excitatory responses (Wang and Bradley 1995). GABAergic influences can also originate from sources outside the nucleus (Leonard et al. 1999; Smith and Li 2000). Our experiments do not dissociate between these forms of inhibition but do reveal a differential effect of GABA release on the transfer of information across the synapse in different populations of neurons and further suggest interactions between inhibition and hyperpolarization-sensitive channels that can modulate the effects of inhibition.
Overall, GABA− neurons responded more faithfully than GABA+ neurons to afferent stimulation. However, GABA− cells with IA showed significantly more suppression to ST stimulation with coincident optogenetically induced GABA activation compared with GABA− cells without IA. This result is similar to observations in the cNST, where a hyperpolarizing prepulse differentially suppressed the response to ST stimulation in neurons with IA (Bailey et al. 2007). Here we show that the optogenetically controlled phasic release of endogenous GABA can achieve similar results (see Strube et al. 2015). Additional studies are needed, however, to test the hypothesis that blocking IA channels in these cells would, in fact, reduce the effects of GABAergic inhibition on ST-induced responses.
Likewise, the presence of Ih had a profound effect on GABA+ cell responses; GABA+ cells with Ih responded to ST stimulation at considerably higher rates compared with GABA+ cells without Ih. This current is produced by hyperpolarization of the nonspecific cation HCN channel that increases excitability (He et al. 2014). Under conditions of GABA release, the presence of either or both tonic and phasic inhibition could amplify an afferent signal in cells with Ih and further suppress those with IA.
Functional implications.
Although the presence of GABA and its effects on rNST neurons is well established, the function(s) of GABA are less clear. In many sensory systems, inhibition can either affect the overall “gain” of responses by proportionally suppressing excitatory input or more selectively change the tuning characteristics of sensory neurons (Atallah et al. 2012; Roux and Buzsaki 2015; Salinas and Sejnowski 2001; Wilson et al. 2012). Both types of inhibition may find expression in the rNST. An increase in the “gain” of rNST gustatory responses compared with afferent nerve activity has been reported in multiple studies, although the reported degree is somewhat variable [estimated at 4.3 in rat (Doetsch and Erickson 1970) but only 1.4 in hamster (Travers and Smith 1979)]. This increase in gain most likely reflects the convergence of (excitatory) primary afferent input observed in several neurophysiological and anatomical investigations (e.g., Corson and Erisir 2013; Sweazey and Smith 1987; Travers et al. 1986; Vogt and Mistretta 1990). In light of this convergence, one potential function of inhibition may be to provide a stabilizing mechanism to balance excitation (Roux and Buzsaki 2015). As seen in Fig. 9, increasing depolarization ultimately results in an (inhibition sensitive) depolarization block. The lower thresholds observed in GABA+ neurons (Table 1) could potentially “accelerate” feedforward inhibition to more effectively balance arriving excitatory input (Roux and Buzsaki 2015). Thus, in the rNST, a circuit for feedforward inhibition could provide a means to maintain a systematic relationship between afferent and central firing over a wider dynamic range.
In the cNST, because the inflection point of IA is close to the resting membrane potential, small excitatory or inhibitory inputs can have a large impact on cell excitability (Bailey et al. 2007; Strube et al. 2015). Thus, under conditions of either tonic or phasic inhibition, neurons with IA (or Ih) would be differentially sensitive to afferent (excitatory) input. Furthermore, computational models suggest that IA can function as a gain control mechanism (Patel et al. 2012). We observed that GABA− neurons with IA exhibited a highly significant divisive gain change compared with GABA− neurons without IA. That is, optogenetic inhibitory modulation of GABA− neurons with IA suppressed the output of the neurons proportionally across different frequencies of afferent stimulation. This change is similar to suppression in visual cortex neurons after activating parvalbumin-positive GABAergic neurons where pyramidal neuron responses showed a proportional suppression to visual stimuli but little alteration in tuning (Atallah et al. 2012; Wilson et al. 2012).
However, previous data also suggest that GABAergic inhibition can impact gustatory tuning (Smith and Li 1998). When a GABA antagonist was infused into the rNST, neurons became more responsive to gustatory input and more broadly tuned, i.e., sideband sensitivity was disproportionately increased (Smith and Li 1998). The implication is that neurons are under “tonic” inhibition that suppresses sideband sensitivity. A subtractive form of inhibition can produce such disproportionate suppression as demonstrated by activating somatostatin-containing GABAergic neurons in visual cortex (Wilson et al. 2012). In our study, GABA− neurons without IA had a larger, though not statistically significant, subtractive form of suppression.
A functionally significant phenomenon that could be mediated by rNST inhibitory processes has been studied by Scott and colleagues (reviewed in Scott and Verhagen 2000), who demonstrated that responses to sweet stimuli are selectively altered after altering blood glucose or insulin. Whether this represents a divisive or subtractive type of change is unclear, since these studies observed multiunit responses to taste stimuli. It would be interesting to determine whether such changes occur in neurons preferentially responsive to sweet stimuli, suggesting a divisive effect and gain control or whether they occur for sideband responses in broadly responsive cells, indicative of a subtractive effect and changes in tuning.
Inhibition and hyperpolarization-sensitive channels afford a wide array of mechanisms to modulate taste activity over both long and short time frames. Recently, it has been demonstrated that IA and its effect on firing properties of cNST neurons are altered in several disease states including hypertension (Belugin and Mifflin 2005; Sundaram et al. 1997) and high-fat diet-induced models of obesity, where IA expression is altered in cNST (Boxwell et al. 2015), DMV (Browning et al. 2013), and gut smooth muscle (Li et al. 2013). Regulation of IA expression thus provides a potential mechanism for modulating taste-related behaviors associated with metabolic state. Our results, however, speak more directly to the role of inhibition in information transfer within the rNST over shorter time frames. Heterogeneous outputs that include local reflex pathways and perceptual/homeostatic substrates via an ascending pathway may require different inhibitory mechanisms to produce the appropriate output. Subsets of local and output neurons with different constellations of voltage-sensitive channels may shape such outputs through divisive and subtractive inhibitory circuits involving feedforward and tonic inhibition and disinhibition.
GRANTS
This work was supported by National Institute on Deafness and Other Communication Disorders Grants R01 DC-000416 to S. P. Travers and R21 DC-013676 to J. B. Travers.
DISCLOSURES
No conflicts of interest, financial or otherwise, are declared by the author(s).
AUTHOR CONTRIBUTIONS
Z.C., S.P.T., and J.B.T. conception and design of research; Z.C. performed experiments; Z.C., S.P.T., and J.B.T. interpreted results of experiments; Z.C., S.P.T., and J.B.T. edited and revised manuscript; Z.C., S.P.T., and J.B.T. approved final version of manuscript; S.P.T. and J.B.T. analyzed data; S.P.T. and J.B.T. prepared figures; J.B.T. drafted manuscript.
ACKNOWLEDGMENTS
The authors thank Jacob Harley for extensive neurophysiological data analysis, Rami Laham for performing the neuron counts in Fig. 3, Grace Houser for immunohistochemistry and confocal microscopy, and Alison Boxwell for thoughtful discussions and suggestions on the manuscript. We also thank Dr. J. F. Brunet for the gift of the PHOX2b antibody.
REFERENCES
- Andresen MC, Yang M. Dynamics of sensory afferent synaptic transmission in aortic baroreceptor regions on nucleus tractus solitarius. J Neurophysiol 74: 1518–1528, 1995. [DOI] [PubMed] [Google Scholar]
- Atallah BV, Bruns W, Carandini M, Scanziani M. Parvalbumin-expressing interneurons linearly transform cortical responses to visual stimuli. Neuron 73: 159–170, 2012. [DOI] [PMC free article] [PubMed] [Google Scholar]
- Bailey TW, Hermes SM, Whittier KL, Aicher SA, Andresen MC. A-type potassium channels differentially tune afferent pathways from rat solitary tract nucleus to caudal ventrolateral medulla or paraventricular hypothalamus. J Physiol 582: 613–628, 2007. [DOI] [PMC free article] [PubMed] [Google Scholar]
- Bartel DL. Glial responses after chorda tympani nerve injury. J Comp Neurol 520: 2712–2729, 2012. [DOI] [PMC free article] [PubMed] [Google Scholar]
- Belugin S, Mifflin S. Transient voltage-dependent potassium currents are reduced in NTS neurons isolated from renal wrap hypertensive rats. J Neurophysiol 94: 3849–3859, 2005. [DOI] [PubMed] [Google Scholar]
- Boxwell A. Information Processing in the Rostral Solitary Nucleus: Modulation and Modeling (PhD dissertation). Columbus, OH: Ohio State Univ, 2015, p. 128. [Google Scholar]
- Boxwell AJ, Chen Z, Mathes CM, Spector AC, Le Roux CW, Travers SP, Travers JB. Effects of high-fat diet and gastric bypass on neurons in the caudal solitary nucleus. Physiol Behav 152: 329–339, 2015. [DOI] [PMC free article] [PubMed] [Google Scholar]
- Boxwell AJ, Yanagawa Y, Travers SP, Travers JB. The mu-opioid receptor agonist DAMGO presynaptically suppresses solitary tract-evoked input to neurons in the rostral solitary nucleus. J Neurophysiol 109: 2815–2826, 2013. [DOI] [PMC free article] [PubMed] [Google Scholar]
- Breza JM, Travers SP. P2X2 receptor terminal field demarcates a “transition zone” for gustatory and mechanosensory processing in the mouse nucleus tractus solitarius. Chem Senses (April 30, 2016). doi: 10.1093/chemse/bjw055. [DOI] [PMC free article] [PubMed] [Google Scholar]
- Browning KN, Fortna SR, Hajnal A. Roux-en-Y gastric bypass reverses the effects of diet-induced obesity to inhibit the responsiveness of central vagal motoneurones. J Physiol 591: 2357–2372, 2013. [DOI] [PMC free article] [PubMed] [Google Scholar]
- Contreras RJ, Gomez MM, Norgren R. Central origins of cranial nerve parasympathetic neurons in the rat. J Comp Neurol 190: 373–394, 1980. [DOI] [PubMed] [Google Scholar]
- Corson JA, Bradley RM. Physiological and anatomical properties of intramedullary projection neurons in rat rostral nucleus of the solitary tract. J Neurophysiol 110: 1130–1143, 2013. [DOI] [PMC free article] [PubMed] [Google Scholar]
- Corson JA, Erisir A. Monosynaptic convergence of chorda tympani and glossopharyngeal afferents onto ascending relay neurons in the nucleus of the solitary tract: a high-resolution confocal and correlative electron microscopy approach. J Comp Neurol 521: 2907–2926, 2013. [DOI] [PMC free article] [PubMed] [Google Scholar]
- Davis BJ. GABA-like immunoreactivity in the gustatory zone of the nucleus of the solitary tract in the hamster: light and electron microscopic studies. Brain Res Bull 30: 69–77, 1993. [DOI] [PubMed] [Google Scholar]
- Del Negro CA, Chandler SH. Physiological and theoretical analysis of K+ currents controlling discharge in neonatal rat mesencephalic trigeminal neurons. J Neurophysiol 77: 537–553, 1997. [DOI] [PubMed] [Google Scholar]
- Doetsch GS, Erickson RP. Synaptic processing of taste-quality information in the nucleus tractus solitarius of the rat. J Neurophysiol 33: 490–507, 1970. [DOI] [PubMed] [Google Scholar]
- Doyle MW, Andresen MC. Reliability of monosynaptic sensory transmission in brain stem neurons in vitro. J Neurophysiol 85: 2213–2223, 2001. [DOI] [PubMed] [Google Scholar]
- Doyle MW, Bailey TW, Jin YH, Andresen MC. Vanilloid receptors presynaptically modulate cranial visceral afferent synaptic transmission in nucleus tractus solitarius. J Neurosci 22: 8222–8229, 2002. [DOI] [PMC free article] [PubMed] [Google Scholar]
- Fong AY, Stornetta RL, Foley CM, Potts JT. Immunohistochemical localization of GAD67-expressing neurons and processes in the rat brainstem: subregional distribution in the nucleus tractus solitarius. J Comp Neurol 493: 274–290, 2005. [DOI] [PubMed] [Google Scholar]
- Ganchrow D, Ganchrow JR, Cicchini V, Bartel DL, Kaufman D, Girard D, Whitehead MC. Nucleus of the solitary tract in the C57BL/6J mouse: subnuclear parcellation, chorda tympani nerve projections, and brainstem connections. J Comp Neurol 522: 1565–1596, 2014. [DOI] [PMC free article] [PubMed] [Google Scholar]
- Gill CF, Madden JM, Roberts BP, Evans LD, King MS. A subpopulation of neurons in the rat rostral nucleus of the solitary tract that project to the parabrachial nucleus express glutamate-like immunoreactivity. Brain Res 821: 251–262, 1999. [DOI] [PubMed] [Google Scholar]
- Grabauskas G. Time course of GABA in the synaptic clefts of inhibitory synapses in the rostral nucleus of the solitary tract. Neurosci Lett 373: 10–15, 2005. [DOI] [PubMed] [Google Scholar]
- Grabauskas G, Bradley RM. Synaptic interactions due to convergent input from gustatory afferent fibers in the rostral nucleus of the solitary tract. J Neurophysiol 76: 2919–2927, 1996. [DOI] [PubMed] [Google Scholar]
- Grabauskas G, Bradley RM. Tetanic stimulation induces short-term potentiation of inhibitory synaptic activity in the rostral nucleus of the solitary tract. J Neurophysiol 79: 595–604, 1998. [DOI] [PubMed] [Google Scholar]
- Gu C, Barry J. Function and mechanism of axonal targeting of voltage-sensitive potassium channels. Prog Neurobiol 94: 115–132, 2011. [DOI] [PMC free article] [PubMed] [Google Scholar]
- Halsell CB, Travers SP, Travers JB. Ascending and descending projections from the rostral nucleus of the solitary tract originate from separate neuronal populations. Neuroscience 72: 185–197, 1996. [DOI] [PubMed] [Google Scholar]
- He C, Chen F, Li B, Hu Z. Neurophysiology of HCN channels: from cellular functions to multiple regulations. Prog Neurobiol 112: 1–23, 2014. [DOI] [PubMed] [Google Scholar]
- Hsiao CF, Gougar K, Asai J, Chandler SH. Intrinsic membrane properties and morphological characteristics of interneurons in the rat supratrigeminal region. J Neurosci Res 85: 3673–3686, 2007. [DOI] [PubMed] [Google Scholar]
- Johnston J, Forsythe ID, Kopp-Scheinpflug C. Going native: voltage-gated potassium channels controlling neuronal excitability. J Physiol 588: 3187–3200, 2010. [DOI] [PMC free article] [PubMed] [Google Scholar]
- Kang BJ, Chang DA, Mackay DD, West GH, Moreira TS, Takakura AC, Gwilt JM, Guyenet PG, Stornetta RL. Central nervous system distribution of the transcription factor Phox2b in the adult rat. J Comp Neurol 503: 627–641, 2007. [DOI] [PubMed] [Google Scholar]
- King MS, Bradley RM. Relationship between structure and function of neurons in the rat rostral nucleus tractus solitarii. J Comp Neurol 344: 50–64, 1994. [DOI] [PubMed] [Google Scholar]
- Lasiter PS, Kachele DL. Organization of GABA and GABA-transaminase containing neurons in the gustatory zone of the nucleus of the solitary tract. Brain Res Bull 21: 623–636, 1988. [DOI] [PubMed] [Google Scholar]
- Leonard NL, Renehan WE, Schweitzer L. Structure and function of gustatory neurons in the nucleus of the solitary tract. IV. The morphology and synaptology of GABA-immunoreactive terminals. Neuroscience 92: 151–162, 1999. [DOI] [PubMed] [Google Scholar]
- Li CS, Davis BJ, Smith DV. Opioid modulation of taste responses in the nucleus of the solitary tract. Brain Res 965: 21–34, 2003. [DOI] [PubMed] [Google Scholar]
- Li S, Maude-Griffin R, Pullan AJ, Chen JD. Gastric emptying and Ca2+ and K+ channels of circular smooth muscle cells in diet-induced obese prone and resistant rats. Obesity (Silver Spring) 21: 326–335, 2013. [DOI] [PubMed] [Google Scholar]
- Liu H, Behbehani MM, Smith DV. The influence of GABA on cells in the gustatory region of the hamster solitary nucleus. Chem Senses 18: 285–305, 1993. [Google Scholar]
- Lundy RF, Norgren R. Gustatory system. In: The Rat Nervous System, edited by Paxinos G. San Diego, CA: Elsevier, 2015, p. 733–760. [Google Scholar]
- Miles R. Frequency dependence of synaptic transmission in nucleus of the solitary tract in vitro. J Neurophysiol 55: 1076–1090, 1986. [DOI] [PubMed] [Google Scholar]
- Oliva AA Jr, Jiang M, Lam T, Smith KL, Swann JW. Novel hippocampal interneuronal subtypes identified using transgenic mice that express green fluorescent protein in GABAergic interneurons. J Neurosci 20: 3354–3368, 2000. [DOI] [PMC free article] [PubMed] [Google Scholar]
- Patel AX, Murphy N, Burdakov D. Tuning low-voltage-activated A-current for silent gain modulation. Neural Comput 24: 3181–3190, 2012. [DOI] [PMC free article] [PubMed] [Google Scholar]
- Pattyn A, Morin X, Cremer H, Goridis C, Brunet JF. Expression and interactions of the two closely related homeobox genes Phox2a and Phox2b during neurogenesis. Development 124: 4065–4075, 1997. [DOI] [PubMed] [Google Scholar]
- Peters JH, McDougall SJ, Fawley JA, Andresen MC. TRPV1 marks synaptic segregation of multiple convergent afferents at the rat medial solitary tract nucleus. PLoS One 6: e25015, 2011. [DOI] [PMC free article] [PubMed] [Google Scholar]
- Pi HJ, Hangya B, Kvitsiani D, Sanders JI, Huang ZJ, Kepecs A. Cortical interneurons that specialize in disinhibitory control. Nature 503: 521–524, 2013. [DOI] [PMC free article] [PubMed] [Google Scholar]
- Roux L, Buzsaki G. Tasks for inhibitory interneurons in intact brain circuits. Neuropharmacology 88: 10–23, 2015. [DOI] [PMC free article] [PubMed] [Google Scholar]
- Saha S, Henderson Z, Batten TF. Somatostatin immunoreactivity in axon terminals in rat nucleus tractus solitarii arising from central nucleus of amygdala: coexistence with GABA and postsynaptic expression of sst2A receptor. J Chem Neuroanat 24: 1–13, 2002. [DOI] [PubMed] [Google Scholar]
- Salinas E, Sejnowski TJ. Gain modulation in the central nervous system: where behavior, neurophysiology, and computation meet. Neuroscientist 7: 430–440, 2001. [DOI] [PMC free article] [PubMed] [Google Scholar]
- Scott TR, Verhagen JV. Taste as a factor in the management of nutrition. Nutrition 16: 874–885, 2000. [DOI] [PubMed] [Google Scholar]
- Semyanov A, Walker MC, Kullmann DM, Silver RA. Tonically active GABA A receptors: modulating gain and maintaining the tone. Trends Neurosci 27: 262–269, 2004. [DOI] [PubMed] [Google Scholar]
- Sharp AA, Finger TE. GABAergic modulation of primary gustatory afferent synaptic efficacy. J Neurobiol 52: 133–143, 2002. [DOI] [PubMed] [Google Scholar]
- Smith DV, Li CS. Tonic GABAergic inhibition of taste-responsive neurons in the nucleus of the solitary tract. Chem Senses 23: 159–169, 1998. [DOI] [PubMed] [Google Scholar]
- Smith DV, Li C. GABA-mediated corticofugal inhibition of taste-responsive neurons in the nucleus of the solitary tract. Brain Res 858: 408–415, 2000. [DOI] [PubMed] [Google Scholar]
- Smith DV, Li CS, Davis BJ. Excitatory and inhibitory modulation of taste responses in the hamster brainstem. Ann NY Acad Sci 855: 450–456, 1998. [DOI] [PubMed] [Google Scholar]
- Stornetta RL, Guyenet PG. Distribution of glutamic acid decarboxylase mRNA-containing neurons in rat medulla projecting to thoracic spinal cord in relation to monoaminergic brainstem neurons. J Comp Neurol 407: 367–380, 1999. [PubMed] [Google Scholar]
- Strube C, Saliba L, Moubarak E, Penalba V, Martin-Eauclaire MF, Tell F, Clerc N. Kv4 channels underlie A-currents with highly variable inactivation time courses but homogeneous other gating properties in the nucleus tractus solitarii. Pflügers Arch 467: 789–803, 2015. [DOI] [PubMed] [Google Scholar]
- Sundaram K, Johnson SM, Felder RB. Altered expression of delayed excitation in medial NTS neurons of spontaneously hypertensive rats. Neurosci Lett 225: 205–209, 1997. [DOI] [PubMed] [Google Scholar]
- Suwabe T, Bradley RM. Characteristics of rostral solitary tract nucleus neurons with identified afferent connections that project to the parabrachial nucleus in rats. J Neurophysiol 102: 546–555, 2009. [DOI] [PMC free article] [PubMed] [Google Scholar]
- Sweazey RD. Distribution of GABA and glycine in the lamb nucleus of the solitary tract. Brain Res 737: 275–286, 1996. [DOI] [PubMed] [Google Scholar]
- Sweazey RD, Smith DV. Convergence onto hamster medullary taste neurons. Brain Res 408: 173–184, 1987. [DOI] [PubMed] [Google Scholar]
- Taniguchi H, He M, Wu P, Kim S, Paik R, Sugino K, Kvitsiani D, Fu Y, Lu J, Lin Y, Miyoshi G, Shima Y, Fishell G, Nelson SB, Huang ZJ. A resource of Cre driver lines for genetic targeting of GABAergic neurons in cerebral cortex. Neuron 71: 995–1013, 2011. [DOI] [PMC free article] [PubMed] [Google Scholar]
- Tell F, Bradley RM. Whole-cell analysis of ionic currents underlying the firing pattern of neurons in the gustatory zone of the nucleus tractus solitarii. J Neurophysiol 71: 479–492, 1994. [DOI] [PubMed] [Google Scholar]
- Travers JB, Herman K, Yoo J, Travers SP. Taste reactivity and NST FOS expression in “GIN” mice (Abstract). Am Chem Soc Abstracts, 2005. [Google Scholar]
- Travers JB, Herman K, Yoo J, Travers SP. Taste reactivity and Fos expression in GAD1-EGFP transgenic mice. Chem Senses 32: 129–137, 2007. [DOI] [PubMed] [Google Scholar]
- Travers JB, Smith DV. Gustatory sensitivities in neurons of the hamster nucleus tractus solitarius. Sens Processes 3: 1–26, 1979. [PubMed] [Google Scholar]
- Travers SP, Pfaffmann C, Norgren R. Convergence of lingual and palatal gustatory neural activity in the nucleus of the solitary tract. Brain Res 365: 305–320, 1986. [DOI] [PubMed] [Google Scholar]
- Uteshev VV, Smith DV. Cholinergic modulation of neurons in the gustatory region of the nucleus of the solitary tract. Brain Res 1084: 38–53, 2006. [DOI] [PubMed] [Google Scholar]
- Venugopal S, Boulant JA, Chen Z, Travers JB. Intrinsic membrane properties of pre-oromotor neurons in the intermediate zone of the medullary reticular formation. Neuroscience 168: 31–47, 2010. [DOI] [PMC free article] [PubMed] [Google Scholar]
- Vogt MB, Mistretta CM. Convergence in mammalian nucleus of solitary tract during development and functional differentiation of salt taste circuits. J Neurosci 10: 3148–3157, 1990. [DOI] [PMC free article] [PubMed] [Google Scholar]
- Wang L, Bradley RM. Influence of GABA on neurons of the gustatory zone of the rat nucleus of the solitary tract. Brain Res 616: 144–153, 1993. [DOI] [PubMed] [Google Scholar]
- Wang L, Bradley RM. In vitro study of afferent synaptic transmission in the rostral gustatory zone of the rat nucleus of the solitary tract. Brain Res 702: 188–198, 1995. [DOI] [PubMed] [Google Scholar]
- Wang M, Bradley RM. Properties of GABAergic neurons in the rostral solitary tract nucleus in mice. J Neurophysiol 103: 3205–3218, 2010a. [DOI] [PMC free article] [PubMed] [Google Scholar]
- Wang M, Bradley RM. Synaptic characteristics of rostral nucleus of the solitary tract neurons with input from the chorda tympani and glossopharyngeal nerves. Brain Res 1328: 71–78, 2010b. [DOI] [PMC free article] [PubMed] [Google Scholar]
- Whitehead MC. Anatomy of the gustatory system in the hamster: synaptology of facial afferent terminals in the solitary nucleus. J Comp Neurol 244: 72–85, 1986. [DOI] [PubMed] [Google Scholar]
- Whitehead MC. Neuronal architecture of the nucleus of the solitary tract in the hamster. J Comp Neurol 276: 547–572, 1988. [DOI] [PubMed] [Google Scholar]
- Whitehead MC, McPheeters M, Savoy LD, Frank ME. Morphological types of neurons located at taste-responsive sites in the solitary nucleus of the hamster. Microsc Res Tech 26: 245–259, 1993. [DOI] [PubMed] [Google Scholar]
- Wilson NR, Runyan CA, Wang FL, Sur M. Division and subtraction by distinct cortical inhibitory networks in vivo. Nature 488: 343–348, 2012. [DOI] [PMC free article] [PubMed] [Google Scholar]


