Using the active barrel cortex slice preparation, we show that inhibitory interneurons spike synchronously during spontaneous cortical Up states. Synchronized inhibition depends minimally on electrical synapses between interneurons and most likely arises from excitatory-inhibitory interactions. Our results suggest that when local excitatory cells activate interneurons, interneuron spike synchrony does not rely on inhibitory-inhibitory interactions or electrical synapses. Our study provides new mechanistic insights into the nature of gamma-synchronized inhibition in local cortical circuits.
Keywords: cortex, inhibition, gamma, electrical synapse, oscillation
Abstract
Synaptic inhibition plays a crucial role in the precise timing of spiking activity in the cerebral cortex. Synchronized, rhythmic inhibitory activity in the gamma (30–80 Hz) range is thought to be especially important for the active, information-processing neocortex, but the circuit mechanisms that give rise to synchronized inhibition are uncertain. In particular, the relative contributions of reciprocal inhibitory connections, excitatory-inhibitory interactions, and electrical synapses to precise spike synchrony among inhibitory interneurons are not well understood. Here we describe experiments on mouse barrel cortex in vitro as it spontaneously generates slow (<1 Hz) oscillations (Up and Down states). During Up states, inhibitory postsynaptic currents (IPSCs) are generated at gamma frequencies and are more synchronized than excitatory postsynaptic currents (EPSCs) among neighboring pyramidal cells. Furthermore, spikes in homotypic pairs of interneurons are more synchronized than in pairs of pyramidal cells. Comparing connexin36 knockout and wild-type animals, we found that electrical synapses make a minimal contribution to synchronized inhibition during Up states. Estimations of the delays between EPSCs and IPSCs in single pyramidal cells showed that excitation often preceded inhibition by a few milliseconds. Finally, tonic optogenetic activation of different interneuron subtypes in the absence of excitation led to only weak synchrony of IPSCs in pairs of pyramidal neurons. Our results suggest that phasic excitatory inputs are indispensable for synchronized spiking in inhibitory interneurons during Up states and that electrical synapses play a minimal role.
NEW & NOTEWORTHY
Using the active barrel cortex slice preparation, we show that inhibitory interneurons spike synchronously during spontaneous cortical Up states. Synchronized inhibition depends minimally on electrical synapses between interneurons and most likely arises from excitatory-inhibitory interactions. Our results suggest that when local excitatory cells activate interneurons, interneuron spike synchrony does not rely on inhibitory-inhibitory interactions or electrical synapses. Our study provides new mechanistic insights into the nature of gamma-synchronized inhibition in local cortical circuits.
synchronization of neuronal populations in the cortex provides a framework for the processing of information in spatiotemporally segregated units (Buzsáki 2006; Buzsáki and Watson 2012). Grouping of neuronal subnetworks by synchronized network oscillations might fulfill various roles of the cortex, including the encoding of complex sensory objects (binding-by-synchrony) (Singer and Gray 1995), attentional selection of stimuli (Fries et al. 2001), communication between disparate cortical regions (communication-through-coherence) (Fries 2009), and spike-timing-dependent synaptic plasticity (Dan and Poo 2004). Synchronized fluctuations at gamma (30–80 Hz) frequencies are thought to be especially relevant to these functions.
Synchronized spiking of cortical inhibitory interneurons, particularly at gamma frequencies, is considered to be of paramount importance for controlling the timing and reliability of spiking in the excitatory pyramidal neuron population (Lytton and Sejnowski 1991; van Vreeswijk et al. 1994; Cobb et al. 1995; Hasenstaub et al. 2005; Long et al. 2005; Cardin et al. 2009). Thus synchronized inhibition likely provides the basis for the temporal organization of neuronal populations during active cortical processing. Precise (within a few ms) spike synchronization among inhibitory interneurons constitutes an especially effective signal for network-wide temporal organization, yet the mechanisms that underlie such precise synchrony are unclear. In principle, several basic motifs of synaptic connectivity could generate precise spike synchrony among inhibitory interneurons, including reciprocal inhibitory interactions (Wang and Rinzel 1992; Wang and Buzsáki 1996; Hu et al. 2011) and excitatory feedforward and inhibitory feedback loops (Wilson and Cowan 1972; Börgers and Kopell 2003; Hansel and Mato 2003); in reference to gamma-band synchrony, these mechanisms are often referred to as interneuron gamma (ING) and pyramidal-interneuron gamma (PING), respectively (Whittington et al. 2000; Tiesinga and Sejnowski 2009). Furthermore, in the adult neocortex, inhibitory interneurons of the same subtype form an electrically coupled network (Galarreta and Hestrin 1999; Gibson et al. 1999; Beierlein et al. 2000; Amitai et al. 2002; Fukuda et al. 2006). In paired recordings of electrically coupled cortical interneurons, injection of suprathreshold depolarizing current into these cells leads to precise and stable spike synchrony (Galarreta and Hestrin 1999; Gibson et al. 1999, 2005; Mancilla et al. 2007). Persistent spike synchrony between particular subtypes of electrically coupled interneurons also emerges when these subtypes are pharmacologically activated (Beierlein et al. 2000; Deans et al. 2001; Long et al. 2005; Fanselow et al. 2008). The extent to which electrical synapses between interneurons play a role when the recurrent excitatory network is activated, however, is not clear. In general, in active cortical networks the relative contributions of different chemical and electrical synaptic connectivity motifs to synchronized inhibition are not well understood.
We investigated the mechanisms of synchronized inhibition in an activated slice preparation of mouse barrel cortex (Neske et al. 2015). This preparation spontaneously generates network activity reminiscent of the slow (<1 Hz) cortical oscillations of slow-wave sleep, anesthesia, and quiet wakefulness (Steriade et al. 1993; Sanchez-Vives and McCormick 2000; Petersen et al. 2003; Neske 2016). During the depolarizing phases of this oscillation (Up states) the cortical network exhibits enhanced, locally synchronized fast (>10 Hz) activity, similar to that of the waking cortex (Steriade et al. 1996; Hasenstaub et al. 2005). Thus the mechanisms of synchronized discharge among inhibitory interneurons that accompany the emergence of Up states may also be similar to the mechanisms by which interneurons synchronize during active, information-processing states. Using the active barrel cortex slice preparation, we have combined several methods to study the circuit mechanisms of synchronized, gamma-frequency inhibition. These methods include paired whole cell recordings of different excitatory and inhibitory cell types, dissection of the temporal relations between excitatory and inhibitory synaptic barrages, analysis of the precise timing of action potentials between homotypic cell pairs, and genetic manipulations of various circuit elements within the local cortical network. Our experiments suggest that synchronized inhibition in active local cortical circuits depends principally on excitatory-inhibitory synaptic interactions and minimally on electrical synapses and inhibitory-inhibitory synaptic interactions.
MATERIALS AND METHODS
Mouse lines.
All procedures involving laboratory animals were approved by the Brown University Institutional Animal Care and Use Committee. For recordings (see Figs. 1–3), we used progeny from either homozygous parvalbumin (PV)- or somatostatin (SOM)-Cre mice [PV-Cre: B6;129P2- Pvalbtm1(cre)Arbr/J, SOM-Cre: STOCK Ssttm2.2(cre)Zjh/J; The Jackson Laboratory] crossed with the homozygous tdTomato reporter mouse [B6.Cg-Gt(ROSA)26Sortm9(CAG-tdTomato)/Hze/J; The Jackson Laboratory] (Neske et al. 2015). For recordings in which we compared connexin36 knockout (Cx36-KO) with wild-type (WT) animals, we crossed heterozygous Cx36-KO mice (Deans et al. 2001) of a mixed C57BL/6-FVB background. Progeny used from these crosses were either homozygous Cx36-KO or homozygous Cx36 WT. We used age-matched, littermate Cx36-KO/WT pairs for all experiments. For recordings (see Fig. 14), we crossed homozygous SOM-Cre mice with homozygous channelrhodopsin-2 (ChR2) reporter mice [B6.Cg-26Sortm32(CAG-COP4*H134R/EYFP)Hze/J; The Jackson Laboratory].
Fig. 1.
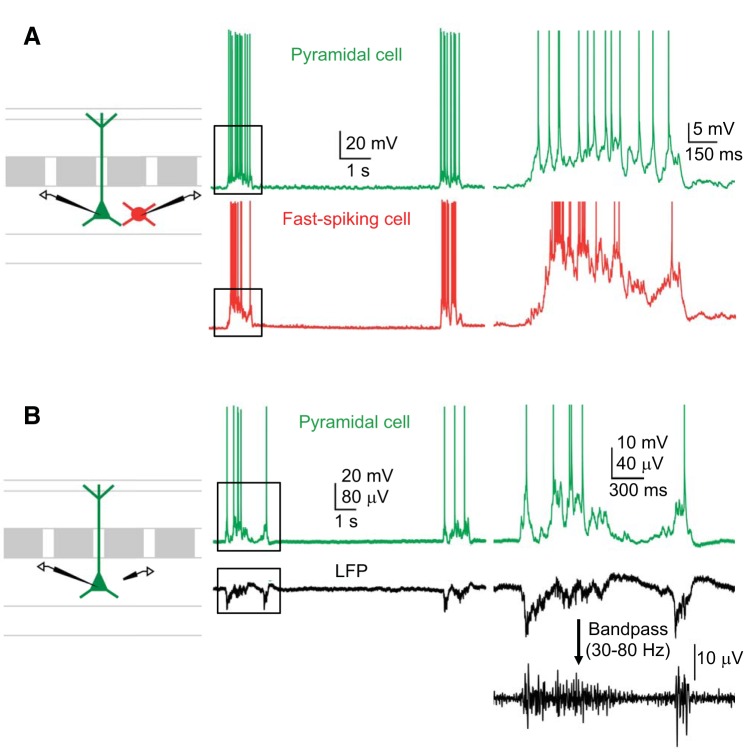
Spontaneous Up and Down states in mouse barrel cortex in vitro. A: example of spontaneous Up and Down states (the slow oscillation) in simultaneously recorded layer 5 pyramidal cell and fast-spiking interneuron. B: Up states recorded intracellularly are coincident with negative deflections of the infragranular local field potential (LFP). Fast oscillatory activity is evident in the band-pass filtered LFP (right). A and B, insets: action potentials are truncated. Example recordings are from slices from PV-tdTomato mice.
Fig. 3.
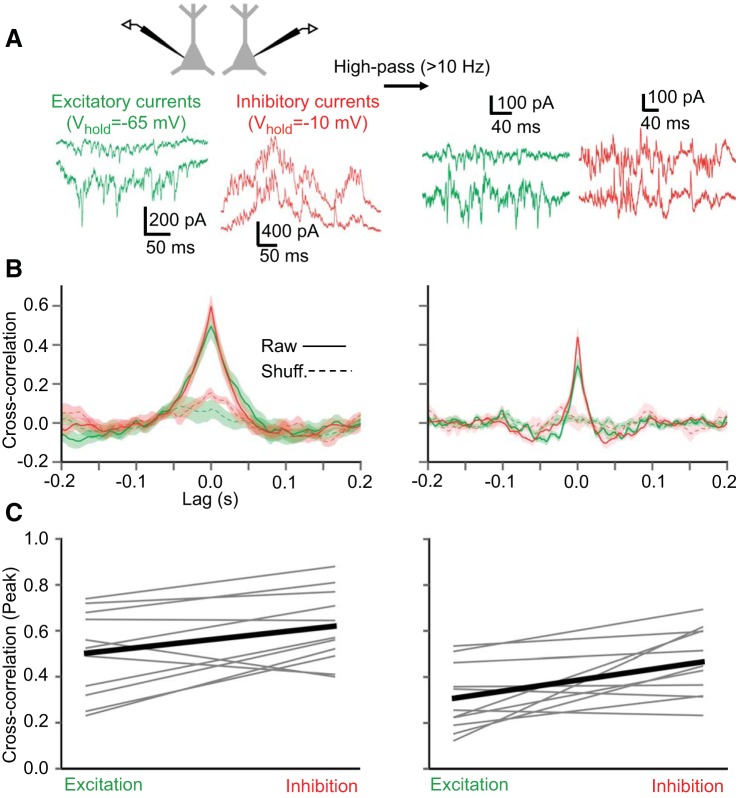
Cross correlations of IPSCs are stronger than those of EPSCs during Up states. A: simultaneous recordings of layer 5 pyramidal cells, isolating either their EPSCs or IPSCs during Up states for cross correlation analysis. Left: raw traces. Right: traces high-pass-filtered at 10 Hz. B: cross correlation (mean ± SE) of EPSCs and IPSCs (n = 11 pairs) for raw traces (left) and high-pass-filtered traces (right). C: comparisons of peak cross correlation in individual pyramidal cell pairs (n = 11 pairs) for raw traces (left) (P = 0.027, paired t-test) and high-pass-filtered traces (right) (P = 0.012, paired t-test).
Fig. 14.
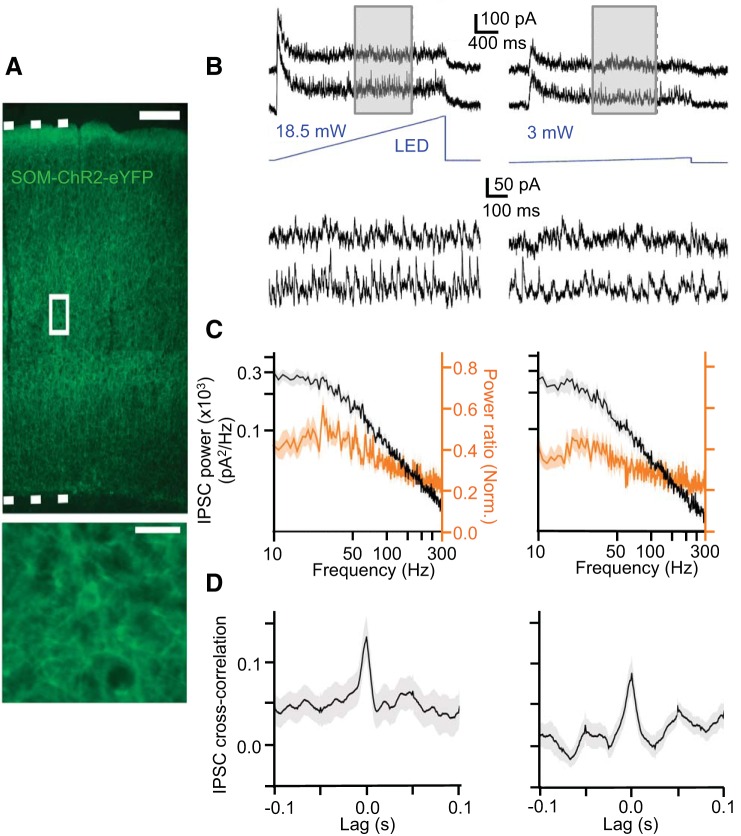
Moderate synchrony in photostimulated SOM cell network. A: endogenous expression of ChR2-EYFP in SOM cells in barrel cortex from the SOM-Cre/ChR2-reporter cross. Bottom, inset: expanded view of boxed region at top; single ChR2-expressing SOM cell is visible in middle of image. Top dotted line indicates pia, bottom dotted line indicates layer 6/white matter border. Scale bar (top) = 200 μm. Scale bar (bottom, inset) = 20 μm. B: example recordings of IPSCs in layer 5 pyramidal cell pairs during ramp light stimulation of SOM cells at high (18.5 mW) and low (3 mW) intensities. C: light-evoked IPSC power spectra (black) and mean normalized ratios between light-evoked IPSC power and baseline power (orange) (mean ± SE) (n = 16 cells). D: mean light-evoked IPSC cross correlation (mean ± SE) in pyramidal cell pairs (n = 8 pairs).
Viral injections.
For recordings (see Fig. 13), we introduced ChR2 into PV cells by viral injection into PV-tdTomato mice. Adeno-associated virus carrying a genetic construct for eYFP-tagged ChR2 was used: AAV2/1Ef1α.DIO.hChRr2(H134R)- eYFP.WPRE.hGH (Penn Vector Core). To minimize toxicity, virus used for injections was diluted with sterile saline from an initial titer of 3.41×10¹² IU/ml to a final titer of 3.41 × 10¹¹ IU/ml. For the surgical procedure involving stereotaxic viral injection, mice aged approximately postnatal day 10 were injected intraperitoneally with a ketamine (70 mg/kg)/Dormitor (0.25 mg/kg)/saline anesthesia cocktail. After a 10-min wait and checking for a pain response by a tail pinch, mice were placed in a stereotaxic frame, on which the scalp was opened to perform a craniotomy at (in mm) +3.4 (x) and −0.8 (y) from bregma. Virus (∼1.5 μl) was drawn into a glass micropipette that was then lowered slowly (∼1 mm/min) through the craniotomy into barrel cortex, 0.6 mm from the pial surface (approximately targeting cortical layer 5). Virus was then pressure ejected with a Picospritzer over the course of ∼30 min, the micropipette was left in place for ∼5 min, and then it was slowly withdrawn. After closing the scalp with Gluture, mice were awoken with Antisedan and allowed to recover on a heating pad for ∼1 h before being returned to their home cage. Virus was allowed to express for 10 days before experiments.
Fig. 13.
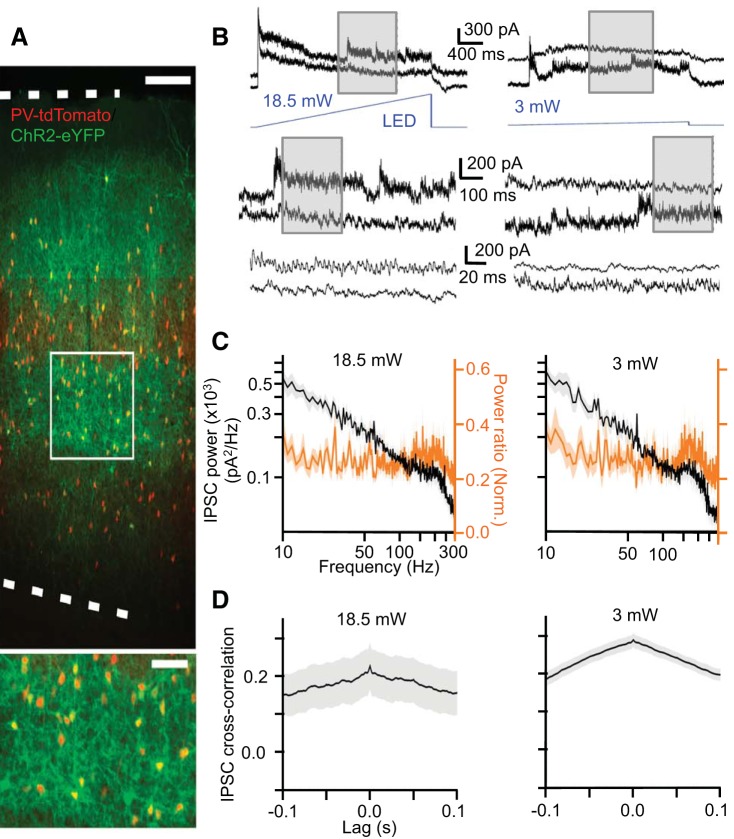
Weak synchrony in photostimulated PV cell network. A: Cre-dependent viral expression of ChR2-EYFP in barrel cortex of PV-Cre/tdTomato mouse. Bottom, inset: expanded view of boxed region at top. Top dotted line indicates pia, and bottom dotted line indicates layer 6/white matter border. Scale bar (top) = 200 μm. Scale bar (bottom, inset) = 60 μm. B: example recordings of IPSCs in layer 5 pyramidal cell pairs during ramp light stimulation of PV cells at high (18.5 mW) and low (3 mW) intensities. Vertical insets show sequentially expanded views of traces denoted by vertical dotted lines. C: light-evoked IPSC power spectra (black) and mean normalized ratios between light-evoked IPSC power and baseline power (orange) (mean ± SE) (n = 12 cells) D: mean light-evoked IPSC cross correlation (mean ± SE) in pyramidal cell pairs (n = 6 pairs).
Slice preparation.
Slices (320–400 μm) were prepared from barrel cortex of juvenile mice (mice of both sexes aged P14–P19). Mice were first anesthetized via inhalation of isoflurane and then decapitated with a scalpel blade, after which the head was transferred to ice-cold (∼0°C) artificial CSF (ACSF) saturated with a 95% O2-5% CO2 mixture for brain extraction. The composition of the ACSF was the following (in mM): 126 NaCl, 3 KCl, 10 dextrose, 26 NaHCO3, 1.25 NaH2PO4, 2 CaCl2, and 2 MgSO4. A mid-sagittal cut was made, and one hemisphere was glued on an angled block to cut slices in the thalamocortical plane for barrel cortex (Agmon and Connors 1991) with a Leica VT 1000S vibratome. ACSF temperature was ∼0°C throughout slicing. After slices were cut, they were immediately transferred to a submerged holding chamber containing ACSF maintained at ∼33°C for 30 min, after which the chamber was cooled to room temperature (∼24°C). Slices remained at this temperature until use in the recording chamber.
Electrophysiological recordings.
Slices were transferred to a recording chamber in which ACSF bathed both sides of the slice (model RC-27L; Warner Instruments). To promote Up and Down states, the flow rate of ACSF was kept high (∼10 ml/min) to ensure ample oxygenation of the tissue (Hájos et al. 2009; Hájos and Mody 2009). The temperature of the solution in the recording chamber was 33°C. Between recording sessions, slices were superfused with ACSF of the same composition as the solution in the holding chamber. During recordings of Up and Down states, the ACSF was changed to the following (in mM): 126 NaCl, 5 KCl, 20 dextrose, 26 NaHCO3, 1.25 NaH2PO4, 1 CaCl2, and 1 MgSO4. Spontaneous Up and Down states usually occurred within 1 min of changing the superfusing solution to this “modified ACSF.” For recordings (see Figs. 8 and 9), fast glutamatergic transmission was blocked with 50 μM APV and 20 μM DNQX.
Fig. 8.
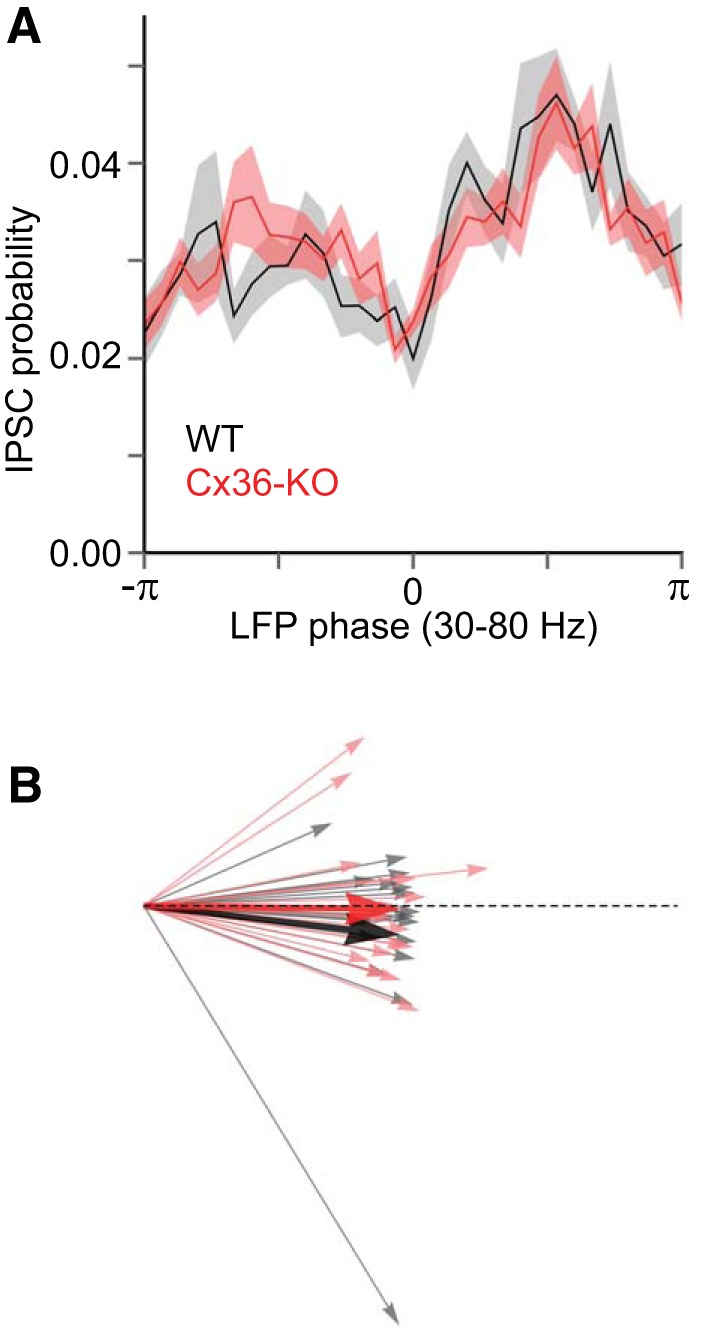
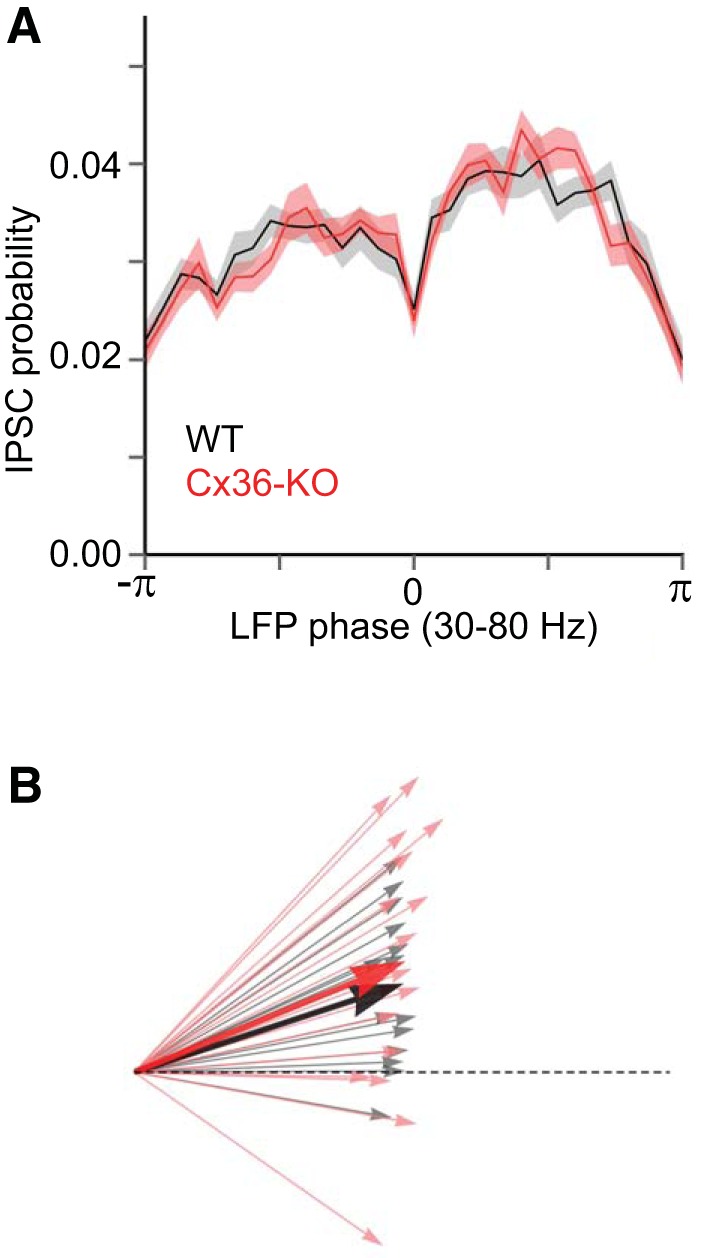
Up-state IPSCs in layer 5 are similarly modulated by LFP in Cx36-KO and WT animals. A: probability (mean ± SE) of IPSC occurrence is distributed similarly across phases of the gamma-bandpass-filtered LFP in WT (black) and Cx36-KO (red) animals (WT: n = 18 cells, KO: n = 17 cells). The trough of the LFP is at zero phase. B: quantification of phase modulation of IPSC occurrence by LFP by vector magnitude and phase angle. Each cell is represented by a vector whose magnitude relates to the strength of the phase modulation and whose phase angle relates to the preferred phase at which the modulation occurs. Dotted line is the unit vector {1,0}. Comparison of vector magnitude, r - WT: r = 0.50 ± 0.015, KO: r = 0.49 ± 0.013, P = 0.44, Mann-Whitney test. Comparison of phase angle, θ: WT: θ = −0.055 ± 0.052, KO: θ = −0.0029 ± 0.046, P = 0.91, Mann-Whitney test.
Fig. 9.
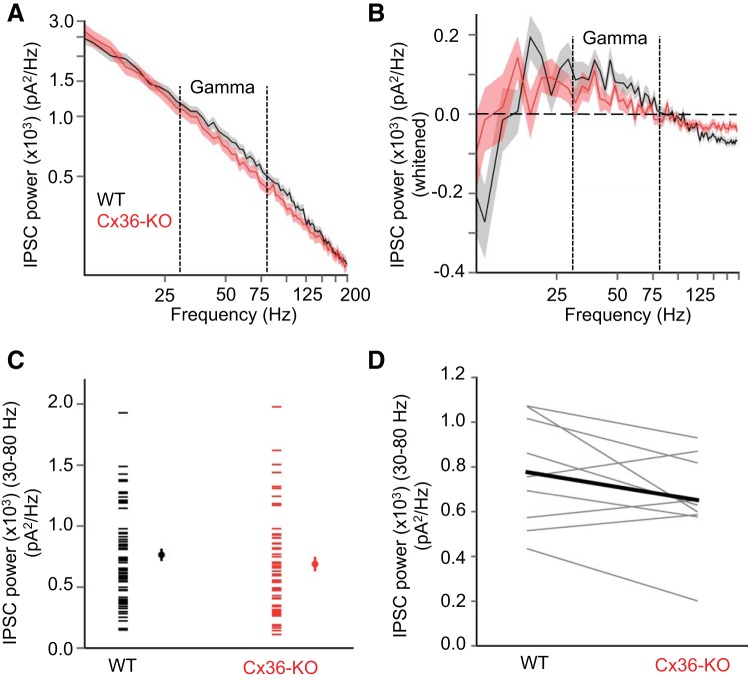
Up-state IPSC power in layer 4 is similar in Cx36-KO and WT animals. A: IPSC power spectra (mean ± SE) in layer 4 excitatory cells during Up states in WT (black) and Cx36-KO (red) animals (WT: n = 55 cells, KO: n = 51 cells). B: IPSC power spectra (mean ± SE) following removal of 1/f component (“whitened”). C: mean gamma power of IPSCs during Up states in layer 4 excitatory cells (WT: n = 55 cells, KO: n = 51 cells) (P = 0.66, t-test). Left points in each data set are from individual cells, and right points are mean ± SE. D: Data from B grouped as WT-KO littermate pairs (n = 7 WT-KO littermate pairs) (P = 0.66, paired t-test).
Cells were visualized with an Olympus BX50WI microscope equipped with DIC and epifluorescence optics. Pyramidal cells in layer 5 were targeted for recording based on their characteristic appearance under DIC optics (i.e., upward somatic taper and apical dendrite), whereas spiny stellate cells in layer 4 were targeted based on their comparatively small size and verified post hoc based on their regular-spiking physiology (Beierlein et al. 2003).
Whole cell recordings were performed with borosilicate glass pipettes pulled to final tip resistances between 4 and 7 MΩ. Micropipettes were filled with internal solution with the following (in mM): 130 K gluconate, 4 KCl, 2 NaCl, 10 HEPES, 0.2 EGTA, 4 ATP-Mg, 0.3 GTP-Na, and 14 phosphocreatine-2K. Internal solutions had a final osmolality of 290–295 mosmol/kgH2O and pH of 7.22–7.25. Recordings were made with a MultiClamp 700B patch-clamp amplifier (Axon), in which signals were first filtered (DC-10 kHz) and then digitized at 20 kHz with the Digidata 1440A data acquisition system and Clampex data acquisition software (Axon). Micropipette capacitance was compensated in the bath, and the bridge was balanced after attaining the whole cell configuration. Cells with bridge-balance values >30 MΩ were not used. For voltage-clamp recordings, series resistance compensation was always performed online, with prediction/correction set between 70 and 80%. Series resistances were continually monitored during experiments to ensure sufficient compensation. For local field potential (LFP) recordings, whole cell micropipettes had their tips broken off and then filled with ACSF, resulting in electrodes with resistances of ∼0.3 MΩ. Whole cell recordings were performed within ∼200 μm of the LFP electrode.
For each experiment involving comparisons between Cx36-KO and WT animals, we recorded from one WT and one Cx36-KO animal from the same litter within a 16-h period. Thus all recordings from Cx36-KO animals had age-matched, littermate controls. Experiments and data analysis were performed while blind to genotype.
Optogenetic methods.
For photostimulation of ChR2-expressing SOM and PV cells, collimated light from a white LED (cool white 5500K; Mightex) controlled by a Thorlabs LEDD1B driver was reflected through a dichroic mirror (FF655-Di01; Semrock) and a ×40 immersion objective (LUMPlanFl 40×/0.80 W; Olympus). This resulted in a spot size with a radius of ∼270 μm. The maximum possible light power at the focal plane (as measured by a S120C photodiode power sensor coupled to an analog power meter; Thorlabs) was 18.5 mW (measured at 465 nm). During recordings, the light spot was centered over the recorded pyramidal cell pairs. A “ramp” light stimulus was given by commanding an analog voltage ramp waveform from Clampex to the LED driver. During this stimulus, light was increased in intensity over 3 s from ∼0 mW to the intensity corresponding to the different maximum command voltages (5 V: 18.5 mW; 3 V: 17.5 mW; 2 V: 12.5 mW; 1 V: 6.5 mW; 0.5 V: 3 mW). Different maximum command voltages were used to activate ChR2-expressing cells over a range of light levels.
Data analysis: detection of Up states.
As in Neske et al. (2015), we detected the presence of spontaneous Up states in intracellular records by using the method of Seamari et al. (2007). Briefly, an Up state was considered to have initiated when a “fast” exponential moving average computed on the trace crossed and remained above a “slow” exponential moving average for at least 200 ms. An Up state was considered to have terminated when the “fast” exponential moving average crossed and remained below the “slow” exponential moving average for at least 400 ms. The smoothing constant for the “fast” and “slow” exponential moving average was 5×10⁻⁴ and 5×10⁻⁶, respectively.
Data analysis: power spectra and cross correlations of synaptic currents.
Excitatory postsynaptic currents (EPSCs) and inhibitory postsynaptic currents (IPSCs) were isolated in pyramidal cells and spiny stellate cells by voltage-clamping these cells at −65 mV or −10 mV, respectively. Since these holding potentials are not the exact reversal potentials for GABAA receptors or glutamate receptors, it is more correct to call the records “excitatory-” or “inhibitory-dominated postsynaptic currents”; for simplicity we will refer to them as EPSCs and IPSCs. Power spectra of synaptic currents during Up states were estimated by applying the standard periodogram method to the current traces after removing the first and last 100 ms. In some cases (see Figs. 2B, 5B, and 9B), the “1/f” component of the PSC power spectrum of each cell was removed from the raw power spectrum. These “whitened” power spectra (Buzsáki and Draguhn 2004) were generated by fitting a cell's raw power spectrum to a curve, y(f), of the form , where A and α are constants fit by nonlinear optimization. The resulting curve was then subtracted from the raw power spectrum to give the “whitened” power spectrum. Normalized cross correlations of synaptic currents from excitatory cell pairs were calculated from the current traces of each cell, also with the first and last 100 ms removed. To correct for cross correlations due only to generalized activation during Up states, we also calculated shuffled cross correlations. Shuffled cross correlations were calculated by cross correlating the Up state of one cell with a randomly selected different Up state in the other cell (without replacement). Power spectra and cross correlations of ∼10 Up states per recording were averaged to give the average power spectrum and average cross correlogram per cell or per pair of cells, respectively.
Fig. 2.
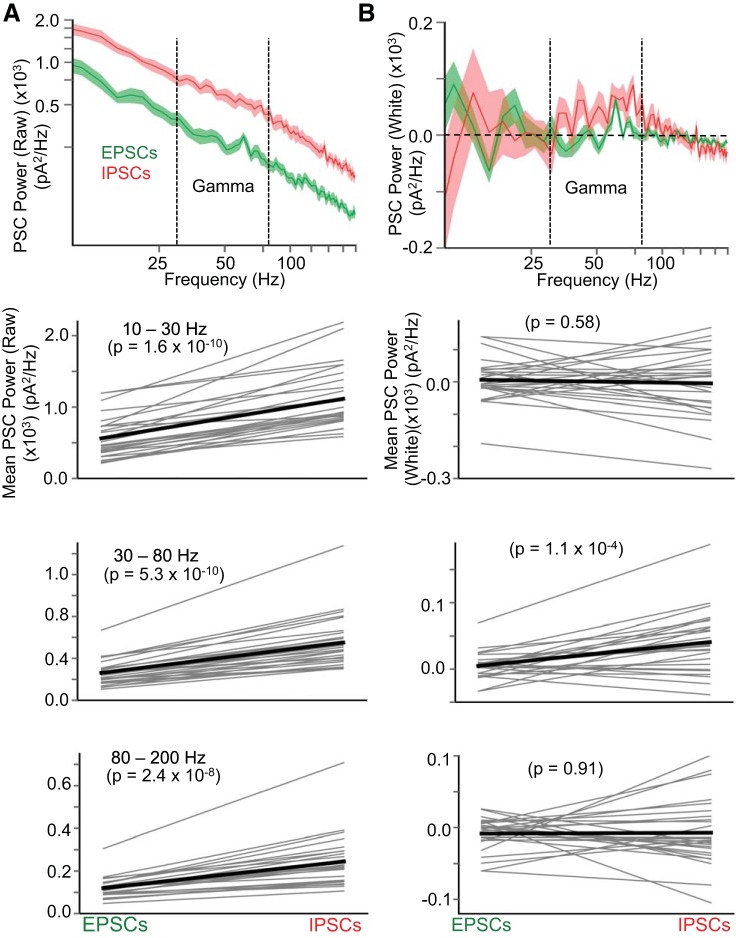
Higher gamma-frequency power in inhibitory postsynaptic currents (IPSCs) compared with excitatory postsynaptic currents (EPSCs). A, top: raw power spectra of EPSCs (green) and IPSCs (red) in layer 5 pyramidal cells during Up states (n = 26 cells). A, bottom: comparison of mean raw power between EPSCs and IPSCs in 3 different frequency bands: 10–30 Hz, 30–80 Hz (gamma), and 80–200 Hz. IPSCs carry significantly more raw power in all frequency bands compared with EPSCs (paired t-test), presumably due to the much larger magnitude of IPSCs compared with EPSCs (e.g., Neske et al. 2015). B, top: as in A, but power spectra are “whitened” (i.e., the 1/f component of the power spectrum is first subtracted from the raw power spectrum). Removal of the 1/f component reveals an excess of power in the gamma (30–80 Hz) band for IPSCs. B, bottom: as in A, but for whitened power spectra. Only the gamma (30–80 Hz) band was significantly larger for IPSCs compared with EPSCs (paired t-test).
Fig. 5.
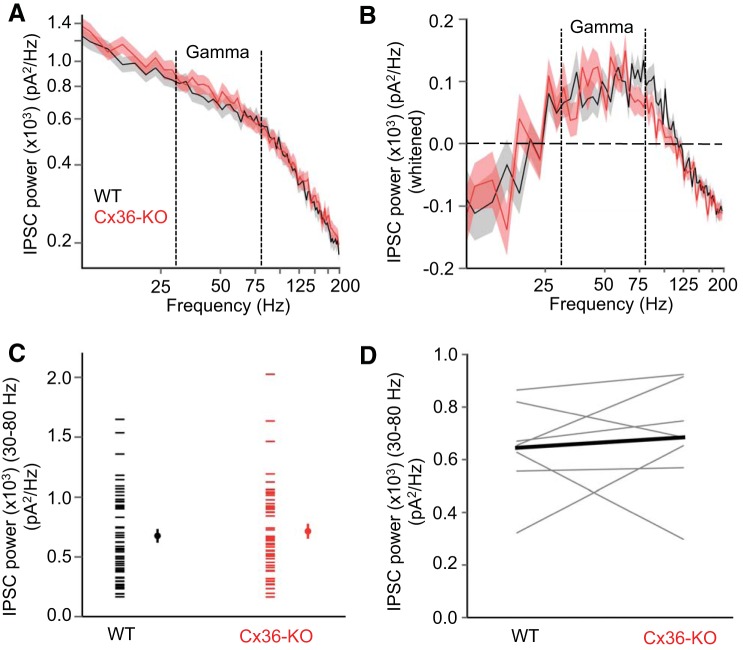
Gamma-band power of IPSCs in layer 5 is similar in Cx36-knockout (KO) and wild-type (WT) animals. A: IPSC power spectra (mean ± SE) in layer 5 pyramidal cells during Up states in WT (black) and Cx36-KO (red) animals. (WT: n = 74 cells, KO: n = 63 cells). B: IPSC power spectra (mean ± SE) following removal of 1/f component (“whitened”). C: mean gamma power of IPSCs during Up states in layer 5 pyramidal cells. Left points in each data set are from individual cells, and right points are mean ± SE. (WT: n = 74 cells, KO: n = 63 cells) (P = 0.13, t-test). C: data from B grouped as WT-KO littermate pairs (n = 9 WT-KO littermate pairs) (P = 0.082, paired t-test).
Data analysis: spike synchrony and the jitter-based synchrony index.
To detect the presence of spike synchrony in pairs of neurons during Up states, as well as to quantify the strength and precision of this synchrony, we relied on a class of jitter-based methods (Amarasingham et al. 2012). In particular, we used the jitter-based synchrony index (JBSI) (Agmon 2012). We calculated the JBSI from pairs of spike trains derived from the entire duration of paired recordings of neurons during spontaneous Up and Down states, resulting in >100 spikes per neuron. The JBSI was calculated as
| (1) |
where β = 2, NC is the number of spike coincidences within a 4-ms synchrony window, is the expected value of the number of spike coincidences after applying a jitter within an 8-ms window [detailed algorithm for calculation given in Agmon (2012)], and n1 is the number of spikes in the reference spike train.
The JBSI is bounded such that JBSI = 1 corresponds to perfect synchrony, JBSI = −1 corresponds to perfect antisynchrony, and JBSI = 0 corresponds to chance-level synchrony. The JBSI provides a measure of the strength of spike synchrony regardless of the statistical significance of this synchrony. To determine whether the synchrony of spike trains is statistically significant, a Z-score can be calculated from the quantities above:
| (2) |
where Var(NCJ) is the variance of the number of spike coincidences after applying the jitter. We considered Z > 2.6 (corresponding to P < 0.01 for a two-tailed Z-test) to be statistically significant. Spike trains from neuronal pairs during Up states with JBSI > 0.1 generally also had Z > 2.6. To estimate the precision of the spike synchrony for pairs with JBSI > 0.1, the jitter window was steadily decreased from 8 ms down to 0.4 ms. Since the JBSI measures the difference between the observed synchrony count and the synchrony count after a random jitter, as the jitter window is decreased, a point is reached at which there is no difference between the observed synchrony and the synchrony after jittering. After this point is reached, the JBSI decreases. This procedure is analogous to constructing cross correlograms with smaller and smaller bin sizes and finding the bin size in which the cross correlation in the central bin begins to decrease relative to adjacent bins. We considered the value of the jitter window at which the JBSI decreases to half its maximal value to be the precision of the spike synchrony (Agmon 2012).
Data analysis: construction of IPSC-LFP histograms.
As a measure of the temporal relations between inhibitory synaptic inputs and gamma-band (30–80 Hz) activity in the local cortical network, we constructed histograms of detected IPSCs relative to the phase of the gamma-bandpass-filtered LFP, which we compared between Cx36-KO and WT animals. Detection of inhibitory events was based on the method used by Compte et al. (2008). IPSCs were detected by passing current traces through a differentiator filter with a cutoff frequency of 200 Hz. A threshold for IPSC detection in the filtered trace was set at 2× the interquartile range of this trace.
The phase of the bandpass-filtered LFP was derived from its Hilbert transform, which transforms the signal into a time series of complex numbers. At each time point, the inverse tangent of the ratio between the imaginary and real parts of the complex number gives the phase of the bandpass-filtered LFP. Troughs of the LFP occurred at zero phase. Positive-going portions of the LFP were assigned phases from 0 to π (requiring no modification of the values given by the Hilbert transform), while negative-going portions of the LFP were assigned phases from 0 to -π (where these values were originally 2π to π). For each Up state (∼10 Up states per cell), detected IPSCs were counted in phase bins of width π/16. The total number of detected IPSCs in each phase bin was divided by the total number of all IPSCs detected, which gave a probability histogram of IPSC occurrence relative to bandpass-filtered LFP phase for a given cell. IPSC-LFP probability histograms for each cell were averaged to give the mean IPSC-LFP probability histogram for a given excitatory cell type and genotype (e.g., layer 5 pyramidal cells in WT animals). Methods from circular statistics were used to compare IPSC-LFP histograms between genotypes (Fisher 1993). For each cell, a vector r was calculated, with x- and y-components:
| (3) |
where αi are the LFP phases at which IPSCs occur. The magnitude of r is given by:
| (4) |
and the phase angle by:
| (5) |
The value of r can range from 0 to 1, with 0 indicating a random distribution of events in the oscillation cycle and 1 indicating a perfect concentration of events at one phase of the oscillation cycle. The value of θ is in radians. The statistical significance of the phase modulation of events can be evaluated with Rayleigh's Z test (Fisher 1993).
Data analysis: estimation of excitatory-inhibitory lags in single cells.
The temporal lag between excitatory and inhibitory inputs in a given cell cannot be known exactly because this would require holding the cell at two different membrane potentials simultaneously. This quantity can be estimated, however, from paired recordings of nearby cells that are likely to receive common excitatory and inputs. In particular, as shown by Okun and Lampl (2008), and as used in our analysis, the lag between excitation (E) and inhibition (I) in a target cell (T), Lag(IT, ET), can be estimated from:
| (6) |
where “R” denotes a reference cell recorded nearby, Lag(IT, ER) is the time of antipeak in the cross correlogram of IPSCs recorded in the target cell and EPSCs recorded in the reference cell, and Lag(ET, ER) is the time of peak in the cross correlogram of EPSCs recorded in the target cell and EPSCs recorded in the reference cell. Lag(IT, ET) > 0 when excitation follows inhibition and Lag(IT, ET) < 0 when inhibition follows excitation. For a given target cell, the mean Lag(IT, ET) (or E–I lag) was calculated from the difference between the mean Lag(IT, ER) and the mean Lag(ET, ER) (each quantity averaged from ∼10 Up states). For a given paired recording, we often switched the identities of the target or reference cell so that we could estimate the E–I lag of two cells per recording. This only required one additional recording configuration (i.e., recording IPSCs in what was originally the reference cell simultaneously with EPSCs in what was originally the target cell).
Data analysis: analysis of IPSCs during optogenetic stimulation of interneuron subtypes.
While glutamatergic transmission was blocked, we recorded IPSCs from pairs of pyramidal cells when ChR2-expressing PV cells or SOM cells were activated with 3-s-long ramp light stimuli. Ramp light stimuli of five different maximum intensities (18.5, 17.5, 12.5, 6.5, and 3 mW) were repeated five times each, with a 10-s interstimulus interval. Note (see Figs. 8 and 9) only results using 18.5- and 3 mW-maximum-intensity stimuli are shown. IPSCs were analyzed from 300 ms after the initiation of the light stimulus to the end of the light stimulus. Baseline measurements were taken from 1 s-long segments of current traces in the absence of light stimuli. Power spectra and cross correlograms calculated from each presentation of the ramp light stimulus at each intensity were averaged (5 presentations per intensity) for each cell or each pair of cells.
Statistics.
For statistical comparisons, distributions of data were first tested for normality with a Kolmogorov-Smirnov test. If data were normally distributed, standard parametric statistics were used: unpaired or paired t-tests for comparisons of two groups and one-way or repeated-measures ANOVA for comparisons of multiple groups. If data were not normally distributed, nonparametric statistics were used: Mann-Whitney or Wilcoxon's matched pairs test for comparisons of two groups and Kruskal-Wallis or Friedman's test for comparisons of multiple groups. Bonferroni correction was used for multiple comparisons. P < 0.05 was considered significant. All analyses of data were conducted in Mathematica 9 (Wolfram Research). Error bars and error shadings are SE, unless otherwise noted.
RESULTS
We probed the mechanisms of synchronized inhibition during spontaneously occurring Up states in slices of mouse barrel cortex in vitro. In our experimental conditions, Up states (∼1 s in duration) recurred approximately every 10 s (Fig. 1) (see also Neske et al. 2015). Up states in layer 5 neurons were characterized by robust spiking activity (Fig. 1A) and the presence of fast fluctuations in the LFP (Fig. 1B). With the exception of a few experiments (i.e., Figs. 8–10), we performed all recordings in layer 5 pyramidal cells and interneurons.
Fig. 10.
Up-state IPSC cross correlation in layer 4 is similar in Cx36-KO and WT. A: mean IPSC cross correlations (mean ± SE) in layer 4 excitatory cell pairs during Up states in WT (black) and Cx36-KO (red) animals. Left points in each data set are from individual cells, and right points are mean ± SE (WT: n = 20 pairs, KO: n = 16 pairs). Left: cross correlations for raw traces. Right: cross correlations for traces high-pass-filtered at 10 Hz. B: mean peak IPSC cross correlations during Up states in layer 4 excitatory cells (WT: n = 20 pairs, KO: n = 16 pairs). Left: data for raw traces (P = 0.025, t-test). Right: data for high-pass-filtered traces (P = 0.058, t-test). C: data from B grouped as WT-KO littermate pairs (n = 4 WT-KO littermate pairs).
During Up states, inhibitory synaptic inputs are more synchronized than excitatory synaptic inputs.
During Up states, barrages of excitatory and inhibitory synaptic inputs impinge on cortical neurons. Compared with EPSCs, IPSCs carry more power in the gamma frequency band (30–80 Hz) (Fig. 2B). We compared the synchronization of excitatory synaptic inputs and inhibitory synaptic inputs during Up states by analyzing the cross correlations of IPSCs or EPSCs in simultaneously recorded pairs of pyramidal cells (separated by 85 ± 7 μm, center-to-center distance) (Fig. 2). We found that, on a pair-by-pair basis, IPSCs were slightly but significantly more correlated than EPSCs, as measured by the peaks of the cross correlograms (Fig. 3C). It is possible that the peaks in the PSC cross correlograms are due primarily to slow cofluctuations within the cortical network during Up states. Since we were primarily interested in the synchronization of synaptic events on faster (tens of ms or less) time scales, we also analyzed the PSC cross correlograms of intracellular traces high-pass-filtered at 10 Hz (Fig. 3C, right). The cross correlation of IPSCs remained significantly higher than for EPSCs after high-pass filtering
During up states, spikes are more synchronized between pairs of interneurons than between pairs of pyramidal cells.
The higher correlation of IPSC barrages than EPSC barrages during Up states is consistent with the notion that inhibitory interneurons exhibit more synchronized action potential output than pyramidal cells. PSCs are postsynaptic measures, however. Measures of their correlation cannot distinguish between presynaptic spike synchrony among interneurons and shared synaptic inputs-IPSCs triggered by divergent interneuron axons that terminate on multiple pyramidal cells (Sippy and Yuste 2013). The most definitive way to demonstrate spike synchrony is obviously to record the spike trains of the presynaptic neurons of interest.
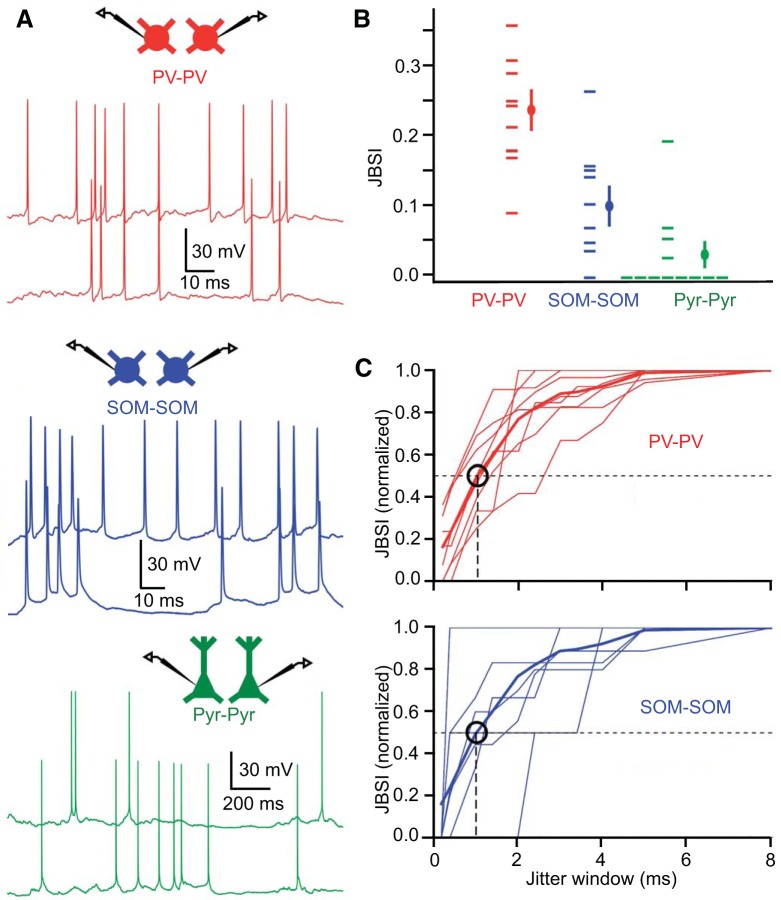
We recorded from homotypic pairs of two interneuron subtypes, PV and SOM cells, in addition to pairs of pyramidal cells during Up states and analyzed the resulting spike trains (center-to-center distances of cells in a pair: Pyr-Pyr:102 ± 11 μm, n = 12 pairs; PV-PV: 87 ± 11 μm, n = 9 pairs; SOM-SOM: 66 ± 10 μm, n = 9 pairs; P = 0.24, ANOVA, Bonferroni correction) (Fig. 4A). We used the JBSI (Agmon 2012) to detect spike synchrony and to quantify its strength and precision. The JBSI is an ideal measure of spike synchrony because it is independent of mean firing rates of the recorded spike trains, firing rate differentials, and comodulations of firing rate.
Fig. 4.
Tight spike synchrony of interneuron pairs, but not pyramidal cell pairs, during Up states. A: simultaneous recording of homotypic interneuron pairs and pyramidal cell pairs during Up states. Representative traces show tight (∼1 ms) spike synchrony in interneuron pairs; especially PV cells, but not in pyramidal cell pairs. B: quantification of strength of spike synchrony by the jitter-based synchrony index (JBSI). Left points are from individual cell pairs, right (larger) points are mean ± SE. JBSIPV-PV > JBSIPyr-Pyr (P = 8.11 × 10⁻⁶, Kruskal-Wallis test, Bonferroni correction), JBSIPV-PV > JBSISOM-SOM (P = 0.0047, Kruskal-Wallis test, Bonferroni correction). C: estimation of spike synchrony precision by systematically decreasing size of jitter window. Precision of synchrony is defined as size of jitter window when JBSI decreases to half its maximal amount, indicated by circle (∼1 ms for PV-PV and SOM-SOM pairs). Thin lines are from individual cell pairs, and thick line is the mean.
We found that spike synchrony during Up states, as quantified by the JBSI, was significantly larger in homotypic pairs of interneurons (especially PV cells) than in pairs of pyramidal cells (Fig. 4B). Only 1 out of 12 pairs of pyramidal cells exhibited spike synchrony at P < 0.01, whereas 8 out of 9 PV cell pairs and 5 out of 9 SOM cell pairs exhibited spike synchrony at this significance level. The majority (8 out of 12) of pyramidal cell pairs had a JBSI of 0.
By incrementally decreasing the size of the jitter window used to calculate the JBSI (see materials and methods), the temporal precision of spike synchrony can be estimated. Intuitively, as one decreases the extent to which spikes in one train in a pair are jittered, eventually there will be no functional difference between the synchrony of the pair of spike trains when one train is jittered vs. the synchrony of the raw pair of spike trains. When the amount of jitter is lowered below that which differentiates the synchrony in the pair of raw spike trains from the synchrony in the pair of spike trains that has undergone jittering, the temporal precision of the synchrony has been reached. For homotypic interneuron pairs with statistically significant spike synchrony, we considered the value of the jitter window at which the JBSI decreased to half its maximum value to be the precision of the synchrony. Both PV cell pairs and SOM cell pairs reached this value when the jitter window was decreased to ∼1 ms, on average (Fig. 4C). Thus, during Up states, inhibitory interneurons, especially PV cells, exhibit tight spike synchrony.
The absence of electrical synapses between interneurons does not significantly alter synchronized inhibition during up states.
Having established that inhibitory interneurons spike more synchronously than pyramidal cells, we then considered what circuit mechanisms give rise to this synchrony. We first considered the possibility that electrical synapses may play a role. Electrical synapses between neurons in the mammalian brain rely primarily on the gap junction protein Cx36 (Belluardo et al. 2000; Condorelli et al, 2000). Thus, in Cx36-KO animals, electrical synapses between cortical interneurons are almost completely abolished (Deans et al. 2001; Hormuzdi et al. 2001). To test whether electrical synapses between interneurons play a role in synchronizing inhibitory activity during Up states, we compared various temporal properties of IPSC barrages in pyramidal neurons between Cx36-KO and WT animals.
We first compared the gamma-band (30–80 Hz) power of IPSCs in layer 5 pyramidal cells during Up states (Fig. 5). Gamma-band power of Up state IPSCs was not significantly different between genotypes, either in pooled data from all animals used (Fig. 5B), or in WT-Cx36-KO littermate pairs (Fig. 5C). Considering the visually suggestive difference between WT and KO IPSC power from 30 Hz to even higher frequencies (up to ∼125 Hz) (Fig. 5A), we also tested whether genotypes differed in power between 30 and 125 Hz. In this range too, however, IPSC power was not significantly different between genotypes (WT: 591.0 ± 31.8 pA2/Hz, KO: 529.9 ± 36.4 pA2/Hz, P = 0.12, t-test).
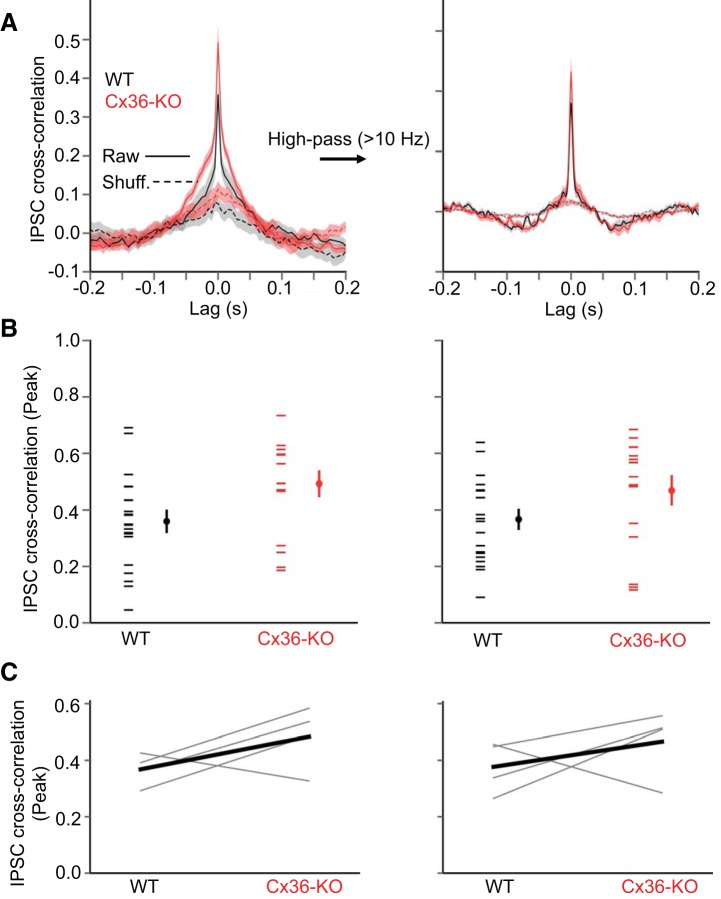
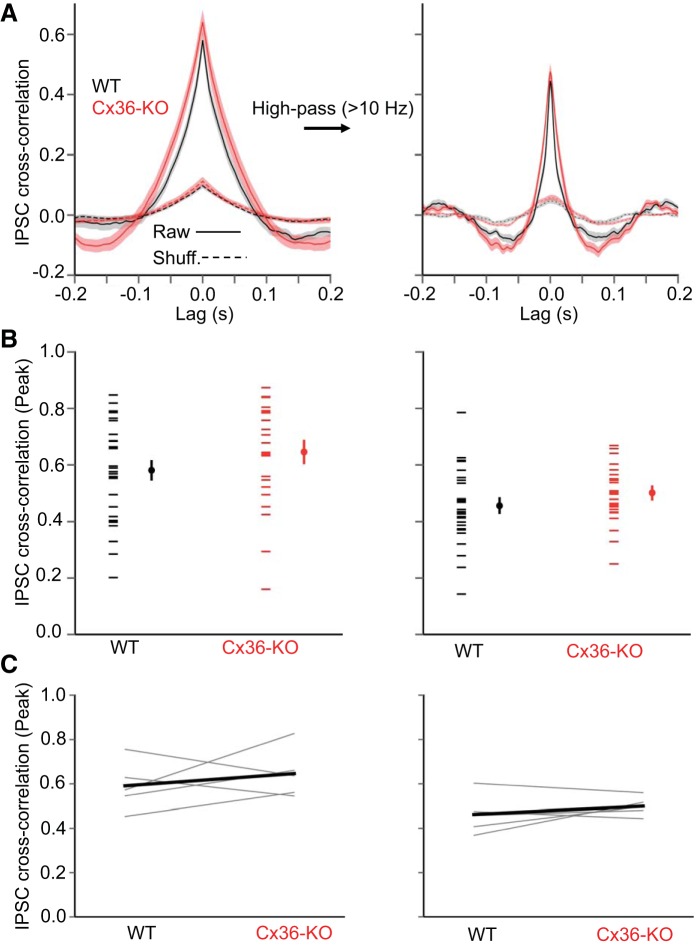
We then considered whether the synchronization of IPSCs in pairs of pyramidal cells during Up states is diminished in the Cx36-KO. We recorded IPSCs in pyramidal cell pairs ∼200 μm apart (WT: 183 ± 11 μm, KO: 196 ± 13 μm, P = 0.43, t-test). There was no significant difference in the peak IPSC cross correlation between WT and Cx36-KO animals, either for raw intracellular traces or traces high-pass-filtered at 10 Hz (Fig. 6), although the cross correlogram was slightly, but significantly, wider in the KO (width at half-height: WT: 11.5 ± 0.7 ms, KO: 14.8 ± 1.1 ms, P = 0.014, t-test). Thus the absence of Cx36 does not seem to impair the synchronization of inhibitory inputs during Up states.
Fig. 6.
Cross correlations of Up-state IPSCs in layer 5 are similar in Cx36-KO and WT animals. A: IPSC cross correlations (mean ± SE) in layer 5 pyramidal cell pairs during Up states in WT (black) and Cx36-KO (red) animals (WT: n = 28 pairs, KO: n = 23 pairs). Left: cross correlations for raw traces. Right: cross correlations for traces high-pass-filtered at 10 Hz. B: mean peak IPSC cross correlations during Up states in layer 5 pyramidal cells. Left points in each data set are from individual cell pairs, and right points are mean ± SE (WT: n = 28 pairs, KO: n = 23 pairs). Left: data for raw traces (P = 0.20, t-test). Right: data for high-pass-filtered traces (P = 0.19, t-test). C: data from B grouped as WT-KO littermate pairs (n = 5 WT-KO littermate pairs). Left: data for raw traces. Right: data for high-pass-filtered traces.
As an additional measure of synchronized inhibition, we considered the modulation of IPSC occurrence by the phase of the gamma-band oscillatory activity in the LFP. This measurement conveys the extent to which individually detected inhibitory inputs are phase locked with the synchronized oscillatory activity in the wider network. To quantify the modulation of IPSC occurrence by LFP phase, we counted IPSCs in phase bins of the Hilbert-transformed, band-pass-filtered LFP to generate IPSC probability histograms for LFP phases (Fig. 7). LFP electrodes were within ∼200 μm of the recorded pyramidal cell (WT: 187 ± 10 μm, KO: 200 ± 11 μm, P = 0.34, t-test). IPSC probability decreased near the 0 phase of the LFP (corresponding to the trough) and peaked at ± π/2 (Fig. 8A). IPSCs in all recorded cells were significantly phase modulated by the LFP (P < 0.01 for all cells, Rayleigh's Z test). The mean IPSC-LFP probability histograms from WT animals generally overlapped with those from Cx36-KO animals (Fig. 8A). Using circular statistics to compare IPSC-LFP histograms between WT and Cx36-KO animals (see materials and methods), there was no significant difference between genotypes either in vector magnitude (WT: r = 0.50 ± 0.015, KO: 0.49 ± 0.013, P = 0.44, Mann-Whitney test) or phase angle (WT: θ = −0.055 ± 0.052, KO: θ = −0.003 ± 0.046, P = 0.91, Mann-Whitney test) (Fig. 8B). Thus absence of Cx36 did not affect the phase locking of inhibitory inputs with the fast oscillations of the local network.
Fig. 7.
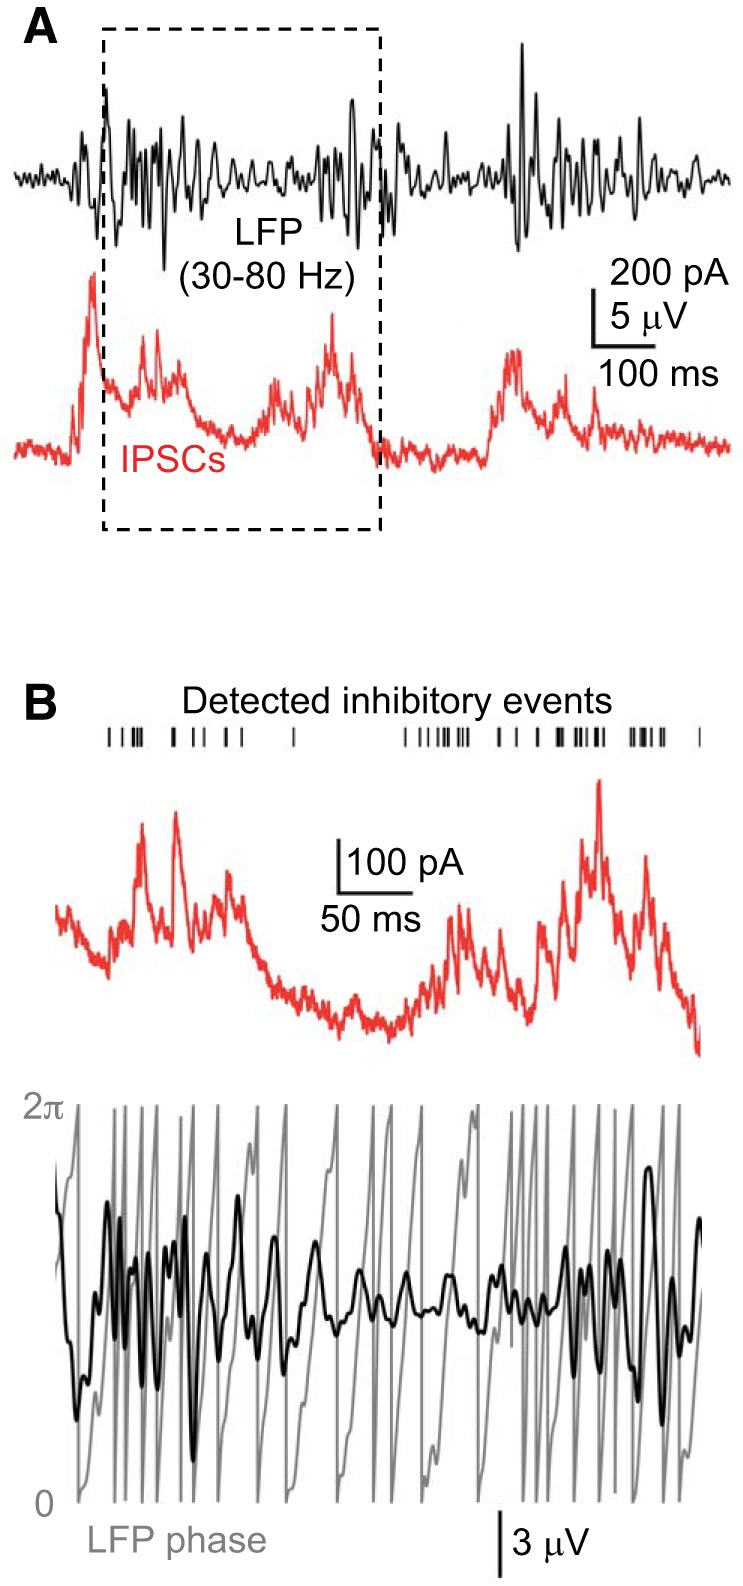
Method for constructing IPSC-LFP probability histograms. A: example of simultaneously recorded LFP (black) (band-pass-filtered 30–80 Hz) and IPSC barrages (red) in a layer 5 pyramidal cell during Up states. B: boxed region in A is expanded. Detected inhibitory events are indicated by black ticks above current trace. Simultaneously recorded, band-pass-filtered LFP is shown below, along with its associated phase (gray), calculated from the Hilbert transform. In Figs. 7 and 10, phases from 0 to π (the positive-going LFP) remain as such, while phases from 2π to π (the negative-going LFP) are mapped to the interval 0 to −π. Thus, the trough of the LFP occurs at zero phase, which is separated by peaks at −π and π. Detected inhibitory events are counted in phase bins of length π/16 in the interval from −π to π.
We wondered whether electrical synapses might play a more prominent role in synchronizing inhibitory activity in layer 4 of barrel cortex, where the density of PV cells is higher than in the infragranular layers (Lee et al. 2010). A higher density of PV cells might increase the opportunity for electrical coupling between these cells (Amitai et al. 2002). Thus we also studied the temporal properties of IPSCs during Up states in the barrels of layer 4, where we recorded from regular-spiking, putative excitatory spiny stellate cells (Beierlein et al. 2003). In this layer as well, however, the absence of Cx36 did not impair the gamma-band power (Fig. 9), synchronization of IPSCs (Fig. 10), or IPSC-LFP phase locking (Fig. 11) during Up states. The peak cross correlation of IPSCs between excitatory cells in layer 4 was actually significantly larger in Cx36-KO compared with WT animals, although the difference was not significant when considering only high-pass-filtered traces (Fig. 10). The characteristics of IPSC power spectra and cross correlograms from layer 4 excitatory cells were visibly different from those of layer 5 pyramidal cells; IPSC power spectra showed proportionally more power at higher frequencies and IPSC cross correlograms exhibited a narrower peak in layer 4 excitatory cells. These differences may be due the electrotonic structure of pyramidal cells in layer 5 vs. spiny stellate cells in layer 4; spiny stellate cells are likely more electrotonically compact, resulting in less passive decay of IPSCs.
Fig. 11.
Up-state IPSCs in layer 4 are similarly modulated by LFP in Cx36-KO and WT animals. A: probability (mean ± SE) of IPSC occurrence is distributed similarly across phases of the gamma-bandpass-filtered LFP in WT (black) and Cx36-KO (red) animals (WT: n = 14 cells, KO: n = 18 cells). The trough of the LFP is at zero phase. B: quantification of phase modulation of IPSC occurrence by LFP by vector magnitude and phase angle. Each cell is represented by a vector whose magnitude relates to the strength of the phase modulation and whose angle relates to the preferred phase at which the modulation occurs. Dotted line is the unit vector {1,0}. Comparison of vector magnitude, r: WT: r = 0.51 ± 0.0042, KO: r = 0.51 ± 0.0085, P = 0.52, t-test. Comparison of phase angle, θ: WT: θ = 0.09 ± 0.021, KO: θ = 0.11 ± 0.029, P = 0.19, t-test.
We conclude that the absence of electrical synapses between cortical interneurons does not substantially affect the ability of these cells to synchronize their spiking output during Up states.
Inhibitory synaptic inputs follow excitatory synaptic inputs during Up states.
There are three general classes of proposed circuit mechanisms for precise spike synchronization among interneurons: those that depend primarily on excitatory-inhibitory interactions, on inhibitory interactions among interneurons, or on electrical synapses between interneurons. In previous studies, the importance of each mechanism has varied with the experimental preparation; we were specifically interested in the mechanisms at work during Up states. We suggested above that electrical synapses do not a play an important role in synchronized inhibition during Up states. We therefore wanted to test the extent to which excitatory-inhibitory (E–I) interactions vs. inhibitory interactions among interneurons (I–I interactions) play a role in synchronizing interneurons.
In the E–I mechanism, interneurons are driven to spike due to an initial excitatory volley. Feedback inhibition then decreases the excitability of excitatory cells, reducing the excitatory drive to interneurons. Reduced excitatory drive to interneurons then increases the excitability of the excitatory cells, intuitively leading to oscillatory behavior in the network. In contrast, in the I–I mechanism, the primary role for excitatory inputs is to tonically depolarize the population of interneurons so that spike synchrony can emerge through inhibitory interactions. These two scenarios are the essence of the well-known pyramidal-interneuron gamma (PING) and interneuron gamma (ING) models of rhythmogenesis (Whittington et al. 2000; Tiesinga and Sejnowski 2009).
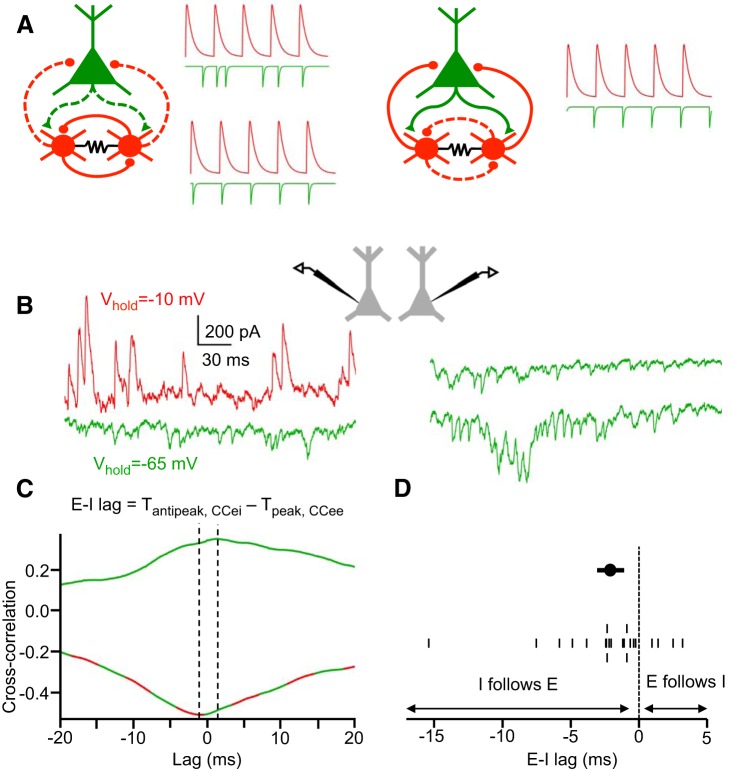
The E–I and I–I mechanisms of interneuron spike synchronization make different predictions about the predominant temporal relation between excitatory and inhibitory events. If excitatory inputs serve only to depolarize fast-spiking (FS) cells so that they can synchronize via the I–I mechanism, the following predictions about the overall arrival times of excitatory and inhibitory synaptic events can be made: 1) If FS cell spiking is not effective in controlling the spike timing of pyramidal cells, differences in the arrival times of excitatory and inhibitory volleys in excitatory cells should be relatively uniformly distributed among positive and negative values. 2) If FS cell spiking is effective in controlling the spike timing of excitatory cells, inhibitory volleys should occur before or synchronously with excitatory volleys because a tonically depolarized FS cell population would likely recover from inhibition more rapidly due to the faster membrane time constants of FS cells (Fig. 12A). Conversely, if FS cells are not tonically depolarized, but instead rely on excitatory inputs on each oscillation cycle for their activation, excitatory inputs should, on average, arrive before inhibitory inputs (Fig. 12A).
Fig. 12.
IPSCs follow EPSCs with a short delay during Up states. A: schematic illustration of the predictions of the temporal relations between excitatory and inhibitory synaptic inputs under E-I or I-I synchronization mechanisms. Left: if the I-I synchronization mechanism predominates, there should either be no phase preference for EPSCs relative to IPSCs (top trace) or IPSCs should occur synchronously with or shortly before EPSCs (bottom trace). Right: if the E-I synchronization mechanism predominates, EPSCs should occur shortly before IPSCs. B: recording configurations for estimating excitatory-inhibitory lags in a single pyramidal cell. One reference cell is constantly held at a hyperpolarized potential, isolating EPSCs, while a nearby cell is held at either a depolarized potential to isolate IPSCs or a hyperpolarized potential to isolate EPSCs. C: excitatory-inhibitory lag in a single cell is estimated by the difference between the antipeak time of the IPSC-EPSC cross correlogram and the peak time of the EPSC-EPSC cross correlogram. D: mean E-I lags in pyramidal cells during Up states (mean E-I lags from individual cells on bottom, population mean E-I lag on top, ± SE) (n = 22 cells).
To determine the temporal lags between excitatory and inhibitory inputs in pyramidal cells during Up states, we used the method of Okun and Lampl (2008), in which excitatory-inhibitory lags are estimated from paired recordings with cells in the pair held at different combinations of membrane potentials (Fig. 12, B and C). We found in the majority of pyramidal cells that IPSCs generally followed EPSCs with a lag of <10 ms (mean E–I lag: −2.1 ± 0.8 ms) (Fig. 12, C and D). The time of the peak of the E-E cross correlograms, used in the calculation of E–I lag, was generally 0 ms (for 7 out of 11 pyramidal cell pairs). Furthermore, the time of the anti-peak of the E–I cross correlogram was a better predictor of the value of E–I lag (R2 = 0.72) than the time of the peak of the E–E cross correlogram (R2 = 0.32) (P = 5.6 × 10⁻¹⁸, Fisher's z transformation). Thus variance in estimated E–I lag is predominately related to variance in anti-peak time of E–I cross correlograms.
The dominant temporal motif during Up states, excitation followed rapidly by inhibition, is most consistent with the E–I mechanism of interneuron synchronization. Thus we propose that interneurons spike synchronously due to shared excitatory volleys that initiate the cycles of fast synaptic activity during Up states.
Tonic optogenetic activation of interneurons is ineffective in eliciting robust synchronized inhibition.
Several recent studies have demonstrated that nonperiodic photostimulation of ChR2-expressing pyramidal cells can generate highly rhythmic and coherent gamma oscillations (Adesnik and Scanziani 2010; Shao et al. 2013; Takada et al. 2014; Crandall et al. 2015). In principle, exciting pyramidal cells with ramping stimuli could generate gamma-synchronized inhibition via the I–I or the E–I mechanism; activated pyramidal cells could provide interneurons with a level of tonic depolarizing drive for emergent synchronization via the I–I mechanism, or excitatory inputs could play the key role in synchronizing interneurons on each oscillation cycle.
To address whether tonic depolarization of interneurons could elicit gamma-synchronized inhibition, we introduced ChR2 into PV cells using stereotaxic viral injections of Cre-dependent ChR2 constructs into barrel cortex of PV-Cre mice (Fig. 13A). We opted to use viral methods because crossing PV-Cre animals with ChR2-reporter animals yielded ChR2 expression that was too weak to drive PV cells to spike threshold, even with the highest-intensity photostimulus. This is possibly due to the relative weakness of the PV promoter in cortex and its developmental regulation during the second postnatal week (Solbach and Celio 1991; Soriano et al. 1992; Zhao et al. 2011). Viral transduction allowed for higher levels of ChR2 expression in PV cells compared with reporter animals presumably due to a higher genetic copy number through viral transduction.
In ChR2-expressing slices maintained in “normal ACSF” (i.e., 2 mM Ca2+/Mg2+, 3 mM K+) with blockers of glutamatergic transmission (50 μM APV and 20 μM DNQX), we recorded IPSCs evoked by ramp light stimulation in pairs of layer 5 pyramidal neurons (center-to-center distance: 138 ± 15 μm) (Fig. 13B). These IPSCs most likely reflect the light-evoked spiking activity of presynaptic PV cells in the local network. In many cases, transient periods of very high-frequency (>100 Hz) IPSCs would dominate the barrages, as evidenced by the IPSC power spectrum and the normalized power ratio [i.e., the ratio of the IPSC power spectrum to the power spectrum of the intracellular record in baseline (dark) conditions, normalized so that the peak ratio for a given pyramidal cell is 1; Fig. 13C]. IPSCs were not generally synchronous between pyramidal cells. In fact, transient bouts of particularly rhythmic, very high-frequency (>100 Hz) IPSCs were often recorded in one pyramidal cell but not in the simultaneously recorded pyramidal cell (see Fig. 13B, insets). The cross correlograms of IPSCs in pyramidal cell pairs were markedly flat (Fig. 13D). Thus tonic depolarizing drive to PV cells (via non-periodic photostimulation of ChR2) generates far less synchronized inhibition than during Up states (e.g., Fig. 3) or during similar photostimulation of pyramidal cells (Adesnik and Scanziani 2010; Shao et al. 2013; Takada et al. 2014; Crandall et al. 2015).
We applied the same optogenetic manipulation to SOM cells. ChR2 was selectively introduced into these cells by crossing SOM-Cre mice with ChR2-reporter mice (Fig. 14A). Ramp light stimuli given to ChR2-expressing SOM cells resulted in a moderate degree of synchronization between IPSCs recorded in pairs of layer 5 pyramidal cells (center-to-center distance: 149 ± 17 μm). IPSC power was highest around 20 Hz (Fig. 14C). In contrast to cross correlograms of IPSCs during optical stimulation of PV cells, cross correlograms of IPSCs during optical stimulation of SOM cells exhibited a much sharper peak at zero lag, as well as side-bands with lags of ∼50 ms (consistent with a synchronized oscillation at ∼20 Hz) (Fig. 14D).
We conclude that nonperiodic optogenetic stimulation of PV cells does not lead to synchronized inhibition in the gamma band. Thus tonic depolarization of PV cells appears poorly suited to synchronize their spiking activity. While still relatively weak, synchronization of IPSCs between pyramidal cells was more pronounced when SOM cells were activated with ramp light stimuli. These stimuli seemed to evoke oscillatory inhibition primarily at ∼20 Hz, traditionally considered to be within the beta frequency band.
DISCUSSION
Several circuit mechanisms can potentially synchronize the spiking output of inhibitory interneurons, but their relative importance in the active cortex is unclear. We examined spontaneous Up states in barrel cortex in vitro. Inhibitory synaptic inputs were more synchronized than excitatory synaptic inputs in neighboring pyramidal neurons, and pairs of homotypic interneurons, especially FS cells, exhibited tight (∼1 ms) spike synchrony. The absence of electrical synapses between interneurons did not significantly impair synchronized inhibition during Up states. Inhibitory synaptic inputs in pyramidal cells generally followed excitatory synaptic inputs during Up states, and nonperiodic photostimulation of FS cells elicited only low-amplitude, very high-frequency, largely uncorrelated inhibition in pyramidal cells. These results imply that synchronized FS cell spiking is likely driven by phasic excitatory drive and not by a generalized depolarization that allows FS cells to synchronize via their mutual inhibitory interactions.
Our results complement a recent study that investigated the mechanisms of synchronized inhibition during Up states in entorhinal cortex in vitro (Salkoff et al. 2015). Salkoff et al. (2015) demonstrated that FS cells exhibit tight spike synchrony, unlike pyramidal cells, and their experiments also support the E–I mechanism of interneuron synchrony. Specifically, the authors showed that FS cells are primarily driven to spike by an increase in excitation rather than a decrease in inhibition. In the I–I mechanism, tight spike synchrony emerges because the long decay time constant of the inhibitory conductance relative to the oscillation cycle creates a small window of opportunity for a given interneuron to spike (Wang and Rinzel 1992). Interneuron spiking should therefore be preceded primarily by a decrease in inhibition. In the E–I mechanism, in contrast, interneuron spiking should primarily be preceded by an increase in excitation. Salkoff et al. (2015) showed that a sharp increase in excitation in FS cells was the predominant trigger of their spiking. They also showed that Up-state EPSCs in FS cell pairs are highly correlated and EPSC correlation strength is highly predictive of FS cell spike synchrony, consistent with shared excitatory inputs being the predominant driver of FS cell spike synchrony.
A purely I–I mechanism for the generation of gamma-synchronized inhibition has been demonstrated in hippocampal and neocortical slices activated by pressure ejection of mGluR agonists (Whittington et al. 1995) or bath application of kainate (Fisahn et al. 2004) while fast glutamatergic transmission was blocked. However, other activating conditions, such as bath application of carbachol (Fisahn et al. 1998), require phasic glutamatergic drive. Furthermore, the temporal motif of excitation followed quickly by inhibition has been widely observed during spontaneous gamma oscillations in vivo (Csicsvari et al. 2003; Hájos et al. 2004; Hasenstaub et al. 2005; Mann et al. 2005; Atallah et al. 2009). In one study, the dispensability of I–I connections for FS cell spike synchrony was suggested by the survival of gamma oscillations following genetic ablation of functional GABA receptors in FS cells (Wulff et al. 2009). Could synchronized inhibition emerge via the I–I mechanism in a network in which local synaptic excitation is intact? Such a scenario could occur if interneurons are sufficiently excited such that they recover from inhibition before excitatory cells. Yet, in the recurrent cortical network, increased excitation of interneurons cannot occur without a concomitant increase in pyramidal cell excitation. Increased excitation of interneurons without consequent excitation of pyramidal cells likely requires an external excitatory drive that is selective or biased toward interneurons. Such an interneuron-selective excitatory input has been proposed as a top-down signal for attentional gain modulation (Tiesinga et al. 2004). Consistent with top-down, interneuron-selective excitatory drive, a recent study showed that during the prestimulus cue period of an attention task, putative FS cells in macaque V4 exhibited enhanced phase locking to the gamma-band LFP without changes in the phase locking of putative excitatory cells (Vinck et al. 2013). An independent increase in gamma-band synchrony in interneurons could be due to an excitatory top-down signal that allows the interneuron population to synchronize its spiking via the I-I mechanism. In essence, local-circuit activity might establish synchronized inhibition via the E-I mechanism, whereas exogenous drive might impel the I–I mechanism. Whether these two mechanisms compete to generate synchronized inhibition or reinforce each other remains to be determined.
We showed that, unlike the powerful ability of nonperiodic photostimulation of pyramidal cells to generate highly rhythmic and coherent gamma-synchronized inhibition (Adesnik and Scanziani 2010; Shao et al. 2013; Takada et al. 2014; Crandall et al. 2015), similar stimulation of PV cells led mostly to unsynchronized, very fast (>100 Hz) barrages of IPSCs in pyramidal cell pairs. Our observation might appear to counter the demonstration that photostimulation of PV cells is sufficient to generate gamma oscillations (Cardin et al. 2009). Those results do not endorse the I–I mechanism over the E–I mechanism, however. Rather, Cardin et al. (2009) showed that only stimulation of PV cells and not pyramidal cells was effective in synchronizing the spiking output of pyramidal cells at gamma frequencies. An E–I mechanism of interneuron synchronization is still compatible with the notion that inhibition is more effective than excitation at synchronizing the spiking output of pyramidal cells. Thus, our results are fully compatible with those in Cardin et al. (2009).
Interestingly, while nonperiodic optogenetic activation of PV cells was insufficient to generate gamma-band oscillatory synchrony, the same experimental modulation of SOM cells appeared to give rise to a weakly synchronous network oscillation at ∼20 Hz. This result is consistent with previous work demonstrating synchronized low-frequency (∼5–20 Hz) network oscillations upon pharmacological activation of SOM cells (Beierlein et al. 2000; Deans et al. 2001; Long et al. 2005). Thus the electrically coupled SOM cell network may be especially susceptible to synchronous, electrical-synapse-mediated network activity during conditions in which this interneuron subtype is activated. Furthermore, the tight spike synchrony we observed in SOM cells during Up states could result from electrical coupling; SOM cells very rarely form homotypic inhibitory synapses (Gibson et al. 1999; Beierlein et al. 2003) and EPSP amplitudes in SOM cells are small at low (<20 Hz) activation frequencies of presynaptic pyramidal cells (Beierlein et al. 2003), meaning that reciprocal inhibition or shared excitation is less likely to contribute to tight spike synchrony in SOM cells.
We examined the possibility that electrical synapses between interneurons contribute to synchronized inhibition in pyramidal cells. Electrical synapses allow fast, bidirectional flow of ionic current among interneurons, suggesting that membrane potential fluctuations would tend to be normalized within a network, leading to synchronous spiking behavior (Bennett and Zukin 2004; Connors and Long 2004). Indeed, electrical synapses can powerfully synchronize spiking in pairs of interneurons injected with depolarizing current (Galarreta and Hestrin 1999; Gibson et al. 1999, 2005; Mancilla et al. 2007; Hu and Agmon 2015) or during pharmacological activation of SOM cells (Beierlein et al. 2000; Deans et al. 2001), whose only significant mode of homotypic intercellular communication is via electrical synapses (Gibson et al. 1999; Beierlein et al. 2003). Furthermore, electrical synapses can give rise to synchronous firing in interneuron pairs in activation regimes in which reciprocal inhibitory synaptic connections would otherwise have promoted antisynchrony (Gibson et al. 2005). During conditions in which both I–I and E–I mechanisms have the potential to contribute, it is unclear to what extent electrical synapses might reinforce synchrony already established by these mechanisms. This question is especially relevant to synchronized inhibition in the gamma band, since PV cells are integrated into all three circuit motifs (E–I, I–I, and electrical).
To study the contribution of electrical synapses to synchronized inhibition during cortical Up states, we compared Cx36-KO and WT animals. A caveat of the use of Cx36-KO animals is that, from the onset of embryonic development, Cx36 is abolished in all cells (neuronal and nonneuronal) in which it would normally be expressed. This situation could permit indirect effects on neuronal systems due to systemic absence of the gene and could also lead to compensatory changes. While compensatory changes in the Cx36-KO related to the maintenance of gamma-frequency inhibition cannot be ruled out, the original characterization of the strength, probability, and dynamics of cortical inhibitory synapses in Cx36-KO animals did not reveal significant differences from WT animals (Deans et al. 2001) [although, see Butovas et al. (2006) and Postma et al. (2011)].
There are at least two previous studies that have investigated, through comparisons of Cx36-KO and WT animals, the role of electrical synapses in gamma-band synchronization. Hormuzdi et al. (2001) showed that during both kainate- and carbachol-induced persistent gamma oscillations in hippocampal slices, gamma-band LFP power and rhythmicity of IPSPs were significantly reduced in Cx36-KO animals. Buhl et al. (2003) reported reduced gamma-LFP power and decreased coupling of gamma power to theta phase in the hippocampus of Cx36-KO animals during active behavior. During REM sleep, however, these measurements were not significantly different between genotypes.
What could account for the discrepancies between our result (absence of Cx36 does not impair synchronized inhibition during cortical Up states) and the results of earlier work in hippocampus? One possibility is the differential nature of interneuron activation. During Up states, interneurons are depolarized primarily via recurrent excitatory activity in the local cortical circuit. During bath application of kainate in hippocampal slices, interneurons are depolarized by the tonic, exogenous drive of the agonist; blocking fast glutamatergic synapses does not significantly affect kainate-induced oscillations (Fisahn et al. 2004). While Hormuzdi et al. (2001) also studied carbachol-induced oscillations, which depend on phasic glutamatergic signaling (Fisahn et al. 1998), interneurons of various subtypes, including FS PV cells to some extent, could be tonically activated by such cholinergic drive (McQuiston 2014). Bath-applied drugs can provide a source of activation to interneurons that is independent of activation by local excitatory cells. This situation could increase the probability of interneuron synchronization via the I–I mechanism. A well-documented theoretical result is that synchronization in purely inhibitory networks is impaired by heterogeneities in driving inputs or intrinsic cellular properties (Wang and Buzsáki 1996; Traub et al. 1996; White et al. 1998). Electrical synapses in simulated inhibitory networks can mitigate the deleterious effect of heterogeneities on spike synchrony (Traub et al. 2001; Kopell and Ermentrout 2004). Thus cases in which I–I interactions potentially facilitate the synchronization of interneurons (perhaps during exogenous drive of these cells) might rely on electrical synapses to a greater extent. If top-down attentional signals indeed shift the mechanism of interneuron spike synchrony to one based on I–I interactions, one prediction is that the increases in local gamma-band power and spike-field coherence associated with attention could depend on electrical synapses.
GRANTS
This study was supported by National Institute of Neurological Disorders and Stroke Grant R01-NS-050434, DARPA-BAA-09-27, and the Robin Chemers Neustein Graduate Fellowship from the Brown Institute for Brain Science.
DISCLOSURES
No conflicts of interest, financial or otherwise, are declared by the author(s).
AUTHOR CONTRIBUTIONS
G.T.N. and B.W.C. conception and design of research; G.T.N. performed experiments; G.T.N. analyzed data; G.T.N. interpreted results of experiments; G.T.N. prepared figures; G.T.N. drafted manuscript; G.T.N. and B.W.C. edited and revised manuscript; G.T.N. and B.W.C. approved final version of manuscript.
ACKNOWLEDGMENTS
We thank Saundra Patrick for histological preparation of fluorescent tissue and Bridget Sullivan and Betty Peng for assistance with genotyping. We also thank Scott Cruikshank, Shane Crandall, Arthur Sugden, and Chris Deister for insightful comments and discussion.
Current address for G. T. Neske: Department of Neurobiology, Yale University, New Haven, CT 06510.
REFERENCES
- Adesnik H, Scanziani M. Lateral competition for cortical space by layer-specific horizontal circuits. Nature 464: 1155–1160, 2010. [DOI] [PMC free article] [PubMed] [Google Scholar]
- Agmon A. A novel, jitter-based method for detecting and measuring spike synchrony and quantifying temporal firing precision. Neural Syst Circuits 2: 5, 2012. [DOI] [PMC free article] [PubMed] [Google Scholar]
- Agmon A, Connors BW. Thalamocortical responses of mouse somatosensory (barrel) cortex in vitro. Neuroscience 41: 365–379, 1991. [DOI] [PubMed] [Google Scholar]
- Amarasingham A, Harrison MT, Hatsopoulos NG, Geman S. Conditional modeling and the jitter method of spike resampling. J Neurophysiol 107: 517–531, 2012. [DOI] [PMC free article] [PubMed] [Google Scholar]
- Amitai Y, Gibson JR, Beierlein M, Patrick SL, Ho AM, Connors BW, Golomb D. The spatial dimensions of electrically coupled networks of interneurons in the neocortex. J Neurosci 22: 4142–4152, 2002. [DOI] [PMC free article] [PubMed] [Google Scholar]
- Atallah BV, Scanziani M. Instantaneous modulation of gamma oscillation frequency by balancing excitation with inhibition. Neuron 62: 566–577, 2009. [DOI] [PMC free article] [PubMed] [Google Scholar]
- Beierlein M, Gibson Connors BW JR. A network of electrically coupled interneurons drives synchronized inhibition in neocortex. Nat Neurosci 3: 904–910, 2000. [DOI] [PubMed] [Google Scholar]
- Beierlein M, Gibson JR, Connors BW. Two dynamically distinct inhibitory networks in layer 4 of the neocortex. J Neurophysiol 90: 2987–3000, 2003. [DOI] [PubMed] [Google Scholar]
- Belluardo N, Mudò G, Trovato-Salinaro A, Le Gurun S, Charollais A, Serre-Beinier V, Amato G, Haefliger JA, Meda P, Condorelli DF. Expression of connexin36 in the adult and developing rat brain. Brain Res 865: 121–138, 2000. [DOI] [PubMed] [Google Scholar]
- Bennett MV, Zukin RS. Electrical coupling and neuronal synchronization in the mammalian brain. Neuron 41: 495–511, 2004. [DOI] [PubMed] [Google Scholar]
- Börgers C, Kopell N. Synchronization in networks of excitatory and inhibitory neurons with sparse, random connectivity. Neural Comput 15: 509–538, 2003. [DOI] [PubMed] [Google Scholar]
- Buhl DL, Harris KD, Hormuzdi SG, Monyer H, Buzsáki G. Selective impairment of hippocampal gamma oscillations in connexin-36 knock-out in vivo. J Neurosci 23: 1013–1018, 2003. [DOI] [PMC free article] [PubMed] [Google Scholar]
- Butovas S, Hormuzdi SG, Monyer H, Schwarz C. Effects of electrically coupled inhibitory networks on local neuronal responses to intracortical microstimulation. J Neurophysiol 96: 1227–1236, 2006. [DOI] [PubMed] [Google Scholar]
- Buzsáki G. Rhythms of the Brain. New York: Oxford Univ. Press, 2006. [Google Scholar]
- Buzsáki G, Draguhn A. Neuronal oscillations in cortical networks. Science 304: 1926–1929, 2004. [DOI] [PubMed] [Google Scholar]
- Buzsáki G, Watson BO. Brain rhythms and neural syntax: implications for efficient coding of cognitive content and neuropsychiatric disease. Dialogues Clin Neurosci 14: 345–367, 2012. [DOI] [PMC free article] [PubMed] [Google Scholar]
- Cardin JA, Carlén M, Meletis K, Knoblich U, Zhang F, Deisseroth K, Tsai LH, Moore CI. Driving fast-spiking cells induces gamma rhythm and controls sensory responses. Nature 459: 663–667, 2009. [DOI] [PMC free article] [PubMed] [Google Scholar]
- Cobb S, Buhl E, Halasy K, Paulsen O, Somogyi P. Synchronization of neuronal activity in hippocampus by individual GABAergic interneurons. Nature 378: 75–78, 1995. [DOI] [PubMed] [Google Scholar]
- Compte A, Reig R, Descalzo VF, Harvey MA, Puccini GD, Sanchez-Vives MV. Spontaneous high-frequency (10–80 Hz) oscillations during up states in the cerebral cortex in vitro. J Neurosci 28: 13828–13844, 2008. [DOI] [PMC free article] [PubMed] [Google Scholar]
- Condorelli DF, Belluardo N, Trovato-Salinaro A, Mudò G. Expression of Cx36 in mammalian neurons. Brain Res Rev 32: 72–85, 2000. [DOI] [PubMed] [Google Scholar]
- Connors BW, Long MA. Electrical synapses in the mammalian brain. Annu Rev Neurosci 27: 393–418, 2004. [DOI] [PubMed] [Google Scholar]
- Csicsvari J, Jamieson B, Wise KD, Buzsáki G. Mechanisms of gamma oscillations in the hippocampus of the behaving rat. Neuron 37: 311–322, 2003. [DOI] [PubMed] [Google Scholar]
- Crandall SR, Cruikshank SJ, Connors BW. A corticothalamic switch: controlling the thalamus with dynamic synapses. Neuron 86: 768–782, 2015. [DOI] [PMC free article] [PubMed] [Google Scholar]
- Dan Y, Poo MM. Spike timing-dependent plasticity of neural circuits. Neuron 44: 23–30, 2004. [DOI] [PubMed] [Google Scholar]
- Deans MR, Gibson JR, Sellitto C, Connors BW, Paul DL. Synchronous activity of inhibitory networks in neocortex requires electrical synapses containing connexin36. Neuron 31: 477–485, 2001. [DOI] [PubMed] [Google Scholar]
- Fanselow EE, Richardson KA, Connors BW. Selective, state-dependent activation of somatostatin-expressing inhibitory interneurons in mouse neocortex. J Neurophysiol 100: 2640–2652, 2008. [DOI] [PMC free article] [PubMed] [Google Scholar]
- Fisahn A, Pike FG, Buhl EH, Paulsen O. Cholinergic induction of network oscillations at 40 Hz in the hippocampus in vitro. Nature 394: 186–189, 1998. [DOI] [PubMed] [Google Scholar]
- Fisahn A, Contractor A, Traub RD, Buhl EH, Heinemann SF, McBain CJ. Distinct roles for the kainate receptor subunits GluR5 and GluR6 in kainate-induced hippocampal gamma oscillations. J Neurosci 24: 9658–9668, 2004. [DOI] [PMC free article] [PubMed] [Google Scholar]
- Fisher NI. Statistical Analysis of Circular Data. Cambridge, UK: Cambridge Univ. Press, 1993. [Google Scholar]
- Fries P. Neuronal gamma-band synchronization as a fundamental process in cortical computation. Annu Rev Neurosci 32: 209–224, 2009. [DOI] [PubMed] [Google Scholar]
- Fries P, Reynolds JH, Rorie AE, Desimone R. Modulation of oscillatory neuronal synchronization by selective visual attention. Science 291: 1560–1563, 2001. [DOI] [PubMed] [Google Scholar]
- Fukuda T, Kosaka T, Singer W, Galuske RA. Gap junctions among dendrites of cortical GABAergic neurons establish a dense and widespread intercolumnar network. J Neurosci 26: 3434–3443, 2006. [DOI] [PMC free article] [PubMed] [Google Scholar]
- Galarreta M, Hestrin S. A network of fast-spiking cells in the neocortex connected by electrical synapses. Nature 402: 72–75, 1999. [DOI] [PubMed] [Google Scholar]
- Gibson JR, Beierlein M, Connors BW. Two networks of electrically coupled inhibitory interneurons in neocortex. Nature 402: 75–79, 1999. [DOI] [PubMed] [Google Scholar]
- Gibson JR, Beierlein M, Connors BW. Functional properties of electrical synapses between inhibitory interneurons of neocortical layer 4. J Neurophysiol 93: 467–480, 2005. [DOI] [PubMed] [Google Scholar]
- Hájos N, Pálhalmi J, Mann EO, Németh B, Paulsen O, Freund TF. Spike timing of distinct types of GABAergic interneuron during hippocampal gamma oscillations in vitro. J Neurosci 24: 9127–9137, 2004. [DOI] [PMC free article] [PubMed] [Google Scholar]
- Hájos N, Mody I. Establishing a physiological environment for visualized in vitro brain slice recordings by increasing oxygen supply and modifying aCSF content. J Neurosci Methods 183: 107–113, 2009. [DOI] [PMC free article] [PubMed] [Google Scholar]
- Hájos N, Ellender TJ, Zemankovics R, Mann EO, Exley R, Cragg SJ, Freund TF, Paulsen O. Maintaining network activity in submerged hippocampal slices: importance of oxygen supply. Eur J Neurosci 29: 319–327, 2009. [DOI] [PMC free article] [PubMed] [Google Scholar]
- Hansel D, Mato G. Asynchronous states and the emergence of synchrony in large networks of interacting excitatory and inhibitory neurons. Neural Comput 15: 1–56, 2003. [DOI] [PubMed] [Google Scholar]
- Hasenstaub A, Shu Y, Haider B, Kraushaar U, Duque A, McCormick DA. Inhibitory postsynaptic potentials carry synchronized frequency information in active cortical networks. Neuron 47: 423–435, 2005. [DOI] [PubMed] [Google Scholar]
- Hormuzdi SG, Pais I, LeBeau FE, Towers SK, Rozov A, Buhl EH, Whittington MA, Monyer H. Impaired electrical signaling disrupts gamma frequency oscillations in connexin36-deficient mice. Neuron 31: 487–495, 2001. [DOI] [PubMed] [Google Scholar]
- Hu H, Agmon A. Properties of precise firing synchrony between synaptically coupled cortical interneurons depend on their mode of coupling. J Neurophysiol 114: 624–637, 2015. [DOI] [PMC free article] [PubMed] [Google Scholar]
- Hu H, Ma Y, Agmon A. Submillisecond firing synchrony between different subtypes of cortical interneurons connected chemically but not electrically. J Neurosci 31: 3351–3361, 2011. [DOI] [PMC free article] [PubMed] [Google Scholar]
- Kopell N, Ermentrout B. Chemical and electrical synapses perform complementary roles in the synchronization of interneuronal networks. Proc Natl Acad Sci USA 101: 15482–15487, 2004. [DOI] [PMC free article] [PubMed] [Google Scholar]
- Lee S, Hjerling-Leffler J, Zagha E, Fishell G, Rudy B. The largest group of superficial neocortical GABAergic interneurons expresses ionotropic serotonin receptors. J Neurosci 30: 16796–16808, 2010. [DOI] [PMC free article] [PubMed] [Google Scholar]
- Long MA, Cruikshank SJ, Jutras MJ, Connors BW. Abrupt maturation of a spike-synchronizing mechanism in neocortex. J Neurosci 25: 7309–7316, 2005. [DOI] [PMC free article] [PubMed] [Google Scholar]
- Lytton WW, Sejnowski TJ. Simulations of cortical pyramidal neurons synchronized by inhibitory interneurons. J Neurophysiol 66: 1059–1079, 1991. [DOI] [PubMed] [Google Scholar]
- Mancilla JG, Lewis TJ, Pinto DJ, Rinzel J, Connors BW. Synchronization of electrically coupled pairs of inhibitory interneurons in neocortex. J Neurosci 27: 2058–2073, 2007. [DOI] [PMC free article] [PubMed] [Google Scholar]
- Mann EO, Suckling JM, Hájos N, Greenfield SA, Paulsen O. Perisomatic feedback inhibition underlies cholinergically induced fast network oscillations in the rat hippocampus in vitro. Neuron 45: 105–117, 2005. [DOI] [PubMed] [Google Scholar]
- McQuiston AR. Acetylcholine release and inhibitory interneuron activity in hippocampal CA1. Front Synaptic Neurosci 6: 20, 2014. [DOI] [PMC free article] [PubMed] [Google Scholar]
- Neske GT, Patrick SL, Connors BW. Contributions of diverse excitatory and inhibitory neurons to recurrent network activity in cerebral cortex. J Neurosci 35: 1089–1105, 2015. [DOI] [PMC free article] [PubMed] [Google Scholar]
- Neske GT. The slow oscillation in cortical and thalamic networks: mechanisms and functions. Front Neural Circuits 9: 88, 2016. [DOI] [PMC free article] [PubMed] [Google Scholar]
- Okun M, Lampl I. Instantaneous correlation of excitation and inhibition during ongoing and sensory-evoked activities. Nat Neurosci 11: 535–537, 2008. [DOI] [PubMed] [Google Scholar]
- Petersen CH, Hahn TT, Mehta M, Grinvald A, Sakmann B. Interaction of sensory responses with spontaneous depolarization in layer 2/3 barrel cortex. Proc Natl Acad Sci USA 100: 13638–13643, 2003. [DOI] [PMC free article] [PubMed] [Google Scholar]
- Postma F, Liu CH, Dietsche C, Khan M, Lee HK, Paul D, Kanold PO. Electrical synapses formed by connexin36 regulate inhibition- and experience-dependent plasticity. Proc Natl Acad Sci USA 108: 13770–13775, 2008. [DOI] [PMC free article] [PubMed] [Google Scholar]
- Salkoff DB, Zagha E, Yüzgeç Ö, McCormick DA. Synaptic mechanisms of tight spike synchrony at gamma frequency in cerebral cortex. J Neurosci 35: 10236–10251, 2015. [DOI] [PMC free article] [PubMed] [Google Scholar]
- Sanchez-Vives MV, McCormick DA. Cellular and network mechanisms of rhythmic recurrent activity in neocortex. Nat Neurosci 3: 1027–1034, 2000. [DOI] [PubMed] [Google Scholar]
- Seamari Y, Narváez JA, Vico FJ, Lobo D, Sanchez-Vives MV. Robust off- and online separation of intracellularly recorded up and down cortical states. PLoS One 2: e888, 2007. [DOI] [PMC free article] [PubMed] [Google Scholar]
- Shao YR, Isett BR, Miyashita T, Chung J, Pourzia O, Gasperini RJ, Feldman DE. Plasticity of recurrent L2/3 inhibition and gamma oscillations by whisker experience. Neuron 80: 210–222, 2013. [DOI] [PMC free article] [PubMed] [Google Scholar]
- Singer W, Gray CM. Visual feature integration and the temporal correlation hypothesis. Annu Rev Neurosci 18: 555–586, 1995. [DOI] [PubMed] [Google Scholar]
- Sippy T, Yuste R. Decorrelating action of inhibition in neocortical networks. J Neurosci 33: 9813–9830, 2013. [DOI] [PMC free article] [PubMed] [Google Scholar]
- Solbach S, Celio MR. Ontogeny of the calcium binding protein parvalbumin in the rat nervous system. Anat Embryol (Berl) 184: 103–124, 1991. [DOI] [PubMed] [Google Scholar]
- Soriano E, Del Rio JA, Ferrer I, Auladell C, De Lecea L, Alcantara S. Late appearance of parvalbumin-immunoreactive neurons in the rodent cerebral cortex does not follow an “inside-out” sequence. Neurosci Lett 142: 147–150, 1992. [DOI] [PubMed] [Google Scholar]
- Steriade M, Nuñez A, Amzica F. A novel (<1 Hz) oscillation of neocortical neurons in vivo: depolarizing and hyperpolarizing components. J Neurosci 13: 3252–3265, 1993. [DOI] [PMC free article] [PubMed] [Google Scholar]
- Steriade M, Amzica F, Contreras D. Synchronization of fast (30–40 Hz) spontaneous cortical rhythms during brain activation. J Neurosci 16: 392–417, 1996. [DOI] [PMC free article] [PubMed] [Google Scholar]
- Takada N, Pi HJ, Sousa VH, Waters J, Fishell G, Kepecs A, Osten P. A developmental cell-type switch in cortical interneurons leads to a selective defect in cortical oscillations. Nat Commun 5: 5333, 2014. [DOI] [PMC free article] [PubMed] [Google Scholar]
- Tiesinga PH, Fellous JM, Salinas E, José JV, Sejnowski TJ. Inhibtitory synchrony as a mechanism for attential gain modulation. J Physiol (Paris) 98: 296–314, 2004. [DOI] [PMC free article] [PubMed] [Google Scholar]
- Tiesinga P, Sejnowski TJ. Cortical enlightenment: are attentional gamma oscillations driven by ING or PING? Neuron 63: 727–732, 2009. [DOI] [PMC free article] [PubMed] [Google Scholar]
- Traub RD, Whittington MA, Stanford IM, Jefferys JG. A mechanism for generation of long-range synchronous fast oscillations in the cortex. Nature 383: 621–624, 1996. [DOI] [PubMed] [Google Scholar]
- Traub RD, Kopell N, Bibbig A, Buhl EH, LeBeau FE, Whittington MA. Gap junctions between interneuron dendrites can enhance synchrony of gamma oscillations in distributed networks. J Neurosci 21: 9478–9486, 2001. [DOI] [PMC free article] [PubMed] [Google Scholar]
- Van Vreeswijk C, Abbott LF, Ermentrout GB. When inhibition not excitation synchronizes neural firing. J Comput Neurosci 1: 313–321, 1994. [DOI] [PubMed] [Google Scholar]
- Vinck M, Womelsdorf T, Buffalo EA, Desimone R, Fries P. Attentional modulation of cell-class-specific gamma-band-synchronization in awake monkey area V4. Neuron 80: 1077–1089, 2013. [DOI] [PMC free article] [PubMed] [Google Scholar]
- Wang XJ, Rinzel J. Alternating and synchronous rhythms in reciprocally inhibitory model neurons. Neural Comput 4: 84–97, 1992. [Google Scholar]
- Wang XJ, Buzsáki G. Gamma oscillation by synaptic inhibition in a hippocampal interneuronal network model. J Neurosci 16: 6402–6413, 1996. [DOI] [PMC free article] [PubMed] [Google Scholar]
- White JA, Chow CC, Ritt J, Soto-Treviño C, Kopell N. Synchronization and oscillatory dynamics in heterogeneous, mutually inhibited neurons. J Comput Neurosci 5: 5–16, 1998. [DOI] [PubMed] [Google Scholar]
- Whittington MA, Traub RD, Jefferys JG. Synchronized oscillations in interneuron networks driven by metabotropic glutamate receptor activation. Nature 373: 612–615, 1995. [DOI] [PubMed] [Google Scholar]
- Whittington MA, Traub RD, Kopell N, Ermentrout B, Buhl EH. Inhibition-based rhythms: experimental and mathematical observations on network dynamics. Int J Psychophysiol 38: 315–336, 2000. [DOI] [PubMed] [Google Scholar]
- Wilson HR, Cowan JD. Excitatory and inhibitory interactions in localized populations of model neurons. Biophys J 12: 1–24, 1972. [DOI] [PMC free article] [PubMed] [Google Scholar]
- Wulff P, Ponomarenko AA, Bartos M, Korotkova TM, Fuchs EC, Bähner F, Both M, Tort AB, Kopell NJ, Wisden W, Monyer H. Hippocampal theta rhythm and its coupling with gamma oscillations require fast inhibition onto parvalbumin-positive interneurons. Proc Natl Acad Sci USA 106: 3561–3566, 2009. [DOI] [PMC free article] [PubMed] [Google Scholar]
- Zhao S, Ting JT, Atallah HE, Qiu L, Tan J, Gloss B, Augustine GJ, Deisseroth K, Luo M, Graybiel AM, Feng G. Cell type-specific channelrhodopsin-2 transgenic mice for optogenetic dissection of neural circuitry function. Nat Methods 8: 745–752, 2011. [DOI] [PMC free article] [PubMed] [Google Scholar]


