

Abstract
Objective: Comparative study of type 2 diabetes and healthy controls by metabolomics methods to explore the pathogenesis of Type II diabetes. Methods: Gas chromatography - mass spectrometry (GC-MS) with a variety of multivariate statistical analysis methods to the healthy control group 58 cases, 68 cases of Type II diabetes group were analyzed. Chromatographic conditions: DB-5MS column; the carrier gas He; flow rate of 1 mL·min-1, the injection volume 1 uL; split ratio is 100: 1. MS conditions: electron impact (EI) ion source, an auxiliary temperature of 280°C, the ion source 230°C, quadrupole 150°C; mass scan range 30~600 mAu. Results: Established analytical method based on urine metabolomics GC-MS of Type II diabetes, determine the urine succinic acid, L-leucine, L-isoleucine, tyrosine, slanine, acetoace acid, mannose, L-isoleucine, L-threonine, Phenylalanine, fructose, D-glucose, palmi acid, oleic acid and arachidonic acid were significantly were significantly changed. Conclusion: Based on metabolomics of GC-MS detection and analysis metabolites can be found differences between type 2 diabetes and healthy control group, PCA diagram can effectively distinguish Type II diabetes and healthy control group, with load diagrams and PLS-DA VIP value metabolite screening, the resulting differences in metabolic pathways involved metabolites, including amino acid metabolism, lipid metabolism, glucose metabolism and energy metabolism.
Keywords: Type 2 diabetes mellitu, urine, gas chromatography-mass spectrometry (GC-MS), metabolomics
Introduction
Type 2 diabetes mellitus (T2DM) is a common endocrine metabolic disease. The main clinical features are chronic hyperglycemia and insulin secretion deficiency and ketosis, also called the “metabolic syndrome”, and usually as the overall metabolic disorder. It is commonly believed that T2DM is caused by multiple risk factors, which include family history, population aging, obesity, high blood pressure, energy intake and physical activity [1].
Metabonomies is based on genomics and proteomics and an important part of systems biology. The function is quantified analysis of metabolites in all organisms to find the relative relationship between metabolites and physiological and pathological changes [2-6]. Most research objects were small molecules with relative molecular weight of less than 1000.
GC-MS is one of the most commonly used research techniques to study metabonomies in the current. The principle of the separation of gas chromatography is based on the difference of the boiling point of the substance, the difference of polarity and the difference of the adsorption to separate the mixture. MS result is obtained by recording the mass charge ratio of the sample changing gaseous ion. It provides an efficiently qualitative and quantitative tool for the study of complex compounds to combine of the two measures. GC-MS is a high sensitivity and high resolution analysis method which is combined the advantages of the high separation of chromatography and of identification accurate capability of mass spectrometry. It can detect a large number of low molecular weight metabolites and be less affected by the impact of the characteristics of the body. The urine was tested to analysis T2DM in this study. A variety of pattern recognition methods were used to analysis the data from the vast amount of biological information and the PCA, PLS-DA multivariate statistical methods were used to explore the changes of the metabolic products between the T2DM patients group and the healthy control group. It revealed the relative relation between product of metabolism and physiological and pathological changes and clearly to study the mechanism of T2DM and guide and evaluate of disease treatment by analyzing of differences in metabolic products by biochemical and biological information database.
Methods and material
Instruments, reagents and materials
6890N-5975B gas chromatography-mass spectrometer (Agilent Technologies, USA); DB-5MS elastic quartz capillary column (30 m×0.25 mm, 0.25 μm); BT224S 1/100000 electronic balance (Sartorius, Germany); KQ5200 ultrasonic cleaner (Kun Shan Ultrasonic Instruments Co., Ltd); XH-C vortex mixer (Jintan medical instrument factory); TGL-16G-C high speed refrigerated centrifuge (Shanghai Anting Scientific Instrument Factory); DZF-6020 vacuum drying box (Shanghai Qi Xin Scientific Instrument Co., Ltd.); S09-007-01 ultra low temperature refrigerator (Thermo); HSC-20A Termovap Sample Concentrator (Tianjin Heng Ao science and Technology Development Co., Ltd).
Lot: DF658 acetonitrile (Honeywell Burdick & Jackson); 20120206 pyridine (Tianjin Kermel Chemical Reagent Co., Ltd.); Lot: LR10O40 Methoxyamine hydrochloride (Beijing bailingwei Technology Co. Ltd.); Lot: LS70O107 N-methyl-N- (trimethyl-silyl) three fussol (Beijing bailingwei Technology Co. Ltd.); Lot: A0330141 chlorotrimethylsilane (ACROS ORGANICS); Lot: SLBB0100V urease SIGMA-ALDRICH; Lot: 91120 tridecanoic acid Dr. Ehrenstorfer GmbH; 20140625 He (Harbin Qing Hua industrial gases Co. Ltd.).
The urine samples were collected after patients consents at early morning (fasting time was over 8 h). Samples were from the Department of Nephrology of Center hospital of Jiamusi in Heilongjiang province, in which there were 68 cases from healthy people and 58 cases from patients with T2DM.
Experimental method
Preparation of test solution:Urease solution: 0.1 mg urease was added into 10 mL flask, volume with pure water and shaking; tridecanoic acid internal standard solution: The 4.0 mg thirteen alkyl acid internal standard was precisely weighted and added into a 100 mL volumetric flask, then volume with pure methanol and shaking; Pyridine pyridine solution: 0.15 g methoxyamine hydrochloride was added into 10 mL volumetric flask, volume with pyridine solution and shaking; Silane derivatization reagent: 10 mL N-methyl-N- (trimethyl-silyl) three fussol solution and 100 μL chlorotrimethylsilane solution were mixed.
The urine samples were thawed about 30-60 min at 4°C on ice. The 100 μL urine sample were added into centrifuge tube and 15 μL 10 mg/mL urease solution were added; vortex mixing for 10 s and treated with 37°C water bath for 1 h; 1000 μL tridecanoic acid internal standard solution was added and high speed vortex for 5 min at room temperature; and then centrifuged for 15 min at 4°C, 15000 rpm; 1000 μL supernatant was transferred into a centrifuge tube, drying at room temperature with nitrogen; adding 100 μL Pyridine pyridine solution (15 mg/mL) into the dried sample and investigating the diffient temperature and time; adding 10 μL derivatization reagents (MSTFA: TMCS=100:1 v/v) and nvestigating the different temperature and time; centrifuing at 3000 rpm for 10 min at room temperature and transferring supernatant to dry clean centrifuge tube and to be GC-MS analysis.
Chromatographic condition: Chromatographic column DB-5MS elastic quartz capillary column (30 m×0.25 mm 0.5 μm); Sample inlet temperature was 270°C; No shunt sampling; current speed: 1.0 mL/min; Carrier gas was high purity helium (99.999%); Sample volume was 1 μL; Solvent delay 3 min. Condition of mass spectrometry: fourth stage rod temperature was 150°C; ionization mode was EI; ion source temperature was 230°C; electron energy was 70 eV; mass was range 30 mAu to 6000 mAu; scanning interval was 0.2 s/scan; electron multiplier voltage was 0.90 kV. Gradient heating program: 0~45 min, 60°C~300°C; rate: 10°C/min; running temperature was 300°C; running time was 3 min.
Results
Selection of preparation method of test solution
Selection of extraction solvent
In this study, we compared the effects of acetonitrile and methanol on the metabolic profile of urine samples. We selected the optimal conditions by comparing the total ion flow chart of the urine sample after the two treatments. Total ion current of urine sample showed in Figure 1. The result indicated the peak number and peak area of the chromatogram before filtering in the total ion current chromatogram of the urine sample by acetonitrile treated were all lower than that of the methanol, and the difference between the peak and peak of the filter was not large. Based on the above results, we chose methanol as the extraction agent.
Figure 1.
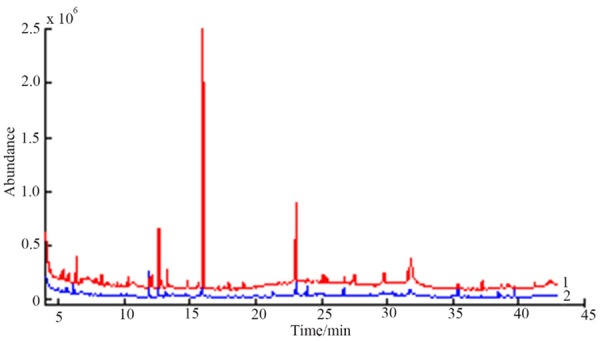
Comparison of total ion current of iurine samples in the treatment of methanol (1) and acetonitrile (2).
Selection of the conditions of oximate
In this experiment, we compared the different conditions of oximate of the urine sample (see Table 1). The results (Figure 2) showed that the peak number and peak area of the metabolites that were obtained from the conditions 2 were higher than those in the condition 1. There were no differences between the condition 3 and condition 2 of the peak area and the peak area of metabolites. Based on the above results, selection of the conditions of oximate was prepared by the reaction of 1 h at 70°C.
Table 1.
Three kinds of the conditions of oximate of urine samples
| Number | The conditions of oximate | ||
|---|---|---|---|
|
| |||
| Temperature (°C) | Time (h) | Heater | |
| 1 | 70 | 0.5 | Oven |
| 2 | 70 | 1 | Oven |
| 3 | 37 | 12 | Oven |
Figure 2.
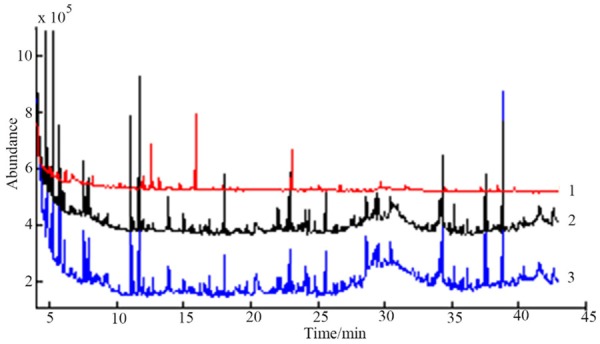
Comparison of total ion current of iurine samples prepared bythe conditions of oximate 1, 2 and 3.
Selection of derivatization conditions
This stud was compared the urine samples according to Table 2. The results (Figure 3) showed that the peak area under the condition 1 was lower than that of the condition 2 and condition 3 and the peak area of the lower part of the condition 3 was higher than the condition 2, which maight be due to the time of condition 3 too long to some samples of the volatile concentration increased. The derivative conditions by Comprehensive analysis was the 60°C for 2 h.
Table 2.
Three kinds of derivatization conditions of urine samples
| Number | Derivatization Conditions | ||
|---|---|---|---|
|
| |||
| Temperature (°C) | Time (h) | Heater | |
| 1 | 60 | 1 | Oven |
| 2 | 60 | 2 | Oven |
| 3 | 37 | 12 | Oven |
Figure 3.
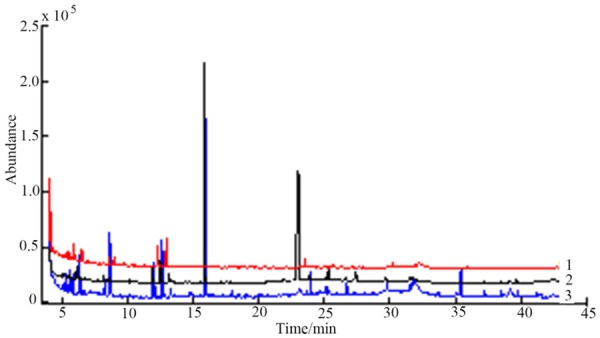
Comparison of total ion current in urine samples prepared by derivatization condition 1 , 2 and 3.
Precision experiment
Take the same sample solution for testing in conditions of paragraph 2.1 chromatographic for 6 times. The results showed that chromatographic peak number and main common peaks in the relative area of the relative standard deviation (RSD) were less than 5%, which showed that the instrument with good precision and can meet the requirements.
Reproducibility experiment
To collect 6 parallel urine sample parallel for the test solution. The results showed that chromatographic peak number and main common peaks in the relative area of the relative standard deviation (RSD) were less than 5%, which showed that urine sample solution preparation method with good reproducibility and can meet the requirements.
Stability test
Daily stability
Urine samples that treated by the tested sample solution preparation method placed at 4°C in the refrigerator. The samples were measured at 0, 2, 4, 6, 8, 10 h respectively, and then comparing 6 kinds of times. The results showed that chromatographic peak number and main common peaks in the relative area of the relative standard deviation (RSD) were less than 5%, which showed that tested product stability is good in 4°C for 10 h.
Freeze-thaw stability
We took 400 μL frozen urine samples after melting from -80°C into the centrifuge tube and put it back in -80°C immediately. Until to completely frozen and then removing to melt, we removed 100 μL into the centrifugal tube. We repeated four times according to the above method to prepare all samples. The results showed that chromatographic peak number and main common peaks in the relative area of the relative standard deviation (RSD) were less than 5%, which showed that the four freeze-thaw cycles had good stability.
Establishment of metabolic profile in human urine sample
After the preparation method of urine samples and detection conditions were determined, we analyzed by the optimal conditions and got the result of the total ion current of GC-MS in the healthy control group and type two diabetic patients group. Seeing Figure 4. Because of the large number of experimental samples, in order to reduce retention time drift and different chromatogram backgrounds, we analyzed the samples by automated mass spectrometry (AMDIS), NIST05a, and MZ-mine. The compounds were in all 30 kinds.
Figure 4.
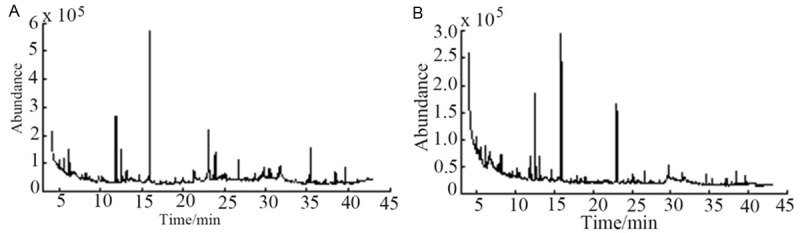
GC-MS total ion flow of human urine sample. A. Total ion current of healthy human urine sample. B. Total ion flow in urine samples of patients with T2DM.
Principal component analysis of metabolic profile in human urine sample
The result of component analysis of metabolic profile of human urine sample in 68 T2DM patients and 58 healthy people showed in Figure 5. It can be known from the chart that the PCA chart shows the distribution of the healthy control group and the type two diabetes group and the two groups have obvious classification. The difference of the metabolic pattern between the two groups. It indicated that there was difference of the metabolic pattern between the two groups. In addition, it could be seen from the chart that the distribution of type two diabetes patients was more dispersed and the distribution of healthy control group was more compact. This showed that the healthy control group did not have the disease and the physiological metabolic pattern was close. Because of the serious degree of disease, their physiological and metabolic pattern was different and showed a certain degree of aggregation tendency in T2DM patients.
Figure 5.
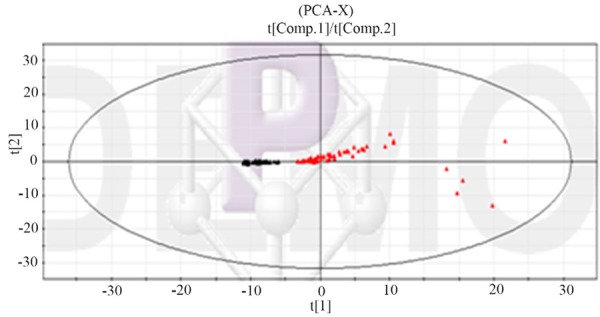
PCA score of the metabolic profile of urine samples in T2DM patients and healthy controls (Red is T2DM patients; black is healthy control group).
PLS-DA discriminant model for human urine samples
The results of PCA analysis showed that there were significant differences in the urine samples of healthy control group and T2DM patients. In order to further distinguish these two groups and to accurately identify the T2DM patients, we established a more accurate predictive ability discriminant model of the PLS-DA. Seeing Figure 6.
Figure 6.
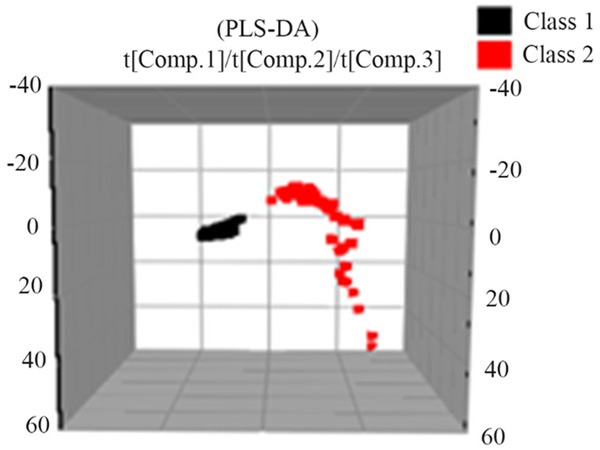
PLS-DA score of the metabolic profile of urine samples in T2DM patients and healthy controls (Red is T2DM patients; black is healthy control group).
Determination of potential biomarkers
Through the observation of Figure 6, we could know that the healthy control group and type two diabetes patient’s metabolic map was very similar and the material contains almost the same, but the content was different. It was very difficult to find the potential biomarkers with the ability of discrimination only by observing map. Therefore, this study used MZ-mine software to deal with the original chromatogram of the filter noise, background subtraction and cite SIMCAP 11.5 to establish a principal component analysis and partial least squares regression model. We used the PLS-DA loading matrix to identify the healthy control group and T2DM group and choose the variables that were far apart from the origin which was greater contribution to classification (Figure 7). In SIMCAP software, each PLS-DA could generate an S diagram (Figure 8), which can be used to explain the contribution of the model to the classification. The horizontal coordinate P in the figure represented the covariance of each variable and the P (CORR) of each variable represented the correlation coefficient of each variable. Through the above analysis and screening, we got 14 different metabolites urine samples and used t test to analysis healthy control group and T2DM patients (Figure 9, Table 3), which the potential biomarkers of P<0.05 were identified as endogenous biomarkers.
Figure 7.
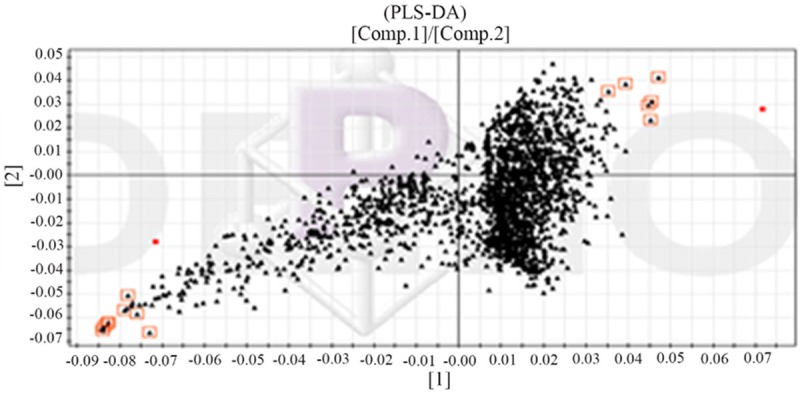
PLS-DA analysis of load matrix diagram of urine sample (▲ represnted variable, With □ marking of the first 10 variables was the maximum VIP).
Figure 8.
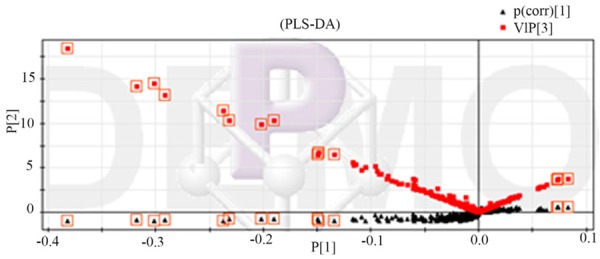
Urine test product VIP map combined with S (▲ represnted variable, With □ marking of the first 10 variables was the maximum VIP).
Figure 9.
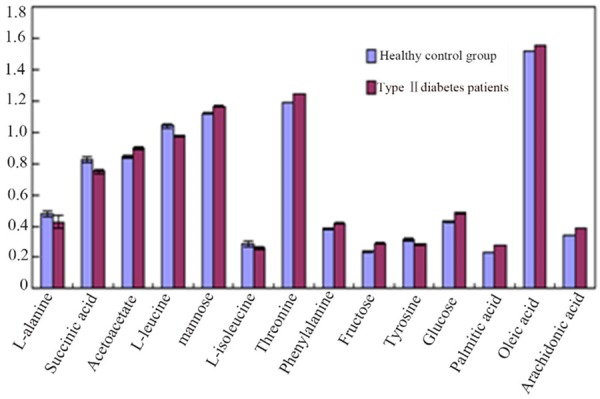
Histogram of differential metabolites of urine samples of the two groups.
Table 3.
T-test of urine test product
| Compound name | Healthy control group | T2MD group |
|---|---|---|
| L-Ala | 0.478±0.012 | 0.426±0.023↓↓ |
| Succinic acid | 0.823±0.009 | 0.750±0.006↓↓ |
| Acetacetic acid | 0.843±0.028 | 0.899±0.008↑↑ |
| L-leucine | 1.041±0.019 | 0.977±0.039↓↓ |
| Mannose | 1.121±0.016 | 1.167±0.013↑↑ |
| L-isoleucine | 0.284±0.006 | 0.258±0.007↓↓ |
| Threonine | 1.191±0.011 | 1.246±0.007↑↑ |
| Phenylalanine | 0.385±0.004 | 0.416±0.006↑↑ |
| Fructose | 0.239±0.020 | 0.291±0.010↑↑ |
| Tyrosine | 0.313±0.003 | 0.284±0.002↓↓ |
| Glucose | 0.428±0.005 | 0.485±0.004↑↑ |
| Palmitic acid | 0.236±0.006 | 0.281±0.002↑↑ |
| Oleic acid | 1.521±0.008 | 1.555±0.005↑↑ |
| Arachidonic acid | 0.345±0.004 | 0.383±0.003↑↑ |
Note: the significant difference in the content of the urine labelling samples in the healthy control group and T2DM patients. Up: ↑, P<0.05;
P<0.01;
Down: ↓, P<0.05;
P<0.01.
Discussion
In this study, we established method based on the GC-MS method for the analysis of urine metabolism in T2DM patients, which was included the preparation method of the sample solution, the setting of the GC-MS analysis parameters, the establishment of the metabolic profile of urine samples and the identification of endogenous metabolites. And we studied the methods of analysis and test of metabonomics, which was included the repeatability of the method, the precision of the instrument, the stability of the day and the stability of the freezing and thawing. The detection range of the detector was enlarged by the derivatization process; the sensitivity of the detector to the metabolite was improved; the maximum of the metabolic information was collected. The results showed that the analysis of metabolome established in this study could be successfully obtained a human urinary metabolites information. The method repeatability was good, instrument with good precision, stability samples within 12 hours, four times freezing thawing cycle having little effect on samples. The RSD were all less than 5%.
We analyzed the metabolites in urine samples with qualitatively and quantitatively by means of multivariate statistical analysis and NIST05a standard mass library and successfully identified 30 endogenous metabolites in urine. We used MZ-mine to translate the mass information into the data available for analysis and used pattern recognition methods of SIMCA-P software to analyze the urine samples of the healthy control group and T2DM group. The PCA score plot intuitive reflected the distribution of health control group and T2DM group and the two groups had clear classification. We screened the metabolites by PLS-DA map and S map and VIP values and finally obtained 14 different metabolites in the urine samples. The succinate, L-leucine, L-isoleucine, tyrosine showed a downward trend; alanine, acetyl amine, mannose, l-threonine, phenylalanine, fructose, D-glucose, palmitic acid, oleic acid and arachidonic acid showed rising trend. By analysis of these metabolites, we got the conclusion that these metabolites mainly related to amino acid metabolism, lipid metabolism, glucose metabolism and energy metabolism and other metabolic pathways.
The lipid metabolism, amino acid metabolism, glucose metabolism and other metabolic pathways in T2DM patients had different degrees of disorder and affect each other. T2DM is a metabolic disease that is caused by the action of multi factors. Therefore, for T2DM pathogenesis research cannot from unilaterally to study, but should be integrated a variety of factors analysis, to obtain a more accurate method for clinical diagnosis and treatment of T2DM.
Acknowledgements
National Natural Science Foundation of China (General Program, Grant No. 81274036); Harbin special funds for technological innovation research projects (2015RQQXJ043); Heilongjiang University of Chinese Medicine Excellent Innovation Talents.
Disclosure of conflict of interest
None.
References
- 1.Hu K, Ruan LJ, Ge WH. Urine Metabonomics Research of Type 2 Diabetic Rat Model. Journal of Zhejiang Chinese Medical University. 2013;37:751–760. [Google Scholar]
- 2.Fiehn O. Metabolomics the link between genotypes and phenotypes. Plant Mol Biol. 2002;48:155–171. [PubMed] [Google Scholar]
- 3.Garlow SJ. And Now, Transcriptomics. Neuron. 2002;34:327–328. doi: 10.1016/s0896-6273(02)00680-3. [DOI] [PubMed] [Google Scholar]
- 4.Gilchrist A, Au CE, Hiding J, Bell AW, Fernandez-Rodriguez J, Lesimple S, Nagaya H, Roy L, Gosline SJ, Hallett M, Paiement J, Kearney RE, Nilsson T, Bergeron JJ. Quantitative proteomics analysis of the secretory pathway. Cell. 2006;127:1265–1281. doi: 10.1016/j.cell.2006.10.036. [DOI] [PubMed] [Google Scholar]
- 5.Kern A, Tilley E, Hunter IS, Legisa M, Glieder A. Engineering primary metabolic pathways of industrial micro-organisms. J Biotechnol. 2007;129:6–29. doi: 10.1016/j.jbiotec.2006.11.021. [DOI] [PubMed] [Google Scholar]
- 6.Heijne WH, Stierum RH, Slijper M, van Bladeren PJ, van Ommen B. Toxicogenomics of bromobenzene hepatotoxicity: a combined transcriptomics and proteomics approach. Biochem Pharmacol. 2003;65:857–875. doi: 10.1016/s0006-2952(02)01613-1. [DOI] [PubMed] [Google Scholar]