Abstract
Cubic colloids, sedimented on a surface and immersed in a solution of depletant molecules, were modeled with a family of shapes which smoothly varies from squares to circles. Using Wang-Landau simulations with expanded ensembles, we observe the formation of rhombic lattices, square lattices, hexagonal lattices and a fluid phase. This systematic investigation includes locating transitions between all combinations of the three lattice structures upon changing the shape, and transitions between the fluid and crystal upon changing the depletant concentration. The rhombic lattice deforms smoothly between square-like and hexagonal-like angles, depending on both the shape and the depletant concentration. Our results on the effect of the depletant concentration, depletant size, and colloid shape to influence the stability of the fluid and the lattice structures may help guide experimental studies with recently synthesized cubic colloids.
Keywords: self-assembly, colloids, computer simulation
I. INTRODUCTION
The effect of particle shape on self-assembly has captured the attention of mathematicians, physicists and chemists1–4 for hundreds of years.5 Recent advances have enabled the experimental synthesis of colloidal particles with unique shapes,6 with aspirations of ultimately reaching biological complexity.7 In addition to shape anisotropy, depletant molecules in solution also lead to anisotropic, attractive interactions8 which promote spontaneous self-assembly and crystallization. Given a description of particle shape and interparticle interactions, the ability to predict the self-assembled structures that might form remains a challenge. Theory and simulation of anisotropic particles play an important role as a guide for understanding experiments and predicting novel structures.4,9–11
While spheres and circles are among the most commonly modeled shapes due to their isotropy, cubes and squares have been the subject of comparatively fewer studies due to the difficulty in modeling shape anisotropy. This difficulty has been circumvented in the study of parallel hard squares and cubes.12–14 Recently, cubic colloids have been synthesized experimentally,15–19 and accordingly, simulations have been performed on freely rotating cubes, squares or truncated polyhedra,20–28 and on a family of shapes which smoothly varies between cubes and spheres29–32 or squares and circles.33–35 In addition, hard cubes under shear have also been studied with experiments and simulation.36
While many of the previous studies considered only hard particles, the focus of this simulation work is on the effect of depletant molecules in solution. The addition of an attractive depletant interaction promotes self-assembly and crystallization at lower colloid concentrations than the previous packing studies of hard particles with no depletant molecules. In Rossi et al., sedimented cubic colloids in a solution of depletant molecules were observed to undergo a transition between square and rhombic lattices, depending on the size of the depletant.18 In contrast to hard particles with no depletant, the transition demonstrated by Rossi et. al. is a novel example of how interaction-dependent structures may be augmented by depletant. In addition, cubic colloids confined to a surface were simulated with explicit depletant molecules and shown to exhibit a square to rhombic lattice transition.18 Because explicitly simulating the depletant molecules is computationally expensive, there is no systematic computational study of many different depletant interactions and colloidal shapes for cubic colloids sedimented on a surface.
In this computational study, we investigated the self-assembly and crystallization of a family of shapes which smoothly varies between squares and circles, in a solution with depletant molecules, and for a range of depletant concentrations and different depletant sizes. To our knowledge, this is the first implicit depletant simulation of cubic colloids sedimented on a surface. We find that the family of shapes, which varies continuously from squares to circles, form rhombic lattices, square lattices, and hexagonal lattices in addition to a fluid phase, depending on the shape, depletant concentration and depletant size. Specialized simulation techniques are utilized to identify transitions between fluids and the formation of crystal lattices, and also transitions between all combinations of the three observed lattice types, in order to construct pseudo phase diagrams for the most stable structure for a variety of conditions.
This paper is organized as follows. The colloid model is described in Section II. In Section III, we describe the methods used to simulate the family of shapes from squares to circles. In Section IV, the results are provided for the stability of the lattice structures over a wide range of shapes, depletant concentrations, and different depletant sizes. Finally, conclusions are provided in Section V.
II. MODELS
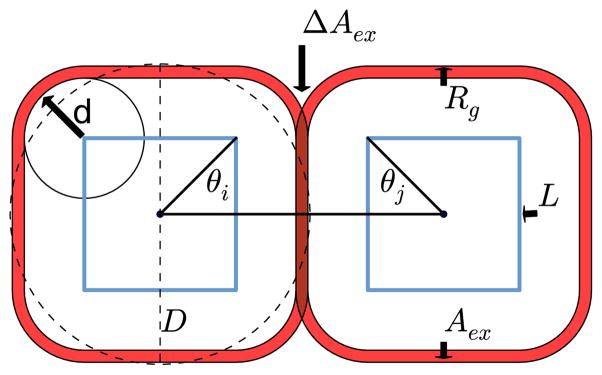
Cubic colloids sedimented on a surface were modeled as rounded squares. The roundness of the colloidal particle refers to the roundness of the corners or the amount of curved surface, which can be described by the parameter d. The roundness, d, smoothly varies from a square, where d = 0, to a circle, where d = D/2 (D is the diameter). Geometrically, the shape of the colloidal particle is defined by all points inside or within a distance d of an inner square of side length L, shown in Figure 1. The area of the rounded square, A, was held constant for all shapes, such that A = L2 + 4Ld + πd2 = πD2/4, where D is the diameter of a circle, which corresponds to the largest amount of curved surface. The potential model for the interaction between rounded squares, U = Uh +Udep +Uel, includes hard-particle steric interactions, Uh, attractive depletant interaction, Udep, and screened electrostatic repulsion, Uel, as described below.
FIG. 1.
Two rounded squares with center separation distance of r = L + 2d + Rg, relative orientation of Θi = Θj = π/4, depletant excluded area in red, d/D = 0.2, and Rg/D = 0.04. D is the diameter of a circle with the same area as the rounded square.
The rounded squares were modeled as hard particles. The interaction between two rounded squares i and j, is defined by the center separation distance, r, and the relative orientations of the two squares, θi, and θj. The angles, θi and θj were defined by the angle between the vector connecting the two centers of the squares, and the vector pointing to a corner of the square i or j, as shown in Figure 1. The angles θi and θj were subject to periodicity of π/2, and some symmetry conditions. Thus, given r, θi, and θj, the hard particle potential energy, Uh, is given by
| (1) |
where rh(θi, θj) is the hard center separation distance at contact, which is computed numerically as described in Appendix B.
The rounded squares possess an attractive interaction, Udep, due to the interaction with a solution of depletant molecules with a given radius of gyration, Rg, and concentration, ϕ. While previous studies have modeled the depletant molecules explicitly,18 the depletant molecules in this work were treated implicitly by computing excluded areas. This approach is more computationally efficient than explicitly simulating the depletant molecules, especially if one needs to explore large regions of phase space or simulate non-spherical colloids. The excluded area of the depletant is given by all points within a distance Rg from the surface of the rounded square, shown in Figure 1. For two rounded squares separated by a distance r with relative orientation (θi, θj) and excluded area overlap, ΔAex, the attractive entropic interaction, Udep is given by15,37
| (2) |
where kB is the Boltzmann constant and T is the temperature. The depletant concentration, ϕ, in Equation 2 was made dimensionless, and the combined quantity ϕkBT was used as a single parameter to set the strength of the entropic interaction. Note that many-body effects arise for the implicit depletant interaction when the excluded area of more than two particles simultaneously overlap,38 but these many-body terms are expected to be small for Rg ≪ D, which is the case in this work. Alternative methods have been developed which incorporate many-body effects, including the derivation of an effective one-component Hamiltonian of the colloids39 and parallel algorithms to treat the depletants implicitly.40 Quantitative estimates of the many-body contribution for special cases are discussed in Section IV.
In addition to the steric and depletion interactions, the cubic colloids also possess a screened electrostatic repulsion. The screened electrostatic repulsion, Uel, was approximated as
| (3) |
where χ and κ are parameters for the electrostatic interaction. Note that the three-dimensional form of the screened electrostatic, or Yukawa, potential was chosen because the experimental system of interest is in 3D with particles that are confined to a surface. The electrostatic potential depends on the anisotropic shape of the cubes, the temperature, inverse Debye screening length, and the surface charge.41 The electrostatic interaction is short-ranged, where typical values, taken from recent experimental work,19 of the zeta potential, −30mV, and the inverse Debye length, 0.5nm−1, leads to an order of magnitude estimate of κD = 103, which was used in this work. The stability of the model is improved by including electrostatic repulsion because the position of the minimum is now offset from hard contact. Without this effect, there is a discontinuous jump from steric interaction precisely at the minimum of the potential, which may lead to poor numerical stability in the computer simulation algorithms, and may lead to error in potential-function optimizations (e.g., tabular potentials). The electrostatic interaction also makes this model more amenable to molecular dynamics simulations. According to estimates of typical cubic colloidal systems,15 the parameter χ was chosen to be small such that the value of the total potential energy minimum is near the value of Udep(rh). For convenience, χ/D = ϕkBT in this work, such that the total potential energy, U = Uh + Udep + Uel, may be scaled by ϕkBT. The results are not expected to change qualitatively if the electrostatic interaction is removed. Quantitative changes may result from the slight change in the depth of the potential well, but these differences may be accounted for by matching the second virial coefficient via extended corresponding states.42,43 Although the Uel term is generally small, it is both a physically meaningful quantity for comparison with experiments and improves transferability of the model to molecular dynamics.
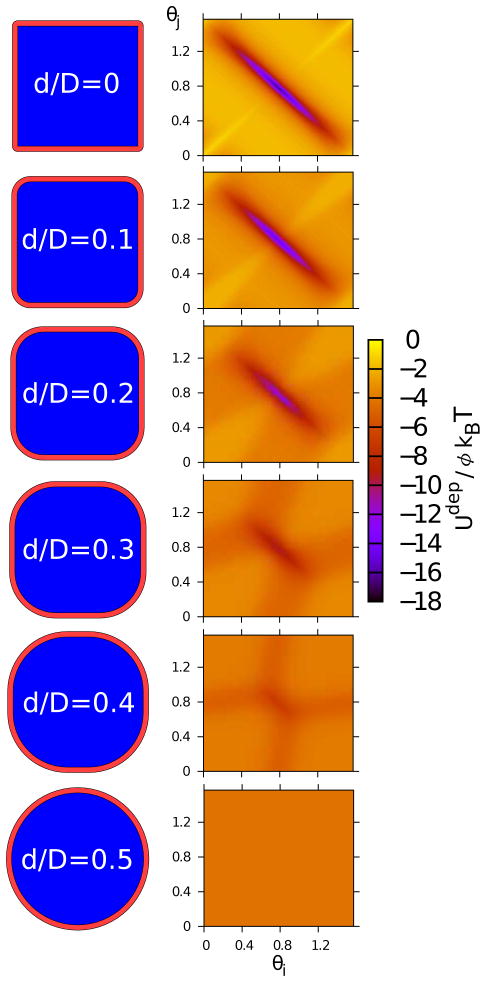
Figure 2 shows the pair-wise potential between two rounded squares in depletant for three orientations. Note that the contribution of the electrostatic interaction to the total potential may be seen by the curvature of the potential well in Figure 2, where a discontinuous jump would occur in the absence of the screen electrostatics. Figure 3 shows the minimum in the attractive potential energy at the contact separation distance, rh, as a function of the two relative orientations for a series of values of roundness, d.
FIG. 2.
The potential energy between two rounded squares in depletant for Rg/D = 0.04 and d = 0 as a function of distance between centers of the squares for the following orientations, depicted by the black squares: (solid black line) θi = θj = π/4 (dashed black line) θi = π/4, θj = 0 (red line) θi = θj = 0.
FIG. 3.
The attractive entropic interaction, Udep, between two rounded squares due to depletant molecules of size Rg/D = 0.04 at contact, rh(θi, θj ), for a range of values of roundness, d. Particle faces are in contact at the center of the figure (θi = θj = π/4), while particle corners are at contact at the corners of the figure (θi and θj are 0 or π/2).
III. METHODS
Sedimented cubic colloids with depletant interactions were simulated using Wang-Landau (WL) Monte Carlo simulations, which compute the free energy and potential energy as a function of an order parameter of interest, as well as provides detailed structural information, in a single simulation.44 In this work, the following two order parameters were investigated: the depletant concentration, ϕ, and the shape, d/D. Expanded ensembles45,46 were required for these order parameters. In order to make the simulations computationally tractable, the potential between rounded squares was tabulated, as described in Appendix B. Specialized Monte Carlo algorithms were employed, in order to implement expanded ensembles and improve sampling of collective motion, as described in Section III A. The WL simulations are described in more detail in Section III B. Finally, the algorithm to define the dominant crystal lattice structure is described in Section IIIC
A. Monte Carlo Trials
The following Monte Carlo trials were employed. Translations and rotations of particles were attempted with equal probability. For shape expanded ensemble (SEE) simulations, the roundness parameter of all particles was attempted to be increased or decreased, with 50 % probability, by a fixed increment, d ↓ d±δd, subject to Metropolis acceptance criteria. For depletant concentration expanded ensemble (DEE) simulations, depletant-concentration moves consisted of increasing or decreasing ϕ by a fixed amount, ±δϕ, subject to Metropolis acceptance criteria.
Collective trial moves were also implemented to facilitate convergence in systems with short-ranged attractive interactions that self-assemble.18,47 This included rigid-body translations and rotations of clusters, where clusters were defined as all particles with excluded area overlap, rh(θi, θj) < r < rc(θi, θj ), with at least one other particle in the cluster, obtained via recursive flood-fill algorithm. To obey detailed balance, cluster moves resulting in a particle joining a different cluster were rejected. The geometric cluster algorithm (GCA) was also used.18,48,49 The GCA is a rejection-free algorithm that collectively moves particles, and results in better sampling of clusters of particles than traditional single particle moves. The algorithm proceeds as follows. A particle and a pivot point in space are randomly selected, and the particle is reflected about the pivot. All other particles which interact with the pivoted particle, in both the old and newly pivoted positions, are then attempted to be pivoted with a probability related to the pair interaction energy between the two particles. Each attempted pivot was carried out recursively until all the interacting particles were attempted to be pivoted. To avoid inefficient moves involving most of the particles in the system, the pivot point was confined to a cubic box centered on the first randomly selected particle. The size of this bounding cubic box was tuned via 5 % changes every 106 trials, in order to obtain an average target number of particles involved in a pivot, set to Nmax/5, where Nmax is the maximum number of particles in the simulation. Note that while the rigid cluster moves could not create or destroy clusters due to detailed balance, the GCA does not suffer from this limitation.
Simulations with fluctuating periodic boundary conditions were performed in order to avoid bias imposed by the geometry of the simulation box on the periodicity of crystallized particles.50 In practice, the simulation cell was defined by two vectors. One vector lies parallel to the x-axis, and will be referred to as υ1, while the other vector is referred to as υ2. The value of the domain tilt is the projection of υ2 on υ1 (i.e., zero tilt when υ1 and υ2 are perpendicular). The size of the domain does not change with changing tilt, such that υ1 is constant, and the projection of υ2 along the y-axis is constant. The absolute value of the domain tilt was constrained to not exceed 75 % of the length of υ1. In the domain tilt trial move, the value of the tilt was attempted to be randomly increased or decreased, with the center of mass of the particles subject to the same affine transformation as the domain, subject to Metropolis acceptance criteria. Note that for simulations with fluctuating periodic boundary conditions, the geometric cluster algorithm was not used.
The weights for the probability of selection of each trial type are provided in Table I. For each Monte Carlo trial that involved movement of particles or domain tilt, the parameter associated with the maximum change was optimized, via a 5 % change every 106 trials, to yield approximately 25 % acceptance of the trial move.
TABLE I.
Monte Carlo trials and relative weights for the probability of selection.
| trial | weight |
|---|---|
| single-particle translation or rotation | 1 |
| cluster translation or rotation | 1/5Nmax |
| geometric cluster algorithm | 1/Nmax |
| shape change (SEE only) | 1/Nmax |
| domain tilt (fluctuating box only) | 1/Nmax |
| depletan concentration change (DEE only) | 1/100 |
B. Wang-Landau
Wang-Landau (WL) sampling is a flat-histogram method used to obtain the probability distribution function of some specified order parameter. Other useful quantities that can be collected during the simulation include the potential energy and structural information. In order to estimate statistical error, all simulations were conducted with 12 identical, independent replicas with different random number seeds. The Wang-Landau update factor was initially set to unity, and was multiplied by 0.5 whenever the flatness criteria of 80 % was met (see Appendix A of Ref.51 for implementation details of WL). Averaged quantities of interest, such as the potential energy, were not stored until the update factor was smaller than 10−6. Simulations were terminated when the update factor was smaller than 5 × 10⁻¹¹. For both DEE and SEE ensembles, the size of the macrostate bin was equal to the trial step change (i.e., δϕ or δd, respectively). Configurations were stored every 105 trials for analysis. Unless otherwise specified, the periodic boundaries of the simulation domain was a square of side length l.
In order to determine the most stable structure for a given ϕ, d, Rg and particle number density, ρ, depletant concentration expanded ensemble (DEE) WL simulations were performed. The DEE is analogous to the temperature expanded ensemble,45,46 and facilitates sampling of crystallite formation and destruction. The DEEWL simulations were conducted for a range of ϕ in the interval [ϕmin, ϕmax], using increments of δϕ = 0.02 for a constant number of particles, N, and constant roundness, d. For both Rg/D = 0.04 and 0.08, a series of DEE simulations was conducted for d/D in the range [0, 0.5] in intervals of 0.025, and with N = 72 and l/D = 12, such that ρD2 = ND2/l2 = 0.5. For Rg/D = 0.04, ϕmin = 0.3 and ϕmax = 1.3. For Rg/D = 0.08, ϕmin = 0.5 and ϕmax = 2. In order to increase resolution in a particular region of parameter space for Rg/D = 0.04, additional simulations were conducted in the ϕ range [0.355, 0.37] in intervals of 0.005. Additional simulations were also conducted to investigate the effect of system size, l, and the effect of the concentration of rounded squares, ρ, for Rg/D = 0.04 and d/D = 0, 0.35, 0.375 and 0.5. Simulations were conducted for studying systems size effects for the same concentration, ρD2 = 0.5, with N = 128 and l/D = 16. Simulations for studying concentration effects were conducted for N = 100, l/D = 12, with ρD2 ≈ 0.7. Simulations with a fluctuating box were performed for d in the range [0, 0.5] in intervals of 0.1, and with N = 72, l/D = 12, and Rg/D = 0.04 and 0.08.
Shape expanded ensemble (SEE) WL simulations were conducted for a range of d/D values in the interval [0.325, 0.4] at fixed number of particles, N = 72, and constant depletant concentration, ϕ, with δd/D = 0.001, Rg/D = 0.04 and l/D = 12. The SEE WL simulations were conducted for both ϕ = 1.15 and 1.2. In addition, another set of SEE WL simulations were conducted to compute radial distribution functions for ϕ in the range [0, 0.5] in intervals of 0.1, with a range of d/D values in the interval [0, 0.5] for Rg/D = 0.04, N = 72, l/D = 12 and δd/D = 0.05.
C. Crystal Structure Analysis
The rounded squares formed clusters of square, rhombic and hexagonal lattices at sufficiently high depletant concentrations. The crystallite lattices were identified by analyzing the structures observed in the simulations. Transitions between different structures were also identified using thermodynamic definitions, and they were consistent with the structural metrics. The focus of this study was on moderate concentrations of rounded squares, where the crystal structures observed in the simulations are imperfect crystal nuclei, similar to those observed in experiment.15,18 In this work, crystal structures were identified based on the distribution of the number of nearest neighbors and the distribution of angles formed by them.
Nearest neighbors were defined as pairs of particles with overlapping depletant-excluded areas. For the ensemble of configurations of particles at a given state point, a histogram of the number of neighbors for every particle in the system was obtained. The most common number of neighbors for a given state point, nnn, was then defined as the maximum in the histogram. Note that the number of nearest neighbors, nnn, for perfect square lattices depends on the depletant size, Rg and the roundness of the particle, d. If , then nnn = 8 for perfect square lattices; otherwise, nnn = 4. For both perfect hexagonal and rhombic crystal structures, nnn = 6. Therefore, if nnn ≤ 3, then the state point was assigned as a fluid. But if nnn > 3, information about the nearest neighbor angle histogram was required to distinguish between the lattices.
The nearest neighbor angle histogram was constructed using all particles in the ensemble of configurations for a given state point. For each particle, i, the bond angles were computed for pairs of nearest neighbors, j and k, where the angle was defined as ∠jik, and the sum of all bond angles for a particle was 2π. The histogram of all nearest neighbor angles for a given state point was then computed with a bin size of 0.005 radians. The global maximum in the angle histogram was identified as θnn. For a perfect hexagonal lattice, θnn = π/3. For a perfect square lattice, θnn = π/4 or π/2, depending on d and Rg, as noted above. Finally, the global maximum for a rhombic lattice falls in the range π/4 < θnn < π/2. The rhombic lattice also possesses a local maximum, θnn2 subject to the condition 2θnn+θnn2 = π or 2θnn2+θnn = π.
The crystal structure for a given state point was then identified based on the most common number of nearest neighbors, nnn, and the global maximum in nearest neighbor angle histogram, θnn. For the rhombic lattice, the local maximum, θnn2 ≠ θnn, was also considered. A state point was assigned as a fluid if nnn <= 3. Otherwise, if nnn > 3 and θnn = π/3, the state point was assigned as a hexagonal lattice. A state point was determined to be a square lattice if nnn > 3 and θnn = π/4 or π/2. Otherwise, if none of the above criteria were met, the state point was assigned as a rhombic lattice if π/4 < θnn < π/2 and 2θnn+θnn2 = π or 2θnn2+θnn = π, where the histogram intensity for θnn2 must be within 10 % of the global maximum. The angle comparisons were subject to a tolerance of 0.015 radians, to account for finite bin sizes in the angle distributions and for statistical error. The tolerance was increased by a factor of 3 for the rhombic angle comparison which involved the sum of 3 angular terms. Finally, the tolerance of the angle comparison for the hexagonal lattice was set to 0.05 radians, due to the difficulty in identifying the transition between hexagonal and rhombic structures, which stems from the spread in the angle histogram (See Appendix C). In order to establish a measure of uncertainty for the identification of crystal lattices, 12 independent simulations were performed. For a given state point, if the dominant crystal lattice for all 12 independent simulations did not match, or if a crystal lattice did not match any of the above criteria, then the state point was of indeterminate structure.
Boundaries between structures were also identified thermodynamically, based on the fluctuations in the potential energy. Fluctuations in potential energy are related to heat capacity, and structural transitions have been identified by peaks in the heat capacity.52 Therefore, the maximal fluctuations in the potential energy were identified as structural transitions, and are shown to be consistent with the structural metrics described above. Error bars for boundaries were obtained from 12 independent simulations, and were dependent on the discretization of the state points. This transition definition was predominantly utilized for fluid to crystal transitions. Structural identification based on bond orientation parameters53 were also performed (Appendix C), and these results were consistent with those based on nnn and θnn.
IV. RESULTS
Rounded squares in depletant were simulated using Wang-Landau (WL) sampling in two different ensembles to study the stability of crystal and fluid states as a function of roundness, d/D, depletant concentration, ϕ and particle concentration, ρD2. In the absence of depletant, the fluid state is favored in the moderate density range of interest in this study. When depletant is added to the solution, rounded squares self-assemble into square, hexagonal and rhombic lattices, as shown in Figure 4.
FIG. 4.

Example lattices observed in the simulations include the following: square lattice for d/D = 0.05, ϕ = 1.3 and Rg/D = 0.04 (a), rhombic lattice, Λ1, for d/D = 0.2, ϕ = 1.8 and Rg/D = 0.08 (b) and hexagonal lattice for d/D = 0.4, ϕ = 1.3 and Rg/D = 0.04 (c). l/D = 12 and ρD2 = 0.5.
In order to approximate the magnitude of the neglected many-body effects, we consider the largest conceivable contribution from the many-body interaction. This worst-case scenario corresponds to the case of a perfect square lattice where d = 0. In this situation, the corners of four particles come together to include three- and four-body interactions. The pair-wise excluded area overlap, ΔAp, is an overestimation of the true excluded area overlap, ΔA. In the square lattice case with perfect squares, d = 0, the percent difference, is 5% and 10% for Rg/D = 0.04 and 0.08, respectively. In addition, the many-body contribution to the potential energy in the square lattice vanishes as the roundness, d, increases to a value of or roughly d/D = 0.1 and 0.2 for Rg/D = 0.04 and 0.08, respectively. For a perfect hexagonal lattice, many-body effects do not occur for values of the depletant size of .
In Figure 5, we plot the radial distribution functions54 for particles of different values of roundness at the same number density when no depletant is present. The curves approximately collapse and possess similar hydration shell distances. Note that this collapse depends upon the chosen distance scale, D in this work. An alternative scaling would be the radius of the minimal circle needed to enclose the rounded square.19 When the depletant concentration is increased, the particles crystallize. For example, in Figure 6, we show that the radial distribution function for a square (d = 0) becomes more ordered when the depletant concentration, ϕ, increases.
FIG. 5.
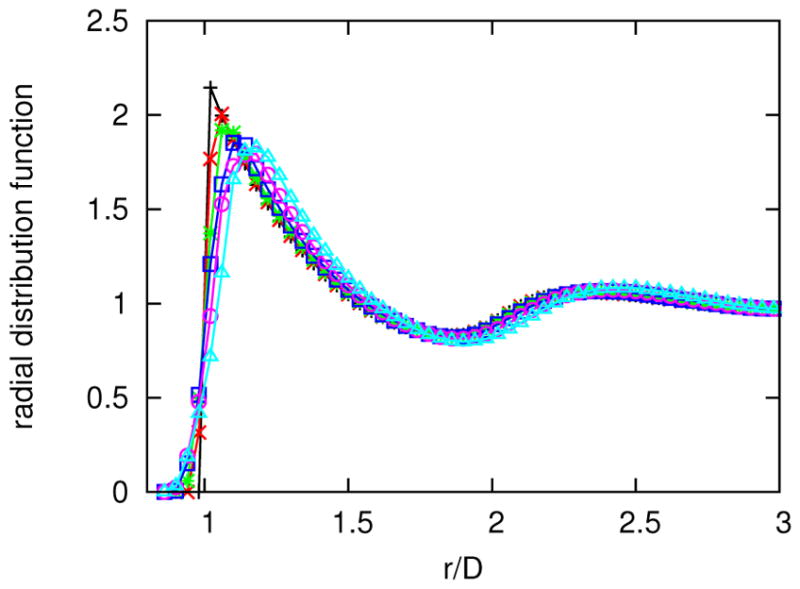
Radial distribution functions with respect to center-of-mass separation distance, r, from a SEE simulation with no depletant (ϕ = 0), l/D = 12, ρD2 = 0.5, Rg/D = 0.04 and the following values of roundness: d = 0 (light blue triangle), d/D = 0.1 (magenta circle), d/D = 0.2 (dark blue square), d/D = 0.3 (green star), d/D = 0.4 (red x) and d/D = 0.5 (black +). Lines are guides to the eye.
FIG. 6.

Radial distribution functions with respect to center-of-mass separation distance, r, for squares (d = 0), l/D = 12, ρD2 = 0.5, Rg/D = 0.04 and the following depletant concentrations: ϕ = 0 (black +), ϕ = 0.1 (red x), ϕ = 0.2 (green star), ϕ = 0.3 (dark blue square), ϕ = 0.4 (magenta circle) and ϕ = 0.5 (light blue triangle). Lines are guides to the eye.
The transition from the fluid phase to a crystal nucleus may be located thermodynamically by examining the potential energy as a function of depletant concentration, which is shown in Figure 7. At low depletant concentrations, the rounded squares in the fluid phase infrequently have overlapping excluded areas, and the potential energy is relatively small. But as crystal nuclei form when the depletant concentration increases, the potential energy decreases dramatically. As discussed in Section III C, the fluctuation in the potential energy with respect to ϕ is analogous to the heat capacity. Therefore, the transition between fluid and crystal was defined as the maximum fluctuation in the potential energy, corresponding to a peak in the heat capacity. We find that the depletion concentration at which the transition occurs changes non-monotonically as d increases. In addition, the potential energy changes non-monotonically as a function of d, except for the higher values of ϕ that were studied (e.g., ϕ ≈ 1.3), where a plateau occurs in the region of the pseudo phase diagram where the hexagonal lattice is most stable.
FIG. 7.

Fluctuations in the potential energy as a function of depletant concentration, ϕ, with l/D = 12, ρD2 = 0.5, Rg/D = 0.04 and the following values of roundness: d = 0 (light blue triangle), d/D = 0.1 (magenta circle), d/D = 0.2 (dark blue square), d/D = 0.3 (green star), d/D = 0.4 (red x) and d/D = 0.5 (black +). The inset shows the potential energy per particle. Lines are guides to the eye. Error bars are standard deviations.
Crystal lattices were also identified by structural metrics (See Section III C). In Figure 8, we show angle distributions for the rhombic and square lattice. For the d/D = 0.1 case, the peaks at 48.5° and 83° correspond to a rhombic lattice, while the peaks at 45° and 90° correspond to a square lattice. Because the peak corresponding to the rhombic lattice is the global maximum, the rhombic lattice is taken to be the dominant phase under these conditions. Note that both peaks at 45° and 90° were observed for the square lattice because d/D = 0.1 is near , where the square lattice values of nnn change from 8 to 4. When d/D was increased to 0.125, the peak at 90° becomes the global maximum and the square lattice is stable. Other examples of transitions as a function of shape between square and hexagonal lattices, and rhombic and hexagonal lattices, are provided in Appendix C.
FIG. 8.
Angle histograms for ϕ = 1.3, Rg/D = 0.04, l/D = 12, ρD2 = 0.5 and the following values of roundness: d/D = 0.1 (black +) and d/D = 0.125 (red x). Lines are guides to the eye.
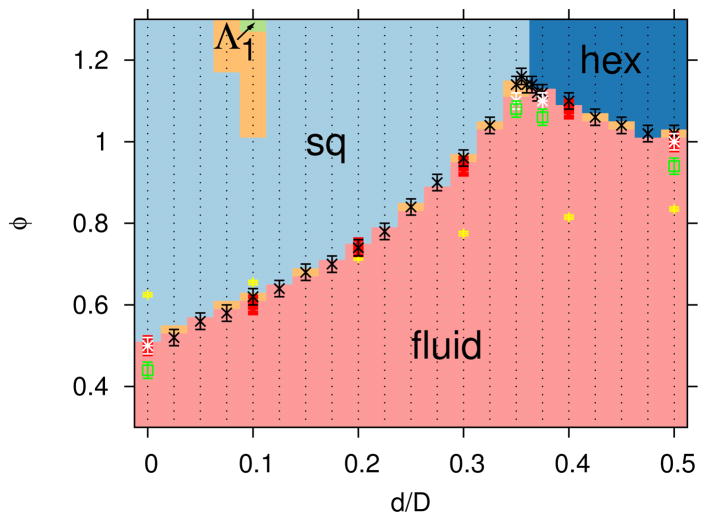
The most dominant lattice structure for a range of values of roundness, d, and depletant concentrations, ϕ, are shown in Figure 9. The fluid-to-crystal transition line is a non-monotonic function of d. This is likely due to frustration between the hexagonal and square lattices at intermediate d. The rhombic lattice was rarely observed to be the dominant lattice structure for Rg/D = 0.04 in the range of ϕ shown. However, under conditions where the rhombic lattice was observed to be stable (ϕ = 1.28 and 1.3 for d/D = 0.1 and Rg/D = 0.04), the equilibrium angles of the lattice were found to be 48.5° and 83°, which are close to those of the square lattice. Thus, the rhombic lattice in this case is only subtly different from the square lattice, which is reflected by the indeterminate regions in the phase diagram shown as the light orange color in Figure 9. Nonetheless, it is interesting to see that for ϕ >= 1.28, there exists an intervening region of rhombic stability within a region of square stability. That is, the stable lattice changes from square to rhombic and then back to square as the roundness increases in this range of depletant concentration. While this is non-intuitive, the stability of the rhombic lattice in this small region of the ϕ-d diagram was indeed confirmed by twelve independent simulations at these state points. While it might be argued that this unusual behavior is a consequence of neglecting many-body effects in our model, we point out that this is taking place in a region of the phase diagram where many-body effects are minimal. Also note that the transition from a square lattice to a rhombic lattice and then to a square lattice as d increased was accompanied by a monotonic change in potential energy, or depletant excluded area overlap, in contrast to the square to hexagonal transition with increasing d, which was accompanied by a non-monotonic change in potential energy (see Figure 7). Further investigation using a more sophisticated method as presented in Ref. 40 may shed light on this interesting behavior. As noted, experimental investigation might be difficult due to the subtle structural difference between the rhombic and square lattice in this case. The effects of both system size, l and particle concentration, ρ were also investigated. For cases where l was increased at fixed ρ, the fluid to crystal transitions were within statistical error, as shown in Figure 9. The fluid-to-crystal transition was located at lower ϕ when ρ was increased from ρD2 = 0.5 to 0.7, which is consistent with physical intuition. In addition, the fluctuating box simulation results are consistent with the fixed box simulations, which verifies that there is no bias in the crystal formation due to constraints on the shape of the simulation domain.
FIG. 9.
Dominant lattice structures for a given roundness, d, depletant concentration, ϕ, l/D = 12, ρD2 = 0.5 and Rg/D = 0.04 include the following: fluid (light red), square lattice (”sq”, light blue), hexagonal lattice (”hex”, dark blue), rhombic lattice (“Λ1”, light green) and indeterminate (light orange). The colors represent the results from the crystal structure identification algorithm described in Section III C, with discretization, shown by small black points, based on a series of independent DEE simulations. The transition definition based on potential energy fluctuations is shown with symbols and error bars (see Section IIIC for definition of error bars) for the following cases: l/D = 12, ρD2 = 0.5 (black x), l/D = 16, ρD2 = 0.5 (white star) l/D = 12, ρD2 = 0.7 (green open square) and fluctuating box simulations with l/D = 12, ρD2 = 0.5 (red solid square). The theta solvent condition, B22(ϕθ) = 0, is shown by the yellow + symbol.
The theta solvent condition, defined as the depletant concentration at which the second osmotic virial coefficient vanishes, B22(ϕθ) = 0, is shown in Figure 9. Note that for ϕ < ϕθ, B22(ϕ) > 0. We find that ϕθ increases with increasing d, which implies that the ratio of repulsive to attractive interactions increase with d, as evidenced by Figure 3. The second osmotic virial coefficient has been used as a predictor for crystallization,55 yet in some cases for non-spherical particles, crystal lattices form when ϕ < ϕθ and B22(ϕ) > 0.
The most dominant lattice structures for the larger depletant size, Rg/D = 0.08 are shown in Figure 10. With the larger depletant, the stable region of ϕ-d space for the rhombic lattice separates the square and hexagonal lattices, and the rhombic lattice region borders the fluid phase. As shown in Figure 11, the rhombic lattice smoothly varies between square-like (i.e., θnn ≈ π/4) and hexagonal-like (i.e., θnn ≈ π/3), depending on the roundness, d. The rhombic lattice angle, θnn also depends on the depletant concentration, ϕ, where θnn changes by about 5° over the range of ϕ shown in Figure 11 for the d/D = 0.15 case. The boundaries of the rhombic lattice region possess the most uncertainty, as also observed in the Rg/D = 0.04 case, which is due to the difficulty in identifying a rhombic lattice with angles similar to those of the square or hexagonal lattices.
FIG. 10.
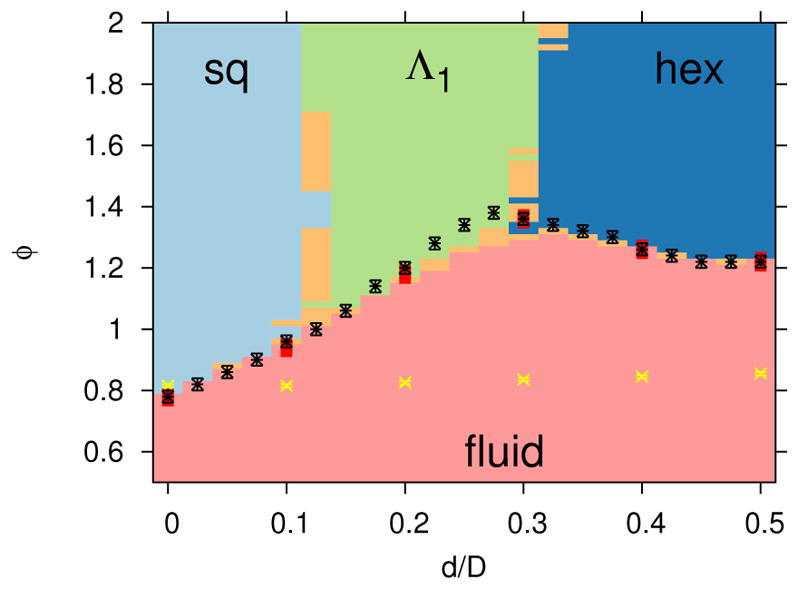
Dominate lattice structures, with the same colors and symbols as described in Figure 9, but with Rg/D = 0.08.
FIG. 11.
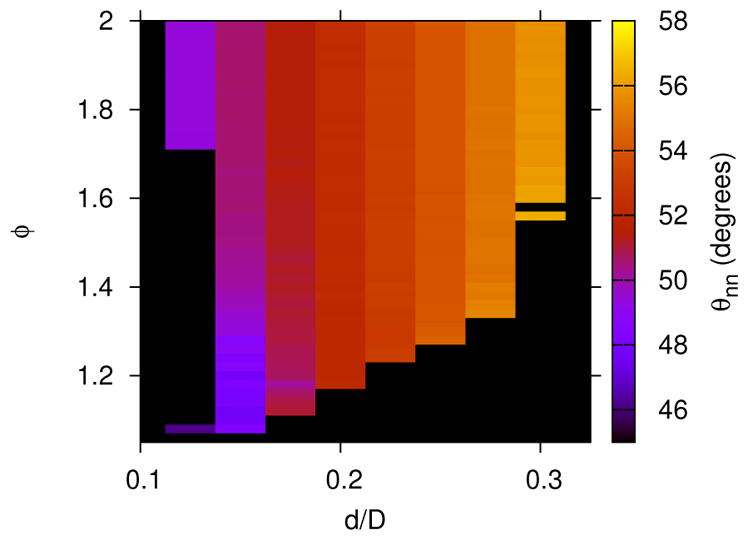
The average nearest neighbor angle, θnn, for rhombic crystal nuclei with Rg/D = 0.08, ρD2 = 0.5 and l/D = 12. The black shaded regions are non-rhombic lattices or fluid.
Shape expanded ensemble simulations employing Wang-Landau sampling were also performed to investigate the structural transitions that accompany changes in particle shape, at higher resolution than a series of depletant concentration expanded ensembles. Figure 12 shows the fluctuations in the potential energy as a function of roundness values ranging from the square to hexagonal lattice. As discussed in Section III C, the transition is defined by the maxima in the fluctuations in the potential energy. A shoulder in the fluctuations of the potential energy in Figure 12 vanishes at higher depletant concentrations. This shoulder suggests the proximity of a second thermodynamic transition, such as a transition from a square lattice to a fluid to a hexagonal lattice as the roundness increases. In addition, structural metrics were computed and found to be consistent.
FIG. 12.
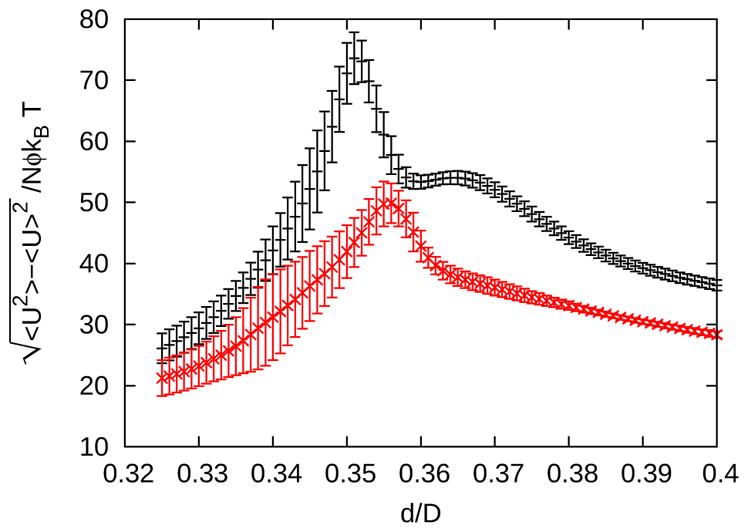
Fluctuations in the potential energy near the triple point for l/D = 12, ρD2 = 0.5 and Rg/D = 0.04 from shape expanded ensemble (SEE) simulations with ϕ = 1.15 (black +) and ϕ = 1.2 (red x). Error bars are the standard deviations of the averages from twelve independent simulations.
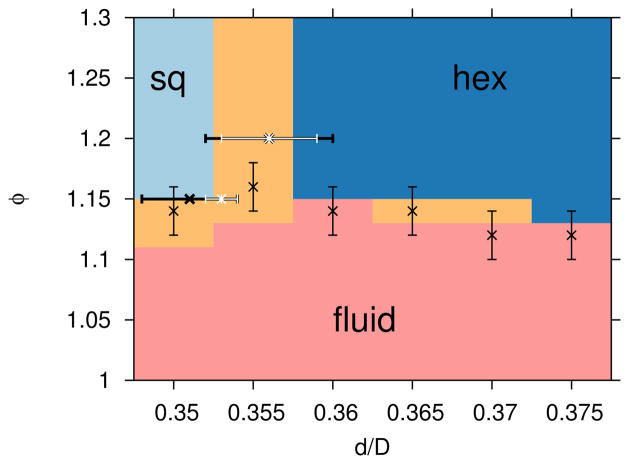
The dominant lattice structures in the immediate vicinity of the triple point for depletant size Rg/D = 0.04 are shown in 13. A combination of DEE and SEE WL simulations were utilized, which sample well the lattice-fluid transition in ϕ and the lattice-lattice transition in d, respectively. As shown in Figure 13, the potential energy based and structural based transition definitions are consistent.
FIG. 13.
Crystal nuclei structures, with the same colors and symbols as described in Figure 9, but focused on the region of the triple point. The colors and vertical error bars (see Section IIIC for error bar definition) are from DEE simulations, while the horizontal error bars are from SEE simulations. The thick, black, horizontal error bars show the thermodynamically defined transition between square and hexagonal lattices from SEE simulations, while the white error bars show the structurally defined transition.
V. CONCLUSION
Wang-Landau simulations with specialized Monte Carlo moves were used to construct pseudo phase diagrams for a family of shapes that smoothly varies from squares to circles. The implicit depletant model allowed for a systematic investigation of the stability of crystallites and the fluid state as a function of the depletant concentration and depletant size. For example, a square lattice was observed to change to a rhombic lattice upon increasing the size of the depletant. In addition, the depletant concentration at which there is a transition from a crystallite to a fluid state changes non-monotonically with shape. Transitions between rhombic, square, and hexagonal lattices were also observed upon changing the shape. These results may help guide experiments with the recently synthesized cubic colloids in a solution of depletant molecules.15,18
Care must be taken in comparing the 2D model system to the 3D experimental cubic colloids sedimented on a surface. In particular, the excluded volume overlap in 3D is different from the excluded area overlap in 2D. Quantitative comparison between our results and the experimental cubic colloids would require a correction for this difference. In order to improve comparison with experiment in future work, the three-dimensional shape may be utilized to compute the excluded volume overlap between particles. Assuming that the colloids do not rotate out-of-plane with the surface, and the colloids do not stack in the direction perpendicular to the surface, then the excluded volume overlap of fully sedimented 3D particles may be described with a 2D table. Otherwise, the dimension of the lookup tables would be significantly increased.
Future work may also include a more systematic study of the concentration of the colloidal particles, and more depletant sizes. In this work, the focus was on moderate concentrations, where most results were for a fixed concentration of ρD2 = 0.5. The effect of concentration may be investigated with grand canonical ensemble simulations, and depletant size may be chosen as the order parameter in an expanded ensemble simulation. Future work may include bulk simulation of the crystal lattices with fluctuating periodic boundary conditions.50 Finally, future studies may include the many-body terms in the depletant interaction.38–40
Acknowledgments
H.W.H. acknowledges support from a National Research Council postdoctoral research associateship at the National Institute of Standards and Technology.
Appendix A: Second Osmotic Virial Coefficient
The second osmotic virial coefficient, B22, was calculated by Monte Carlo integration.
| (A1) |
| (A2) |
where ri is the relative position and orientation of a second particle with respect to the first particle, and i = 1, ...,Ntrial randomly chosen positions and orientations of a second particle with respect to the first, and A is the area which encompasses all relative positions with non-zero interaction energy. In practice, A was chosen such that A1/2 is greater than . Convergence was reached when |B22|/σblock < 10−2 or σblock < 10−2, where σblock is the standard deviation obtained from a series of block averages of size Ntrial = 109.
Appendix B: Tabular Potential
Precomputing the potential greatly sped up the simulations. Although the potential may be stored in one large table, the efficiency was improved with an additional, smaller table. The smaller table was used to determine if two particles overlapped, r < rh, or if two particles were too far to interact, r > rc, where rc is the minimum value of r for which U(r; d, θi, θj) = 0. This approach reduced the frequency that the larger table was required, and also allowed rescaling of the separation distance in order to improve resolution.
For a given orientation, θi and θj, between two particles of roundness d, we first tabulated the hard contact distance, rh(d, θi, θj ), and the cut-off distance, rc(d, θi, θj ). Once rh and rc were obtained, the excluded area overlap need only be computed if rh ≤ r ≤ rc. For convenience, the scaled distance between these two limits was defined as , such that z ∈ [0, 1] for rh ≤ r ≤ rc. The attractive potential, Udep(d, θi, θj, z), was then tabulated for a range of discrete z values. This procedure was repeated for many different θi, θj and d. In tabulating θi and θj, one may make use of the periodicity of π/2 and the symmetry operations (θi, θj) = (θj, θi) and (θi, θj) = (−θi,−θj ), such that θi ∈ [0, π/4] and θj ∈ [−π/4, π/4]. The Python library Shapely56 was used to compute the overlap areas, and rh and rc were computed by minimization with the Brent method using a tolerance of 10−8. Unless specified otherwise, 101 elements were used for d, 76 elements were used for θi, 151 were used for θj, and 51 were used for z. Below, we show that a sufficient number of table elements was indeed chosen. Also note that this number of table elements was used to generate the pixels for Figure 3. The tables were bi-, tri-, or quadri-linearly interpolated.
To efficiently determine the interaction between two particles during a simulation, one may identify cases where no table interpolation is necessary, or cases where only an interpolation of the small table was required instead of the large table. Regardless of particle orientations, the particles overlapped if the separation distance, r < L/2 + d. In addition, there is no interaction if . After checking for these conditions, the orientation-dependent overlap distance, rh and cut-off distance, rc was interpolated from the smaller table. Thus, an interpolation of the full table was only required if rh < r < rc. If the roundness of the square, d, coincided with a table element, then no interpolation in d was performed. The efficiency of this approach was confirmed by profiling the simulation program to find that more computer time was spent interpolating the small table rather than the large table, for moderate densities with a cell list and neighbor list.
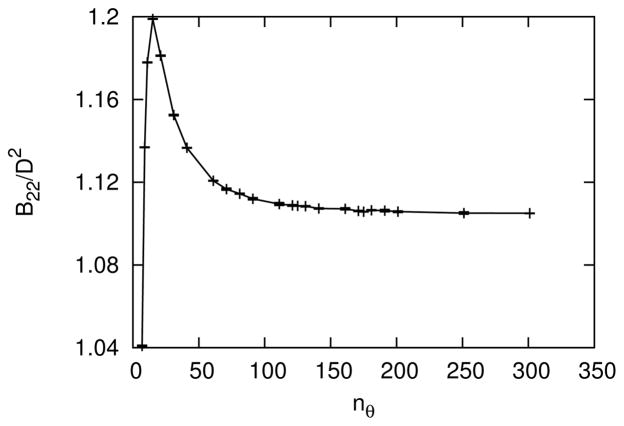
The convergence of the tabular potential was tested using the second osmotic virial coefficient, B22. The B22 was chosen for three reasons. First, the convergence of the B22 is a convenient test of the potential because it is a measure of the spatially- and orientationally-dependent integral average of the pair-wise potential. Second, if the B22 of the model is well-defined, then extended corresponding-states may be applied to short-range models to directly compare phase behavior between different models and experiment.42,43,57 Third, comparison of the B22 for many different tabular potentials is more computationally efficient than comparing between a large set of WL simulations.
The size of the table is determined by the following four dimensions: the number of each of the two relative orientations, nθ, the number of scaled separation distances, nz, and the number of values of roundness, nd. See Section III for more details on the definition of the tabular potential. The values of nθ, nz and nd for convergence of the B22 were obtained sequentially as follows. To begin, the convergence of nθ was tested for the most anisotropic case, d = 0, and relatively high depletant concentration, ϕ = 0.5. During this convergence test for nθ, nz = 51, which was assumed to be larger than necessary, and later verified. As shown in Figure 14, the B22 was sufficiently converged at nθ = 151 (or nθ = 76 after utilizing symmetry for one angle). Next, the convergence of nz was tested for d = 0, ϕ = 0.5 and nθ = 151. As shown in Figure 15, the B22 was sufficiently converged at nz = 26. Finally, the convergence of nd was tested for d/D = 0.001, ϕ = 0.5, nθ = 151 and nz = 26. The roundness d/D = 0.001 was selected near d = 0, such that d/D was not too small to resolve interpolation differences within statistical error. For d/D = 0.001, the largest meaningful value of nd was 501, because nd = 501 possessed a table element precisely at d/D = 0.001. The value of d/D = 0.001 was also chosen to not be too big, such that convergence occurred sufficiently far away the largest possible value of nd. As shown in Figure 16, the B22 was sufficiently converged at nd = 101.
FIG. 14.
The second osmotic virial coefficient as a function of the number of orientations in the table, nθ, for d = 0, ϕ = 0.5 and nz = 51. Error bars are standard deviations from block averages.
FIG. 15.
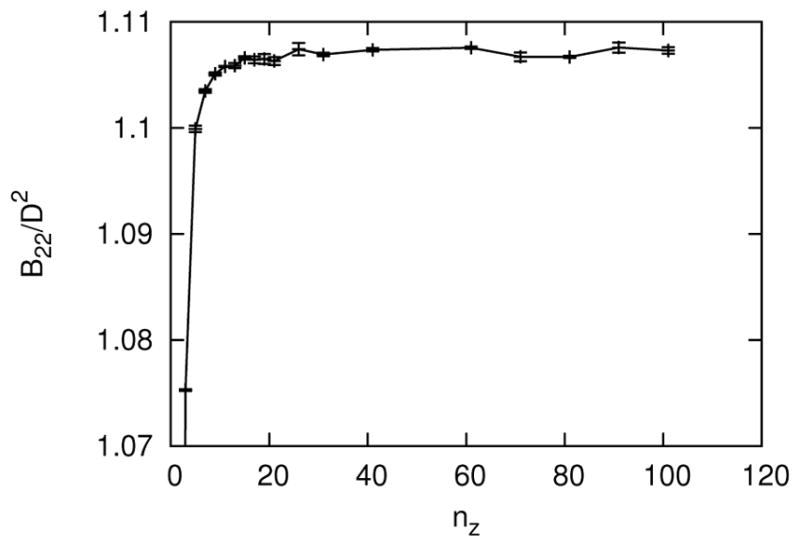
The second osmotic virial coefficient as a function of the number of separation distances in the table, nz, for d = 0, ϕ = 0.5 and nθ = 151. Error bars are standard deviations from block averages.
FIG. 16.
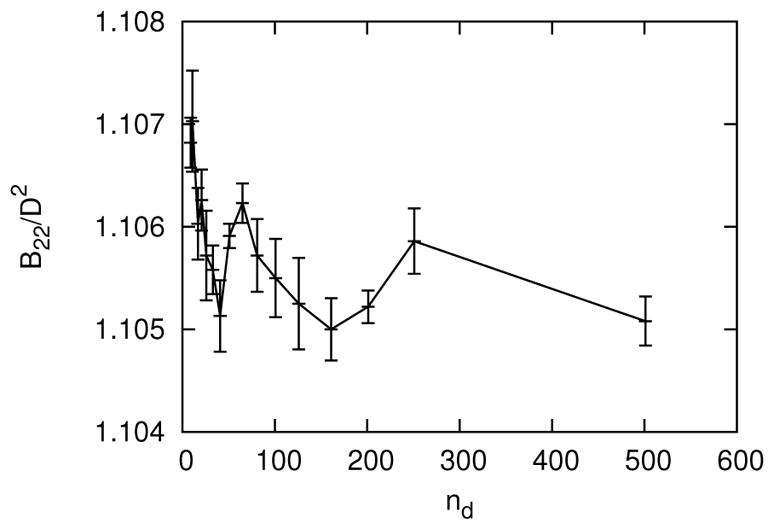
The second osmotic virial coefficient as a function of the number of values of roundness in the table, nd, for d/D = 0.001, ϕ = 0.5, nz = 26 and nθ = 151. Error bars are standard deviations from block averages.
Appendix C: Identifying Crystals by Nearest Neighbor Angle Histograms and a Bond Orientational Order Parameter
In this appendix, examples of structural identification of square, rhombic and hexagonal lattices are provided. As described in Section III C, the lattices were identified based on the histogram of angles formed by pairs of nearest neighbors of particles. A transition between a square and hexagonal lattice is observed in Figure 17. For d/D = 0.35, the global maxima in the angle distribution is located at 90°, which corresponds to a square lattice. Note that there is also a minority population of rhombic lattice at 55° and 62.5°. When the roundness is increased to d/D = 0.375, the square lattice peak is replaced by a peak at 60°, corresponding to a hexagonal lattice. Note that the global maxima is located at 62.5°. This is likely due to a combination of a minority population of rhombic lattice, as observed at d/D = 0.35, and the spread in the angle distribution for the majority population of hexagonal lattice at 60°. The angle tolerance for hexagonal lattices accounted for the spread in the distribution for the crystal identification algorithm described in Section III C. Otherwise, with a global maxima at 62.5°, the identification algorithm would assign the histogram for d/D = 0.375 as a rhombic lattice.
FIG. 17.

Angle histograms for ϕ = 1.3, Rg/D = 0.04, l/D = 12, ρD2 = 0.5 and the following values of roundness: d/D = 0.35 (black +) and d/D = 0.375 (red x). Lines are guides to the eye.
Figure 18 shows the probability distributions of the nearest neighbor bond angles, θnn, for a variety of particle shapes at high depletant concentration. For low values of d, the peak at 45° denotes that the square lattice is most stable. As d increases, the rhombic lattice becomes dominant, and is finally replaced by the hexagonal lattice. While the d/D = 0.3 case is clearly rhombic, and the d/D = 0.35 case is clearly hexagonal, the d/D = 0.325 case is near the boundary, where it is difficult to distinguish a hexagonal lattice from a rhombic lattice with angles near 60°.
FIG. 18.

Angle histograms for ϕ = 2, Rg/D = 0.08, l/D = 12, ρD2 = 0.5. The values of roundness, d/D, are in the range of [0.05, 0.45] in intervals of 0.05, with an additional value of d/D = 0.325.
A bond orientational order parameter, Ql,53,58,59 was computed as an alternative to the angle histograms described above. Ql is given by
| (C1) |
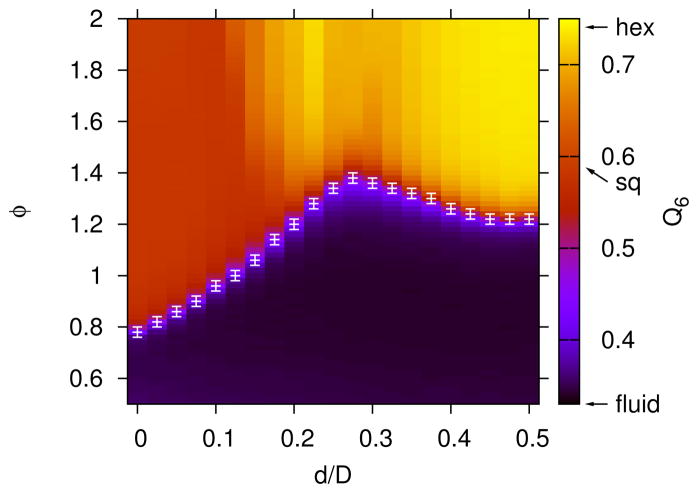
where 〈…〉 denotes an average over all nearest neighbors, r̂ij is the unit vector connecting nearest neighbors, nearest neighbors were defined by a center to center separation distance less than 1.1D, and Qlm are the spherical harmonics. The average bond orientational order parameter, Q6, for l = 6, is shown in Figure 19 for many state points, and is consistent with Figure 10.
FIG. 19.
The average global bond orientational order parameter for Rg/D = 0.08, l/D = 12, and ρD2 = 0.5. The white symbols and error bars are the same thermodynamically-defined transition shown in Figure 10. The labels on the color bar are also the same as described in Figure 10.
References
- 1.Chaikin PM, Lubensky TC. Principles of condensed matter physics. Cambridge University Press; Cambridge; New York, NY, USA: 1995. [Google Scholar]
- 2.Whitesides GM, Grzybowski B. Science. 2002;295:2418. doi: 10.1126/science.1070821. [DOI] [PubMed] [Google Scholar]
- 3.Haji-Akbari A, Engel M, Keys AS, Zheng X, Petschek RG, Palffy-Muhoray P, Glotzer SC. Nature. 2009;462:773. doi: 10.1038/nature08641. [DOI] [PubMed] [Google Scholar]
- 4.Torquato S. Random Heterogeneous Materials. In: Antman SS, Sirovich L, Marsden JE, Wiggins S, editors. Interdisciplinary Applied Mathematics. Vol. 16. Springer; New York, New York, NY: 2002. [Google Scholar]
- 5.Hales TC. Discrete Comput Geom. 2006;36:5. [Google Scholar]
- 6.Sacanna S, Pine DJ, Yi GR. Soft Matter. 2013;9:8096. [Google Scholar]
- 7.Palacci J, Sacanna S, Steinberg AP, Pine DJ, Chaikin PM. Science. 2013;339:936. doi: 10.1126/science.1230020. [DOI] [PubMed] [Google Scholar]
- 8.Cademartiri L, Bishop KJM, Snyder PW, Ozin GA. Philos Trans R Soc London, Ser A. 2012;370:2824. doi: 10.1098/rsta.2011.0254. [DOI] [PubMed] [Google Scholar]
- 9.Glotzer SC, Solomon MJ. Nature Materials. 2007;6:557. doi: 10.1038/nmat1949. [DOI] [PubMed] [Google Scholar]
- 10.Fejer SN, Chakrabarti D, Wales DJ. Soft Matter. 2011;7:3553. [Google Scholar]
- 11.Chen Q, Bae SC, Granick S. Nature. 2011;469:381. doi: 10.1038/nature09713. [DOI] [PubMed] [Google Scholar]
- 12.Swol Fv, Woodcock LV. Mol Simulat. 1987;1:95. [Google Scholar]
- 13.Hoover WG, Hoover CG, Bannerman MN. J Stat Phys. 2009;136:715. [Google Scholar]
- 14.Marechal M, Zimmermann U, Lwen H. J Chem Phys. 2012;136:144506. doi: 10.1063/1.3699086. [DOI] [PubMed] [Google Scholar]
- 15.Rossi L, Sacanna S, Irvine WTM, Chaikin PM, Pine DJ, Philipse AP. Soft Matter. 2011;7:4139. [Google Scholar]
- 16.Meijer JM, Hagemans F, Rossi L, Byelov DV, Castillo SI, Snigirev A, Snigireva I, Philipse AP, Petukhov AV. Langmuir. 2012;28:7631. doi: 10.1021/la3007052. [DOI] [PubMed] [Google Scholar]
- 17.Meijer JM, Byelov DV, Rossi L, Snigirev A, Snigireva I, Philipse AP, Petukhov AV. Soft Matter. 2013;9:10729. [Google Scholar]
- 18.Rossi L, Soni V, Ashton DJ, Pine DJ, Philipse AP, Chaikin PM, Dijkstra M, Sacanna S, Irvine WTM. Proc Natl Acad Sci USA. 2015;112:5286. doi: 10.1073/pnas.1415467112. [DOI] [PMC free article] [PubMed] [Google Scholar]
- 19.Royer JR, Burton GL, Blair DL, Hudson SD. Soft Matter. 2015;11:5656. doi: 10.1039/c5sm00729a. [DOI] [PubMed] [Google Scholar]
- 20.Jagla EA. Phys Rev E. 1998;58:4701. [Google Scholar]
- 21.Agarwal U, Escobedo FA. Nature Materials. 2011;10:230. doi: 10.1038/nmat2959. [DOI] [PubMed] [Google Scholar]
- 22.Damasceno PF, Engel M, Glotzer SC. ACS Nano. 2012;6:609. doi: 10.1021/nn204012y. [DOI] [PubMed] [Google Scholar]
- 23.Smallenburg F, Filion L, Marechal M, Dijkstra M. Proc Natl Acad Sci USA. 2012;109:17886. doi: 10.1073/pnas.1211784109. [DOI] [PMC free article] [PubMed] [Google Scholar]
- 24.Damasceno PF, Engel M, Glotzer SC. Science. 2012;337:453. doi: 10.1126/science.1220869. [DOI] [PubMed] [Google Scholar]
- 25.Thapar V, Escobedo FA. J Chem Phys. 2014;141:124117. doi: 10.1063/1.4896054. [DOI] [PubMed] [Google Scholar]
- 26.Anders Gv, Klotsa D, Ahmed NK, Engel M, Glotzer SC. Proc Natl Acad Sci USA. 2014;111:E4812. doi: 10.1073/pnas.1418159111. [DOI] [PMC free article] [PubMed] [Google Scholar]
- 27.Gantapara AP, de Graaf J, van Roij R, Dijkstra M. Phys Rev Lett. 2013;111:015501. doi: 10.1103/PhysRevLett.111.015501. [DOI] [PubMed] [Google Scholar]
- 28.Gantapara AP, Graaf Jd, Roij Rv, Dijkstra M. J Chem Phys. 2015;142:054904. doi: 10.1063/1.4906753. [DOI] [PubMed] [Google Scholar]
- 29.Jiao Y, Stillinger FH, Torquato S. Phys Rev E. 2009;79:041309. doi: 10.1103/PhysRevE.79.041309. [DOI] [PubMed] [Google Scholar]
- 30.Batten RD, Stillinger FH, Torquato S. Phys Rev E. 2010;81:061105. doi: 10.1103/PhysRevE.81.061105. [DOI] [PubMed] [Google Scholar]
- 31.Ni R, Gantapara AP, Graaf Jd, Roij Rv, Dijkstra M. Soft Matter. 2012;8:8826. [Google Scholar]
- 32.Audus DJ, Hassan AM, Garboczi EJ, Douglas JF. Soft Matter. 2015;11:3360. doi: 10.1039/c4sm02869d. [DOI] [PMC free article] [PubMed] [Google Scholar]
- 33.Jiao Y, Stillinger FH, Torquato S. Phys Rev Lett. 2008;100:245504. doi: 10.1103/PhysRevLett.100.245504. [DOI] [PubMed] [Google Scholar]
- 34.Avendao C, Escobedo FA. Soft Matter. 2012;8:4675. [Google Scholar]
- 35.Carmichael SP, Shell MS. J Chem Phys. 2013;139:164705. doi: 10.1063/1.4826466. [DOI] [PubMed] [Google Scholar]
- 36.Erdogan ST, Martys NS, Ferraris CF, Fowler DW. Cement and Concrete Composites. 2008;30:393. [Google Scholar]
- 37.Asakura S, Oosawa F. J Chem Phys. 1954;22:1255. [Google Scholar]
- 38.Frenkel D. Physica A. 2002;313:1. [Google Scholar]
- 39.Dijkstra M, van Roij R, Roth R, Fortini A. Phys Rev E. 2006;73:041404. doi: 10.1103/PhysRevE.73.041404. [DOI] [PubMed] [Google Scholar]
- 40.Glaser J, Karas AS, Glotzer SC. J Chem Phys. 2015;143:184110. doi: 10.1063/1.4935175. [DOI] [PubMed] [Google Scholar]
- 41.Verwey EJW, Overbeek JTG. Theory of the Stability of Lyophobic Colloids: The Interaction of Sol Particles Having an Electric Double Layer. Elsevier Publishing Company; 1948. [Google Scholar]
- 42.Noro MG, Frenkel D. J Chem Phys. 2000;113:2941. [Google Scholar]
- 43.Hatch HW, Yang S-Y, Mittal J, Shen VK. Soft Matter. 2016 doi: 10.1039/C6SM00473C. [DOI] [PMC free article] [PubMed] [Google Scholar]
- 44.Wang F, Landau DP. Phys Rev Lett. 2001;86:2050. doi: 10.1103/PhysRevLett.86.2050. [DOI] [PubMed] [Google Scholar]
- 45.Rane KS, Kumar V, Errington JR. J Chem Phys. 2011;135:234102. doi: 10.1063/1.3668137. [DOI] [PubMed] [Google Scholar]
- 46.Rane KS, Murali S, Errington JR. J Chem Theory Comput. 2013;9:2552. doi: 10.1021/ct400074p. [DOI] [PubMed] [Google Scholar]
- 47.Whitelam S, Geissler PL. J Chem Phys. 2007;127:154101. doi: 10.1063/1.2790421. [DOI] [PubMed] [Google Scholar]
- 48.Liu J, Luijten E. Phys Rev Lett. 2004;92:035504. doi: 10.1103/PhysRevLett.92.035504. [DOI] [PubMed] [Google Scholar]
- 49.Liu J, Luijten E. Phys Rev E. 2005;71:066701. doi: 10.1103/PhysRevE.71.066701. [DOI] [PubMed] [Google Scholar]
- 50.Filion L, Marechal M, van Oorschot B, Pelt D, Smallenburg F, Dijkstra M. Phys Rev Lett. 2009;103:188302. doi: 10.1103/PhysRevLett.103.188302. [DOI] [PubMed] [Google Scholar]
- 51.Shen VK, Siderius DW. J Chem Phys. 2014;140:244106. doi: 10.1063/1.4884124. [DOI] [PubMed] [Google Scholar]
- 52.Bhattacharya A, Mahanti SD. J Phys Condens Mat. 2001;13:L861. [Google Scholar]
- 53.Steinhardt PJ, Nelson DR, Ronchetti M. Phys Rev B. 1983;28:784. [Google Scholar]
- 54.Allen MP, Tildesley DJ. Computer simulation of liquids. Clarendon Press; 1989. pp. 156–157. [Google Scholar]
- 55.George A, Wilson WW. Acta Crystallogr D. 1994;50:361. doi: 10.1107/S0907444994001216. [DOI] [PubMed] [Google Scholar]
- 56.Gillies S, Bierbaum A, Lautaportti K, Tonnhofer O. Software: Toblerity/shapely. 2014 from http://github.com/toblerity/shapely.
- 57.Foffi G, Sciortino F. J Phys Chem B. 2007;111:9702. doi: 10.1021/jp074253r. [DOI] [PubMed] [Google Scholar]
- 58.Wolde PRt, Ruiz-Montero MJ, Frenkel D. J Chem Phys. 1996;104:9932. [Google Scholar]
- 59.Errington JR, Debenedetti PG, Torquato S. J Chem Phys. 2003;118:2256. [Google Scholar]


