

Summary
Enhancing repair of myelin is an important, but still elusive therapeutic goal in many neurological disorders1. In Multiple Sclerosis (MS), an inflammatory demyelinating disease, endogenous remyelination does occur but is frequently insufficient to restore function. Both parenchymal oligodendrocyte progenitor cells (OPCs) and endogenous adult neural stem cells (NSCs) resident within the subventricular zone (SVZ) are known sources of remyelinating cells2. Here, we characterize the contribution to remyelination of a subset of adult NSCs, identified by their expression of Gli1, a transcriptional effector of the Sonic Hedgehog (Shh) pathway. We show that these cells are recruited from the SVZ to populate demyelinated lesions in the forebrain but never enter healthy, white matter tracts. Unexpectedly, recruitment of this pool of NSCs, and their differentiation into oligodendrocytes, is significantly enhanced by genetic or pharmacological inhibition of Gli1. Importantly, complete inhibition of canonical hedgehog signaling was ineffective indicating that Gli1’s role in both augmenting hedgehog signaling and retarding myelination is specialized. Indeed, inhibition of Gli1 improves the functional outcome in a relapsing/remitting model of experimental autoimmune encephalomyelitis (RR-EAE) and is neuroprotective. Thus, endogenous NSCs can be mobilized for the repair of demyelinated lesions by inhibiting Gli1, identifying a new therapeutic avenue for the treatment of demyelinating disorders.
Remyelination in the adult human and mouse brains is carried out by two cell types: oligodendrocyte progenitor cells (OPCs) and neural stem cells (NSCs). OPCs, which are present in the parenchyma of healthy brain as well as in, and around MS lesions3, can be identified by their expression of the NG2 proteoglycan and platelet-derived growth factor receptor alpha (PDGFRα). They respond locally to demyelination by generating oligodendrocytes although do not migrate long distances during remyelination4,5. NSCs present in the subventricular zone (SVZ), express glial fibrillary acidic protein (GFAP) and Nestin, and are normally quiescent. In response to demyelination, cells in the adult SVZ can generate oligodendrocytes6, including, presumptively, in patients with MS7.
The signals that activate and recruit NSCs to lesion sites and promote their local differentiation into oligodendrocytes remain poorly understood. A candidate to regulate NSCs is Sonic hedgehog (Shh), an important morphogen during CNS development that is required for the generation of most oligodendrocytes during development8 and for the maintenance of stem cells in the adult SVZ9. Shh is therefore an attractive candidate to expand the pool of premyelinating cells available for repair. Indeed, Shh levels have been reported to increase in remyelinating lesions10.
Canonical Shh signaling is mediated by interactions of the hedgehog receptor patched (Ptc) with the G-protein coupled transmembrane co-receptor smoothened (Smo). Binding of Shh to Ptc relieves its inhibition of Smo and thereby activates the Gli family of zinc finger transcription factors11. Of the three Gli proteins, Gli1 is the only one whose transcription is driven by Shh-signaling and its expression is therefore considered a sensitive readout of sustained, high level activation of this pathway12,13.
In this study, we have examined remyelination by the Shh-responsive (i.e. Gli1+) pool of NSCs, which is concentrated in the ventral SVZ and comprises ~25% of NSCs14. To genetically fate-map Gli1+ NSCs, we crossed Gli1CreERT2/+ mice with the Rosa-CAG-EGFP (RCE) reporter15 to generate Gli1CE mice in which tamoxifen treatment results in permanent expression of cytoplasmic green fluorescent protein (GFP) in all Gli1-expressing cells and their progeny12,14; see supplementary table 1 for a summary of these and other mouse lines used in this study. GFP-labeled cells correspond to NSCs in the SVZ and a subset of astrocytes, but not OPCs or oligodendrocytes. We then followed the fate of these GFP+ cells after inducing demyelination in the mouse corpus callosum (CC) either by: i) dietary cuprizone16 or ii) direct, stereotactic injection of the detergent lysophosphatidyl-choline (LPC)4.
At 6 weeks of dietary cuprizone, corresponding to peak demyelination, GFP-expressing cells were recruited to areas of demyelination. In contrast, no labeled cells were observed in the CC of controls (Fig. 1a). At two weeks of remyelination, following removal of cuprizone from the diet, GFP-expressing cells in the CC (17.3 cells ± 2.6/section) differentiated exclusively into glia, primarily oligodendroglia, i.e. PDGFRα+ OPCs (9.8 ± 8.7%) and CC1+ oligodendrocytes (40.2 ± 15.1%), as well as GFAP-expressing astrocytes (15.5 ± 4.1%; Fig. 1b,c); other markers are shown in extended data 1a. ~30% of the GFP+ cells in the CC remained unspecified at this time. None of the GFP-labeled cells expressed neuronal (NeuN) or microglial (Iba1 and CD11b) markers; data not shown. 10 weeks after recovery from cuprizone diet, the numbers of GFP+ cells in the demyelinated CC increased from ~17 cells to ~48 cells per section and consisted of PDGFRα+ OPCs (18.4 ± 1.8%), CC1+ oligodendrocytes (58.3 ± 5.3%) and GFAP+ astrocytes (28.7 ± 11.6%) (Fig. 1c), accounting for all the GFP+ cells in the CC. These results suggest that Gli1+ NSCs continue to generate glial cells in the CC for a prolonged period following demyelination. In addition to the cells within the CC, GFP-labeled cells located outside of the CC frequently increased with demyelination; these correspond to a subset of protoplasmic astrocytes that are responsive to Shh17.
Figure 1. Gli1-expressing cells are recruited to and generate myelinating oligodendrocytes at sites of demyelination.
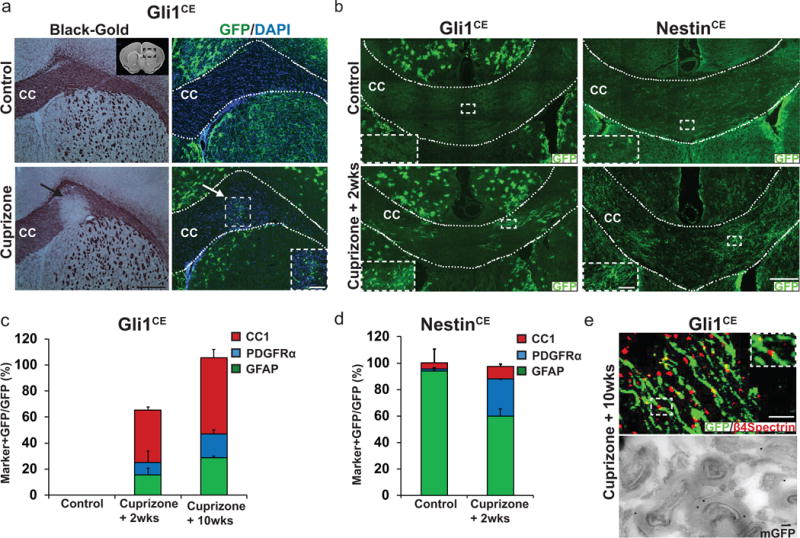
a, Serial sections from the brains of Gli1CE/+ mice on a control or cuprizone diet (at the peak of demyelination) were stained with Black-Gold myelin (left panels) or immunostained for GFP (right panels). The inset in the upper left panel shows a coronal section of the forebrain; the box highlights the area of CC analyzed. The black arrow in the lower left panel indicates a demyelinated region of the CC. Labeled cells in the CC are restricted to the site of demyelination (white arrow). n=5 mice/group, Scale bar, 100μm; inset, 40 μm. b, Comparison of Gli1CE/+ mice with NestinCE/+ mice shows GFP+ cells are present in the CC of NestinCE/+ mice but not of Gli1CE/+ mice on control diet (top panels). During recovery from cuprizone, GFP+ cells appear in the CC of Gli1CE/+ mice (bottom panels) and increase in the CC of NestinCE/+ mice. n=5 mice/group/genotype, Scale bars, 100 μm; inset, 40 μm. c,d Percentage of GFP+ oligodendrocyte progenitors (PDGFRα+), mature oligodendrocytes (CC1+), and astrocytes (GFAP+) in the CC of (c) Gli1CE/+ and (d) NestinCE/+ mice. n=5 mice/group/genotype e, 10 weeks after cessation of cuprizone, GFP-labeled processes flank nodes of Ranvier, demarcated by β4 spectrin (top). n=3 mice, Scale bar, 10 μm. Immunoelectron microscopy shows membrane-targeted GFP (mGFP), indicated by immunogold particles, present within compact myelin sheaths that surround axons (bottom). CC= corpus callosum, n=3 mice, Scale, 100 nm. Data are mean ± SEM.
The newly generated, NSC-derived oligodendrocytes remyelinated axons as evidenced by GFP-labeled processes that flanked nodes of Ranvier (Fig. 1e), overlapped with the paranodal marker Caspr (Extended data 1b), and co-expressed the myelin proteins MOG and MBP but not the Schwann cell myelin protein P0 (Extended data 1b). Immuno-electron microscopy of the CC in Gli1CreERT2/+ mice crossed to a membrane GFP reporter (Rosa-Tdtomato-mGFP) demonstrated GFP labeling in compact myelin sheaths surrounding axons (Fig. 1e), corroborating these NSCs form remyelinating oligodendrocytes.
For comparison, we also fate mapped the entire pool of NSCs, in healthy brains and following demyelination using a NestinCE/+ driver line that preferentially labels the SVZ18 (Fig. 1b). We also observed GFP+ cells outside of the SVZ, including some cells within the healthy CC (Fig. 1b). The cells present in the healthy CC were largely astrocytes (93.81 ± 3.34%); a small proportion were OPCs (1.81 ± 1.57%) and oligodendrocytes (4.42 ± 0.29%) (Fig. 1b,d). Two weeks after recovery from cuprizone, there was a striking increase in the numbers of labeled cells in the CC, consistent with a recent report2, associated with an increase in the percentages of OPCs (28.49 ± 18.52%) and oligodendrocytes (9.35 ± 3.25%) and a commensurate reduction in the proportion of astrocytes (59.72 ± 9.54%) (Fig. 1b,d). These results do not distinguish whether the oligodendrocytes present in the CC during remyelination were generated primarily from NSCs, from pre-existing precursors within the CC, or both. They underscore that in contrast to the broader Nestin+ pool of NSCs, Gli1 demarcates a distinct set of NSCs in the SVZ that are recruited only upon demyelination and preferentially fate to oligodendroglia.
To assess whether cells that enter demyelinated lesions in the CC were actively responding to Shh, we analyzed Gli1 expression using Gli1nLacZ mice, which express nuclear LacZ from the Gli1 locus19. In healthy brains, Gli1 was expressed by cells in the cortex, basal forebrain, and ventral SVZ (Extended data 2a,b). NSCs that co-expressed GFAP and Gli1 were also present in the human SVZ (Extended data 2c). Outside of the SVZ, labeled cells co-expressed GFAP (data not shown) but not PDGFRα (Extended data 2b) and thus correspond to a subset of mature astrocytes but not OPCs, as previously reported17. No LacZ+ cells were present in the CC during or after recovery from cuprizone- or LPC-mediated demyelination further indicating that Shh-responsive cells do not arise from within the callosum (data not shown). Thus, while NSCs in the SVZ actively respond to Shh, their progeny, upon entry into the callosum, do not. These results are consistent with the minimal expression of Gli proteins by OPCs or oligodendrocytes during development (http://web.stanford.edu/group/barres_lab/brain_rnaseq.html) and indicate Shh-signaling is decreased in OPCs during both normal development and active remyelination.
A time-course analysis of fate-mapped cells in Gli1CE/+ mice strongly suggests NSCs emigrate from the SVZ into the CC following demyelination (Extended data 2d, e, f) and argues against trans-differentiation of Gli1-expressing astrocytes in the cortex as a source of labeled cells. Together, these data indicate that a Shh-responsive pool of NSCs in the SVZ are recruited specifically to the demyelinated CC where they downregulate Gli1 and differentiate into mature, myelinating oligodendrocytes.
Downregulation of Gli1 expression by remyelinating SVZ-derived OPCs raised the possibility that inhibiting Shh-signaling might further augment remyelination - a notion that contrasts with previous studies showing that Shh signaling can promote repair after CNS injury20 and is required for remyelination10. We first analyzed the effects of a partial loss of Shh signaling by fate mapping NSCs in Gli1 null (Gli1CE/nLacZ;RCE) vs. het (Gli1CE/+;RCE) mice. Consistent with our hypothesis, there were many more GFP-labeled cells in the remyelinating CC of Gli1 nulls (63 ± 6.5/section) than in Gli1 hets (17.3 ± 2.6/section; Fig. 2a,b) and a much higher percentage of these were mature oligodendrocytes in the nulls (81.3 ± 4.4%) than in the hets (40.2 ± 15.1%, Fig. 2c). In toto, there were ~ 7.5 fold more GFP-labeled, mature oligodendrocytes in the Gli1 null vs. het mice. The proportion of labeled OPCs in the nulls vs. hets was similar (5.22 ± 2.5% vs. 9.8 ± 8.7%, Fig. 2c) whereas that of GFAP-expressing astrocytes was significantly reduced (2.6 ± 1.3% vs. 15.5 ± 4.1%, Fig. 2c). Finally, overall myelin levels in the CC were increased in the Gli1 nulls compared to hets three weeks after cessation of cuprizone (Fig. 2d) strongly suggesting this enhanced NSC remyelination is physiologically significant.
Figure 2. Loss of Gli1 enhances oligodendrogliogenesis during remyelination.

a, Brains of Gli1CE/+ (Gli1Het), Gli1CE/nLacZ (Gli1Null) and Gli1CE/+;Smofx/fx (SmoNull) mice were analyzed two weeks after cessation of cuprizone by immunofluorescence. GFP+ cells are only observed in the CC of mice receiving cuprizone. n=10 mice/group/genotype, Scale bar, 50μm. b, Quantification of the numbers of GFP+ cells in the CC shows a significant increase in Gli1Null mice compared to Gli1Het and SmoNull mice. n=3 mice/group/genotype. c, Gli1Null mice have a greater proportion of labeled mature oligodendrocytes and reduced proportions of astrocytes than do Gli1Het and SmoNull mice. n=3 mice/group/genotype. d, 3 weeks after cessation of cuprizone, Gli1Null mice have enhanced Myelin Basic Protein (MBP) expression in the CC. n=4 mice/group/genotype. Scale bar,50μm, CC= corpus callosum, Data are mean ± SEM, Student’s T test.
While cuprizone primarily demyelinates the CC, it also has modest effects on other white matter tracts16. Accordingly, labeled oligodendrocytes in the Gli1 nulls were also present in white matter tracts at sites distant from the SVZ including the lateral striatum, anterior commissure (Extended data 3a,b) and the optic nerve (data not shown). No GFP-labeled cells were seen in the CC or other white matter tracts of hets or nulls on a control diet (Fig. 2a). Thus, in the adult, this effect of Gli1 is specific to remyelination.
Myelination also commenced significantly earlier in the Gli1 nulls than in the hets (Extended data 4a,b). In addition, the CC were slightly larger on average in the adult Gli1 nulls vs. hets based on Black-Gold myelin staining (Extended data 4c–e), although differences were not statistically significant. Thus, during development Gli1 expression delays the onset of myelination and in the adult substantially inhibits remyelination by the Shh-responsive NSCs.
As Gli1 is expressed only upon sustained, high-level Shh-signaling, we asked whether complete abrogation of this pathway also enhanced myelination. In contrast to loss of Gli1, loss of canonical Shh signaling by conditional ablation of smoothened in Gli1-expressing NSCs (i.e. Gli1CE/+;Smofx/fx;RCE) mice did not increase the numbers of labeled cells in the CC or alter their cell fates (Fig. 2a–c). Thus, loss of Gli1 is distinct from loss of Shh signaling, underscoring the specificity of the effects of Gli1.
We also examined the effects of activating canonical Shh signaling in the presence or absence of Gli1. To this end, we expressed an activated (M2) form of Smo21 in NSCs upon tamoxifen treatment in Gli1 het (Gli1CE/+;SmoM2) and null (Gli1CE/nLacZ;SmoM2) mice; the activated SmoM2 allele is itself fused to YFP permitting fate mapping. Again, labeled cells were only detected in the CC in mice that had undergone demyelination (Extended data 5a). In the Gli1CE/+;SmoM2 mice, many of the GFP+ cells (5.6 ± 2.9/section) in the CC (Extended data 5b) were oligodendrocyte progenitors (57.5 ± 23.2%, Extended data 5c), a much higher proportion than in Gli1CE/+ mice (9.8 ± 8.7%). These results agree with previous studies that showed increasing the levels of Shh in the brain enhances the generation of OPCs but blocks their maturation22. The Gli1null;SmoM2 mice had many more GFP+ labeled cells in the CC than the Gli1het;SmoM2 mice, (47.2 ± 25.7 vs. 5.6 ± 2.9/section, Extended data 5b) and a significantly greater proportion of these were mature oligodendrocytes (52.5 ± 10.5% vs. 28.8 ± 3.8%). On average, the Gli1null;SmoM2 mice had ~ 16 times as many oligodendrocytes derived from the Shh-responsive NSC pool as did the Gli1het;SmoM2 mice (Extended data 5b,c). These results indicate loss of Gli1 has an even greater effect in the context of active Shh signaling, promoting robust recruitment and relieving an arrest of NSCs differentiation into oligodendrocytes in the remyelinating CC.
Other analyses revealed that loss of Gli1 results in a significant increase in proliferation in Shh-responsive SVZ NSCs but only at the onset of demyelination, i.e. 3 weeks of cuprizone treatment (Extended data 6a,b). There was no difference in the proliferation of NSCs of Gli1 nulls vs. hets on a normal diet, on a cuprizone diet at 4, 5 or 6 weeks, or 2 weeks after removal of cuprizone (data not shown). The higher proliferation at 3 weeks may contribute to preservation of the stem cell pool, which was unchanged in the SVZ of Gli1 nulls (see Extended data 6c). We did not detect any increase in Shh levels with demyelination or a significant difference in Shh levels between Gli1 hets vs. nulls (Extended data 6d–f). Thus, the major effects of loss of Gli1 in NSCs appear to be enhanced differentiation and recruitment to lesion sites and an increase in proliferation during demyelination.
These findings suggested that Gli1 might be a useful therapeutic target to promote remyelination. To test this possibility, we infused GANT61, a small molecule inhibitor of Gli123 into the lateral ventricle of Gli1CE/+ mice via a mini-osmotic pump, corroborating inhibition of Gli1 by the reduction of its mRNA levels by qPCR (Extended data 7a). A similar inhibition of Gli1 mRNA levels was observed when the drug was administered via intraperitoneal injection and oral gavage indicating GANT61 can cross the blood brain barrier efficiently. We infused GANT61 in Gli1CE/+ mice during the last two weeks of the cuprizone diet and continued it for an additional 2 weeks off cuprizone for a total of 4 weeks. Mice that received GANT61 vs. vehicle had significantly greater numbers of labeled cells (43.8 ± 22.1 vs. 6.4 ± 5/section, Fig. 3a,b) and a significantly greater proportion of these were oligodendrocytes (65.4 ± 7.5% vs. 21.4 ± 18.7%, Fig. 3c). Administration of GANT61 was well tolerated and did not deplete the NSCs in the SVZ (Extended data 7b,c). Importantly, mice receiving extended treatment with GANT61, i.e. during the last two weeks of the cuprizone diet and 6 weeks thereafter for a total of 8 weeks, had more myelin in the CC than mice similarly treated with vehicle (Fig. 3d). Thus, the Gli1 inhibitor enhanced the recruitment and differentiation of Shh-responsive NSCs into oligodendrocytes at sites of demyelination, promoting remyelination.
Figure 3. Pharmacological inhibition of Gli1 promotes NSC recruitment and differentiation during remyelination.

a, Gli1+ cells were fate-mapped in cuprizone-fed Gli1CE/+ (Gli1Het) mice treated with vehicle or GANT61 for 4 weeks before analysis. Mice that received GANT61 had more GFP+ cells than those receiving vehicle. n=5 mice/group; Scale bar, 50μm b, c, Mice that received GANT61 had ~ 7 fold increase in the numbers of GFP-labeled cells in the CC (b) and a significant increase in the percentage of mature oligodendrocytes (c). d, Wildtype mice were fed a cuprizone diet and treated with vehicle or GANT61 for 9 weeks. The brains were examined 6 weeks after recovery from cuprizone diet. Mice that received GANT61 showed significantly higher MBP fluorescence intensity levels than vehicle treated mice. n=5 mice/group. Data are mean ± SEM. Student’s T test.
These effects of GANT61 are specific to NSCs as there were no effects on remyelination by OPCs based on their fate mapping in NG2CreERT2 transgenic mice24 crossed to the RCE reporter (Extended data 8). The lack of an effect of GANT61 on OPC remyelination is consistent with the absence of Gli1 expression by these cells. These results also indicate that enhanced repair by NSCs resulting from GANT61 treatment does not come at the expense of OPC remyelination but rather is additive.
To address the therapeutic potential of inhibiting Gli1, we examined the effects of GANT61 in a relapsing remitting model of experimental autoimmune encephalitis (RR-EAE), a physiologically relevant model of inflammatory demyelination and remyelination. In this model, RR-EAE is induced by injecting a PLP peptide into wild type SJL mice25; the severity of the clinical phenotype of the initial attack correlates to the extent of spinal cord inflammation whereas the late-stage neurological disability in later relapses correlates to axonal loss26 likely resulting from cumulative injury including chronic demyelination. GANT61 was administered by daily oral gavage either prophylactically (i.e. at the onset of PLP immunization) or therapeutically (i.e. at the onset of symptoms). Neither treatment protocol altered the induction of EAE or the severity of the acute attack (~D12) suggesting GANT61 did not affect the immune response (Fig. 4a). In agreement, Gli1 was not expressed by cells in the lymphocytic or monocytic lineages isolated from the spleen, thymus or liver of healthy (Extended data 9) or cuprizone-treated mice (data not shown).
Figure 4. GANT61 improves functional outcomes and is neuroprotective in a RR-EAE model.
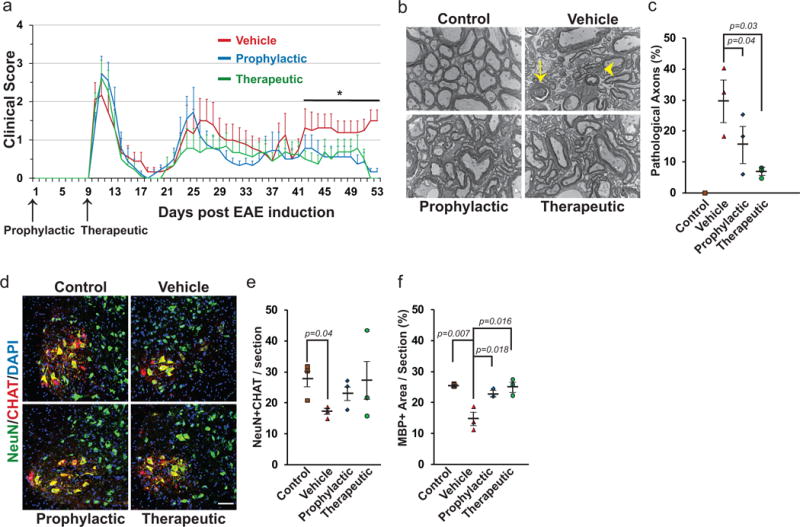
a, EAE clinical scores following prophylactic or therapeutic treatment with GANT61 compared with vehicle administration. n=9 mice/group, Data are mean ± SEM, *p<0.05, Two-way Anova with Tukey’s multiple comparison test. b,c, Electron micrographs from the ventral lumbar spinal cords of control, GANT61- and vehicle-treated EAE mice shows axonal pathology (b) including axolysis (arrow) and dense axoplasm (arrowhead). Quantification of 500 axons/group from 3 mice/group (c) shows a higher proportion of pathological axons in vehicle-treated group compared to GANT61 treated EAE mice. Scale bar, 2nm, n=3 mice/group. d,e, Alpha motor neurons labeled for NeuN and CHAT in the lumbar spinal cords of control, vehicle- and GANT61-treated EAE mice (d). Quantification shows more motor neurons in the GANT61- vs. vehicle-treated mice (e). Scale bar, 50μm, n=3 mice/group, f, Quantification for the area of MBP expression shows lowest levels of myelin in vehicle-treated group. n=3 mice/group. Data are mean ± SEM, Student’s T test.
Of note, GANT61 reduced the severity of the first relapse (~ D27) and significantly enhanced functional recovery during and after the second relapse (~D46) compared to vehicle treatment (Fig. 4a). We therefore examined myelin levels, axon pathology, and motor neuron numbers in the (prophylactic, therapeutic) GANT61- and vehicle-treated lumbar spinal cords at the end of the second relapse phase (i.e. D53). By EM, all three groups had significant spinal cord pathology, with disruption of fascicles of myelinated axons and pathology of individual myelinated axons most evident in vehicle- compared to the GANT61-treated groups (Fig. 4b,c). In all EAE groups, pathology was most pronounced in small diameter axons, (<0.5 microns; Extended data 10a–c) which were increased in numbers and had significantly lower G ratios (ratio of axon diameter to myelinated axon diameter); the reduction in axon diameter and corresponding increase in G ratios is likely due to axonal atrophy and suggestive of active demyelination27. We did not detect significant numbers of unmyelinated or thinly myelinated axons in any group (Extended data 10a–c). While thin myelin sheaths have long been considered to be the hallmark of remyelination1, recent studies suggest remyelination carried out by neural stem cells2 or in the spinal cord can be of normal thickness28. Analysis of MBP levels support significantly higher levels of myelin in the drug vs. vehicle treated groups (Fig. 4f).
The numbers of lower motor neurons (LMNs), identified by co-staining for NeuN and CHAT (choline acetyl transferase)29, were significantly reduced in the spinal cords of vehicle-treated (16.93 ± 1.92/section) vs. healthy control mice (27.59 ± 5.9/section, Fig. 4d,e). LMN numbers in the GANT61-treated groups were intermediate and closer to controls (prophylactic: 23.4 ± 4.3/section; therapeutic: 26.93 ± 8.4/section) providing strong presumptive evidence of neural protection, potentially as a consequence of reduced axon pathology and/or remyelination. The relative preservation of LMNs is consistent with the reduction in axonal pathology and likely accounts for improved functional outcomes. Taken together these results suggest inhibition of Gli1 enhances remyelination and thereby protects neurons from degeneration in this EAE model without altering the immune response. Gli1 is primarily expressed in the spinal cord by a subset of astrocytes within the parenchymal grey matter and by cells located around the central canal, a site of spinal cord NSCs30 but not by NG2+ OPCs (Extended data 10d). These findings suggest the effects of inhibiting Gli1 on myelination and neuroprotection are mediated by direct effects on neural stem cells or potentially via indirect effects mediated by parenchymal astrocytes.
These studies demonstrate that inhibiting Gli1 appears to be a well-tolerated and effective strategy for mobilizing and enhancing the differentiation of a resident population of Shh-responsive neural stems cells. The finding of elevated levels of myelin, reduced axon pathology, and preservation of lower motor neurons in a RR-EAE model further support its therapeutic potential. This approach may therefore be useful in aiding repair in MS and other demyelinating neurological disorders. The findings also highlight that different pools of remyelinating cells (i.e. NSCs and OPCs) may require different strategies to promote their remyelination of axons, raising the possibility of utilizing combinatorial strategies to enhance repair.
Methods
Fate mapping and demyelination
10 week old mice were administered 5 mg Tamoxifen (Sigma) in corn oil on alternate days for total of 4 intraperitoneal (i.p.) injections. NestinCE/+, Gli1CE/+, Gli1CE/nLacZ, Gli1nLacZ/+, Gli1nLacZ/nLacZ and Gli1CE/+;Smofx/fx mice, maintained on Swiss-Webster background were fed 0.4% cuprizone31. Gli1CE/+;SmoM2, Gli1CE/nLacZ;SmoM2, NG2CE and ShhCE/+ mice were maintained in C57Bl/6 background and fed 0.2% cuprizone diet to obtain comparable demyelination in the corpus callosum (CC)31 (Supplementary table 1). No labeling was seen in the absence of tamoxifen administration. For the LPC model, 2 μl 1% LPC (Calbiochem) were stereotaxically injected into the CC at 1.5 mm anterior, 1.2 mm lateral and 2.2 mm ventral to bregma.
Drug administration
GANT61 (Enzo Life Sciences) (5.6 mg/Kg/day) or vehicle (50% DMSO + 15% Ethanol in PEG400) were delivered via mini-osmotic pump (model 2004, Durect) at a rate of 0.25 μl/h for 4 weeks into the lateral ventricle of Gli1CE/+mice at 0.5 mm Anterior, 0.75 mm lateral and 2.5 mm ventral to the bregma. For intra-peritoneal and oral routes, 50 mg/kg GANT61 dissolved in ethanol:corn oil (1:4) was administered daily for 4 weeks.
Immunostaining
For Black-Gold (Millipore) myelin staining, mice were perfused with 4% PFA and 20 μm coronal cryosections were stained according to manufacturers protocol. For all other analysis, mice were perfused with Prefer (Anatech) and 20 μm coronal cryosections were processed for immunofluorescence with rabbit or chicken anti-GFP (1:1000, Invitrogen) and one of the following antibodies: rat anti-PDGFRα (1:200, BD biosciences); rabbit anti-NG2 (1:200, Millipore), anti-S100β (1:600, Dako) and β4 spectrin (1:4000, from M. Rasband); mouse anti-CC1 (1:400, Calbiochem), anti-GFAP (1:400, sigma), anti-NeuN (1:200, Millipore), anti-Shh (1:500, DSHB), anti-MOG (1:50, sigma) and anti-MBP (1:500, Millipore); goat anti-LacZ (1:2000, Biolegend) and anti-CHAT (1:200, Millipore); chicken anti-P0 (1:200, Millipore); guinea pig anti-Caspr (1:3000, from M. Bhat) and anti-Sox10 (1:1000, from M. Wegner). 30μm cryosections of a healthy human brain autopsy specimen (provided by New York Brain Bank of Columbia University) were stained with rabbit anti-Gli1 (1:2000, Abcam) and mouse anti-GFAP (1:400, Sigma). Secondary antibodies were goat or donkey anti-species conjugated with Alexafluors (1:1000, Molecular Probes). Nuclei were counterstained with Hoechst 33258 (1:5000, Invitrogen). Fluorescent images were obtained as Z-stacks of 1μm optical sections using a confocal laser-scanning microscope (LSM 510, Zeiss) and processed using Adobe Photoshop. At least 10 sections per mouse were analyzed and data from 3–5 mice were combined to determine the average and standard deviation. Student’s t-test was performed to calculate P values.
Flow cytometry
Cells from the thymus, spleen and liver were stained with the following conjugated antibodies: CD4 (RM4-5), CD8 (53-6.7), CD19 (6D5), Ly6c (HK1.4), CD11b (M1/70), CD11c (N418), CD45 (30-F11), PDCA-1 (927), B220 (RA3-6B2) and CD3 (145-2C11). Antibodies were purchased from eBioscience® or Biolegend® and the staining was performed according to the manufacturer’s instructions. DAPI (Invitrogen®) was always used to exclude dead cells from the analysis. Stained cells were analyzed on a LSRII flow cytometer (BD) and data processed using FlowJo (Tree Star).
EdU labeling
200 mg/kg EdU (Invitrogen) dissolved in saline was administered by i.p. injection one day before harvesting the brains. EdU was visualized using the AlexaFluor-594 Click-iT EdU Cell Proliferation Assay Kit (Invitrogen) according to manufacturer’s instructions.
EAE model
The PLP-induced EAE model was performed and scored using the EAE induction kit (Hooke Labs) on 8 week-old female SJL mice according to the manufacturer’s instruction. We used a random number generator to assign each mouse to a group and used an inclusion criteria of clinical score of 2 or above for final analysis (n=9/group). Mice received either vehicle (ethanol:corn oil [1:4]) or 50 mg/kg GANT61 via oral gavage until the end of the experiment i.e. day 53 post-induction. The investigator who performed the clinical scoring was blinded to the drug treatments and vice versa. The histological analysis was also done blinded.
Electron microscopy
Immunoelectron microscopy was performed on brain sections to detect membrane bound GFP in the myelin wraps around axons in the CC according to a prior study32.
Quantitative PCR (qPCR)
mRNA was extracted from the forebrains of 3 mice in each group using RNeasy kit (Qiagen) and reverse-transcribed to cDNA using quantitect kit (Qiagen). Power SYBR green QPCR master mix (Applied Biosystems) was used to perform QPCRs in a Stratagene MX3000P thermal cycler. Primers used were Gli1 (forward, 5′-CCC ATA GGG TCT CGG GGT CTC AAA C-3′ and reverse, 5′-GGA GGA CCT GCG GCT GAC TGT GTA A-3′), Gli2 (forward, 5′-AGA GAC AGC AGA AGC TAT GCC CAA-3′ and reverse, 5′-TGG GCA GCC TCC ATT CTG TTC ATA-3′) and GAPDH (forward, 5′-GGT GTG AAC GGA TTT GGC CGT ATT G-3′ and reverse, 5′-CCG TTG AAT TTG CCG TGA GTG GAG T-3′). 2−ΔΔCt method was used to analyze the relative gene expressions and students t-test was performed to calculate P values.
Extended Data
Extended data 1. Gli1-expressing cells generate oligodendrocytes following demyelination.

Additional markers used to analyze fate mapped Shh-responsive NSCs are shown. a, 2 weeks after removal from cuprizone diet, GFP-labeled cells in the CC of Gli1CE/+ mice co-expressed the oligodendroglial progenitor markers PDGFRα, NG2 and Sox10, the mature oligodendrocyte marker CC1, and the astrocytic markers GFAP and S100β. Scale bar, 10 μm. b, 4 weeks after removal from cuprizone diet, GFP-labeled processes co-localized with myelin proteins MBP and MOG but not with peripheral myelin protein P0. GFP-labeled processes also overlaid the axonal, paranodal marker Caspr. n=5 mice/group, Scale bar, 10 μm.
Extended data 2. Gli1-expressing neural stem cells in the SVZ egress and generate labeled cells in the corpus callosum.

a, Expression of Gli1 in the forebrain was confirmed in Gli1nLacZ/+ mice by immunofluorescence for LacZ. Labeled cells were observed in the SVZ, cortex and basal forebrain but not in the CC of mice. The right panel shows the magnified images for the corresponding boxes in the left panel. n=5 mice, Scale bar, 50μm. b, Double staining for PDGFRα and LacZ in the Gli1nLacZ/+ forebrain does not show any co-labeled cells indicating that Gli1 is not expressed by OPCs. n=5 mice, Scale bar, 50μm. c, The ventral SVZ lining the body of the lateral ventricle from a human brain specimen shows colocalization of Gli1 with GFAP+ cells (yellow arrow) as well as a Gli1+ cell not expressing GFAP (arrow head). n= 1 brain, Scale bar, 50μm. d, e, f, Time course analysis of the SVZ and CC of Gli1CE/+ mice stereotactically injected with saline (control, left panels) or Lysolecithin (LPC) (right panels) to induce demyelination; n=3 mice/group. No labeled cells were seen within the CC following saline injections; areas of ingress into the LPC-injected CC are boxed. At 1 day post lesion (dpl) (d) GFP-labeled cells diverted towards the CC; at 2 dpl (e), a few labeled cells were seen within the CC; at 6 dpl (f), many GFP+ cells had accumulated at the site of LPC injection (arrowhead). Scale bar, 50μm.
Extended data 3. Neural stem cells generate oligodendrocytes in various white matter tracts in Gli1-null brains upon demyelination.
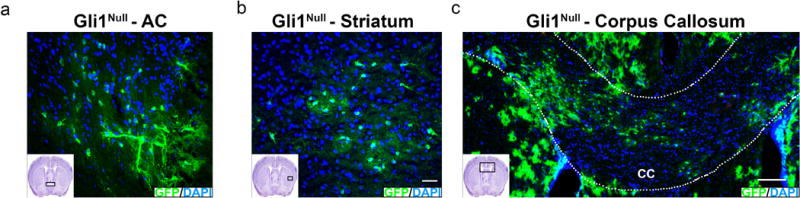
a,b Fate-mapped Gli1-null cells migrated into the anterior commissure (AC) (a) and striatum (b) following cuprizone-mediated demyelination (inset shows the area of the forebrain) in Gli1Null (Gli1CE/nLacZ) mice. Scale bar, 50μm c, 2 weeks after removal from cuprizone diet, GFP-labeled cells are present throughout the CC of Gli1Null (Gli1CE/nLacZ) mice. n=5 mice/group, CC= corpus callosum, Scale bar, 100 μm.
Extended data 4. Myelination commences earlier in developing Gli1 null mice.

a, Gli1nLacZ/nLacZ (Gli1Null) mice (right panel) show increased Myelin Basic Protein (MBP) levels in the forebrain at post-natal day 9 (P9) compared to Gli1nLacZ/+ (Gli1Het) mice. b, Quantification of the extent of MBP expression at P9 in the CC of Gli1 nulls (47.12 ± 10.44%) vs. hets (29.71 ± 1.77%) corroborates myelination is accelerated, n=5 mice/genotype c, Analysis of healthy adult forebrain shows the intensity of Black-Gold myelin stain in Gli1 hets and nulls was comparable; d, Quantification of the sizes of the CC shows the CC in Gli1Null (Gli1nLacZ/nLacZ) were slightly larger on average than those in Gli1Het (Gli1nLacZ/+) mice, although the difference was not statistically significant n=5 mice/genotype. e, Quantification of G ratios (ratio of myelinated axon diameter to the axon diameter) from electron micrographs of healthy Gli1Het (Gli1nLacZ/+) and Gli1Null (Gli1nLacZ/nLacZ) mice revealed no difference in the thickness of myelin sheaths in the CC. n=3 mice/genotype, Scale bar, 50μm, CC= corpus callosum, Data are mean ± SEM. Student’s T test.
Extended data 5. Effects of gain of Smoothened function in Gli1-het vs. Gli1-null cells during remyelination.
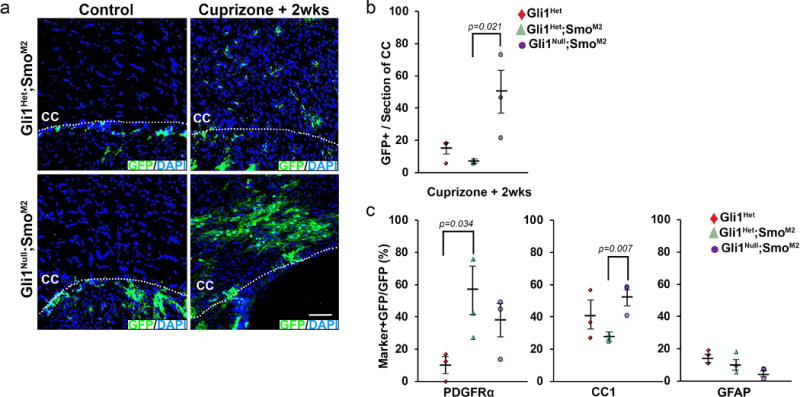
Gli1Het (Gli1CE/+), Gli1Het;SmoM2 (Gli1CE/+;SmoM2) and Gli1Null;SmoM2 (Gli1CE/nLacZ;SmoM2) mice were injected with tamoxifen, fed either a regular or a cuprizone-supplemented diet for 6 weeks and analyzed by immunofluorescence 2 weeks after removal of cuprizone. a, GFP+ cells are only seen in the CC of mice on cuprizone diet (right panels) and not in the control mice (left panels). b, Quantification of the GFP+ cells in the CC shows significantly higher numbers of cells in Gli1Null;SmoM2 mice compared to Gli1Het and Gli1Het;SmoM2 mice. c, Quantification of the proportion of GFP-labeled co-expressing glial markers in the CC of cuprizone treated Gli1Het, Gli1Het;SmoM2 and Gli1Null;SmoM2 mice shows an increase in percentage of GFP-labeled OPCs (PDGFRα+) in Gli1Het;SmoM2 mice and mature oligodendrocytes (CC1+) in Gli1Null;SmoM2 mice; n=3 mice/group/genotype, Data are mean ± SEM. Student’s T test.
Extended data 6. Proliferation of NSCs and expression of Shh in Gli1-null mice.

a,b, At the start of demyelination (three weeks of cuprizone diet), Gli1Null (Gli1nLacZ/nLacZ) brains have a higher proportion of proliferating nLacZ+ neural stem cells indicated by the percentage of EdU incorporating cells co-expressing nLacZ in the subventricular zone (SVZ) compared to Gli1Het (Gli1nLacZ/+) brains, i.e. 31 ± 8.9% vs 8.22 ± 5.33%, respectively. n=3 mice/group/genotype; Scale bar, 50μm. c, The numbers of fate-mapped Gli1+ neural stem cells in the SVZ were quantified as the proportion of GFP+ cells co-expressing GFAP in Gli1Het (Gli1CE/+) and Gli1Null (Gli1CE/nLacZ) mice at two weeks of recovery from cuprizone diet. The percentage of GFAP+GFP+ cells in the SVZ of mice receiving cuprizone diet was comparable to those on a control diet suggesting that the stem cell pool is not depleted during remyelination. n=3 mice/group/genotype. Data are mean ± SEM, Student’s T test. d, Fate-mapping of Shh expressing cells using a membrane GFP reporter labels neurons in the basal forebrain (left panel) with their neurites reaching the ventral SVZ (right panel) in Gli1Het and Gli1Null brains e, Gli1Null mice show expression of Sonic Hedgehog (Shh) in the SVZ and CC following demyelination which is mostly co-localized to GFAP-expressing cells. f, Quantification of the proportional area of the CC expressing Shh does not show any significant difference between Gli1Het and Gli1Null mice either on control or cuprizone diet. n=3 mice/group/genotype, CC= corpus callosum, SVZ=Subventricular Zone, Data are mean ± SEM, Student’s T test. Scale bar, 50μm.
Extended data 7. GANT61 reduces Gli1 levels but does not deplete neural stem cells in the SVZ.
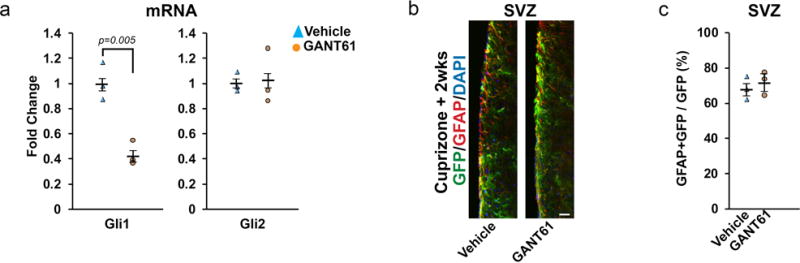
a, Relative expression of Gli1 and Gli2 mRNA in the forebrain of Gli1CE/+ mice was examined by qPCR after administration of GANT61 (50mg/Kg/day) for 4 weeks. GANT61 decreases the mRNA levels of Gli1 significantly without changing Gli2 levels. n=3 mice/group, Data are mean ± SEM. Student’s T test. b, c, The numbers of fate-mapped Gli1+ neural stem cells in the SVZ were analyzed by immunofluorescence as the proportion of GFP+ cells co-expressing GFAP in Gli1CE/+ mice treated with vehicle or GANT61 at two weeks of recovery from cuprizone diet (b). The percentage of GFAP+GFP+ cells in the SVZ of mice treated with GANT61 was comparable to those treated with vehicle suggesting that the stem cell pool is not depleted by GANT61 (c). n=3 mice/group, Data are mean ± SEM. Student’s T test.
Extended data 8. Pharmacological inhibition of Gli1 does not affect OPC recruitment or differentiation during remyelination.
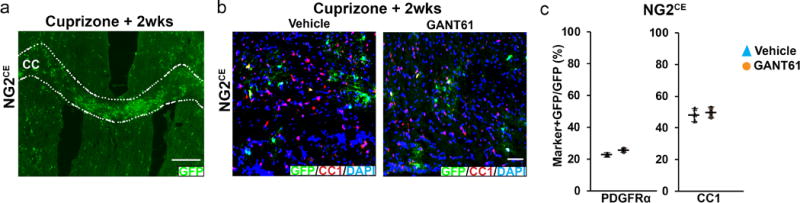
a, NG2CE/+ mice were treated with two doses of i.p. tamoxifen to sparsely label OPCs and analyzed at 2 weeks of recovery from cuprizone; Scale bar, 50μm. b, The numbers (~40 GFP+ cells/field), and c proportions of GFP-labeled OPCs (PDGFRα) and mature oligodendrocytes (CC1) were similar in the GANT61 vs. the vehicle treated mice in the CC indicating GANT61 does not alter OPC remyelination. Scale bar, 50μm. n=3 mice/group, Data are mean ± SEM. Student’s T test.
Extended data 9. Gli1 is not expressed by immune cells of spleen, thymus and liver of healthy mice.

Cells from the spleen, liver and thymus of tamoxifen treated Gli1Het (Gli1CE/+) and Gli1Null (Gli1CE/nLacZ) mice were analyzed by flow cytometry for GFP expression. Wt (wild type) mice did not express GFP and were used as controls. Representative flow cytometry scatterplots showing absence of GFP expression in (a) CD45+/CD3+/CD4+/CD19+ T and B cells; (b) CD45+/CD3−/CD19−/B220+/MPDCA+ plasmacytoid dendritic cells; (c) CD45+/CD3−/CD19−/B220−/CD11b+ macrophages, monocytes, dendritic and natural killer (NK) cells and (d) CD45+/CD3−/CD19−/B220−/CD11b− cells in Gli1CE/+ and Gli1CE/nLacZ mice. n=3 mice/genotype.
Extended data 10. Effects of GANT61 on spinal cord axons in the PLP-induced EAE model.

a, Scatterplot of G ratios with respect to axonal diameters (n=500 axons in 3 mice/group, exponential trend line). b, Analysis of electron microscopy images showing the relative proportion of axons binned by their diameters in the 4 groups. c, Analysis of electron microscopy images indicating the G ratios of axons relative to their diameters in the 4 groups (n=500 axons in 3 mice/group, Data are mean ± SEM. Student’s T test). d, Immunofluorescence image of a spinal cord section from Gli1nLacZ/+ mice shows that LacZ is not expressed by NG2+ OPCs. The inset shows expression of LacZ in the germinal zone around the central canal. n=3 mice, Scale bar, 50μm.
Supplementary Material
Acknowledgments
We thank A. Joyner for providing mouse lines and for advice during the course of this project, M. Bhat, M. Wegner, and M. Rasband for providing antibodies, George Zanazzi for providing human brain tissue, Alice Liang for assistance with immuno-EM, and G. Multani for technical assistance during initial studies. This research was supported by grants to J.L.S. from the NYS DOH Stem Cell and the National Multiple Sclerosis Society (NMSS). JS was a recipient of a postdoctoral fellowship from NMSS.
Footnotes
Author Contributions J.S. performed the experiments, analyzed the data and co-wrote the paper with J.L.S. All authors contributed to the design of individual experiments, reviewed individual results, and assisted with portions of manuscript preparation.
References
- 1.Franklin RJ, Goldman SA. Glia Disease Repair-Remyelination. Cold Spring Harbor perspectives in biology. 2015 doi: 10.1101/cshperspect.a020594. [DOI] [PMC free article] [PubMed] [Google Scholar]
- 2.Xing YL, et al. Adult neural precursor cells from the subventricular zone contribute significantly to oligodendrocyte regeneration and remyelination. The Journal of neuroscience: the official journal of the Society for Neuroscience. 2014;34:14128–14146. doi: 10.1523/JNEUROSCI.3491-13.2014. [DOI] [PMC free article] [PubMed] [Google Scholar]
- 3.Scolding N, et al. Oligodendrocyte progenitors are present in the normal adult human CNS and in the lesions of multiple sclerosis. Brain: a journal of neurology. 1998;121(Pt 12):2221–2228. doi: 10.1093/brain/121.12.2221. [DOI] [PubMed] [Google Scholar]
- 4.Gensert JM, Goldman JE. Endogenous progenitors remyelinate demyelinated axons in the adult CNS. Neuron. 1997;19:197–203. doi: 10.1016/s0896-6273(00)80359-1. [DOI] [PubMed] [Google Scholar]
- 5.Zawadzka M, et al. CNS-resident glial progenitor/stem cells produce Schwann cells as well as oligodendrocytes during repair of CNS demyelination. Cell stem cell. 2010;6:578–590. doi: 10.1016/j.stem.2010.04.002. [DOI] [PMC free article] [PubMed] [Google Scholar]
- 6.Menn B, et al. Origin of oligodendrocytes in the subventricular zone of the adult brain. The Journal of neuroscience: the official journal of the Society for Neuroscience. 2006;26:7907–7918. doi: 10.1523/JNEUROSCI.1299-06.2006. [DOI] [PMC free article] [PubMed] [Google Scholar]
- 7.Nait-Oumesmar B, et al. Activation of the subventricular zone in multiple sclerosis: evidence for early glial progenitors. Proceedings of the National Academy of Sciences of the United States of America. 2007;104:4694–4699. doi: 10.1073/pnas.0606835104. [DOI] [PMC free article] [PubMed] [Google Scholar]
- 8.Fuccillo M, Joyner AL, Fishell G. Morphogen to mitogen: the multiple roles of hedgehog signalling in vertebrate neural development. Nature reviews. Neuroscience. 2006;7:772–783. doi: 10.1038/nrn1990. [DOI] [PubMed] [Google Scholar]
- 9.Petrova R, Joyner AL. Roles for Hedgehog signaling in adult organ homeostasis and repair. Development. 2014;141:3445–3457. doi: 10.1242/dev.083691. [DOI] [PMC free article] [PubMed] [Google Scholar]
- 10.Ferent J, Zimmer C, Durbec P, Ruat M, Traiffort E. Sonic Hedgehog signaling is a positive oligodendrocyte regulator during demyelination. The Journal of neuroscience: the official journal of the Society for Neuroscience. 2013;33:1759–1772. doi: 10.1523/JNEUROSCI.3334-12.2013. [DOI] [PMC free article] [PubMed] [Google Scholar]
- 11.Ingham PW, McMahon AP. Hedgehog signaling in animal development: paradigms and principles. Genes Dev. 2001;15:3059–3087. doi: 10.1101/gad.938601. [DOI] [PubMed] [Google Scholar]
- 12.Ahn S, Joyner AL. Dynamic changes in the response of cells to positive hedgehog signaling during mouse limb patterning. Cell. 2004;118:505–516. doi: 10.1016/j.cell.2004.07.023. [DOI] [PubMed] [Google Scholar]
- 13.Dessaud E, McMahon AP, Briscoe J. Pattern formation in the vertebrate neural tube: a sonic hedgehog morphogen-regulated transcriptional network. Development. 2008;135:2489–2503. doi: 10.1242/dev.009324. [DOI] [PubMed] [Google Scholar]
- 14.Ahn S, Joyner AL. In vivo analysis of quiescent adult neural stem cells responding to Sonic hedgehog. Nature. 2005;437:894–897. doi: 10.1038/nature03994. [DOI] [PubMed] [Google Scholar]
- 15.Sousa VH, Miyoshi G, Hjerling-Leffler J, Karayannis T, Fishell G. Characterization of Nkx6-2-derived neocortical interneuron lineages. Cerebral cortex. 2009;19(Suppl 1):i1–10. doi: 10.1093/cercor/bhp038. [DOI] [PMC free article] [PubMed] [Google Scholar]
- 16.Matsushima GK, Morell P. The neurotoxicant, cuprizone, as a model to study demyelination and remyelination in the central nervous system. Brain Pathol. 2001;11:107–116. doi: 10.1111/j.1750-3639.2001.tb00385.x. [DOI] [PMC free article] [PubMed] [Google Scholar]
- 17.Garcia AD, Petrova R, Eng L, Joyner AL. Sonic hedgehog regulates discrete populations of astrocytes in the adult mouse forebrain. The Journal of neuroscience: the official journal of the Society for Neuroscience. 2010;30:13597–13608. doi: 10.1523/JNEUROSCI.0830-10.2010. [DOI] [PMC free article] [PubMed] [Google Scholar]
- 18.Balordi F, Fishell G. Mosaic removal of hedgehog signaling in the adult SVZ reveals that the residual wild-type stem cells have a limited capacity for self-renewal. The Journal of neuroscience: the official journal of the Society for Neuroscience. 2007;27:14248–14259. doi: 10.1523/JNEUROSCI.4531-07.2007. [DOI] [PMC free article] [PubMed] [Google Scholar]
- 19.Bai CB, Auerbach W, Lee JS, Stephen D, Joyner AL. Gli2, but not Gli1, is required for initial Shh signaling and ectopic activation of the Shh pathway. Development. 2002;129:4753–4761. doi: 10.1242/dev.129.20.4753. [DOI] [PubMed] [Google Scholar]
- 20.Bambakidis NC, Onwuzulike K. Sonic Hedgehog signaling and potential therapeutic indications. Vitamins and hormones. 2012;88:379–394. doi: 10.1016/B978-0-12-394622-5.00017-1. [DOI] [PubMed] [Google Scholar]
- 21.Xie J, et al. Activating Smoothened mutations in sporadic basal-cell carcinoma. Nature. 1998;391:90–92. doi: 10.1038/34201. [DOI] [PubMed] [Google Scholar]
- 22.Rowitch DH. Sonic hedgehog regulates proliferation and inhibits differentiation of CNS precursor cells. J Neurosci. 1999;19:8954–8965. doi: 10.1523/JNEUROSCI.19-20-08954.1999. [DOI] [PMC free article] [PubMed] [Google Scholar]
- 23.Lauth M, Bergstrom A, Shimokawa T, Toftgard R. Inhibition of GLI-mediated transcription and tumor cell growth by small-molecule antagonists. Proceedings of the National Academy of Sciences of the United States of America. 2007;104:8455–8460. doi: 10.1073/pnas.0609699104. [DOI] [PMC free article] [PubMed] [Google Scholar]
- 24.Zhu X, et al. Age-dependent fate and lineage restriction of single NG2 cells. Development. 2011;138:745–753. doi: 10.1242/dev.047951. [DOI] [PMC free article] [PubMed] [Google Scholar]
- 25.Tuohy VK, Sobel RA, Lees MB. Myelin proteolipid protein-induced experimental allergic encephalomyelitis. Variations of disease expression in different strains of mice. Journal of immunology. 1988;140:1868–1873. [PubMed] [Google Scholar]
- 26.Wujek JR, et al. Axon loss in the spinal cord determines permanent neurological disability in an animal model of multiple sclerosis. Journal of neuropathology and experimental neurology. 2002;61:23–32. doi: 10.1093/jnen/61.1.23. [DOI] [PubMed] [Google Scholar]
- 27.Recks MS, et al. Early axonal damage and progressive myelin pathology define the kinetics of CNS histopathology in a mouse model of multiple sclerosis. Clinical immunology. 2013;149:32–45. doi: 10.1016/j.clim.2013.06.004. [DOI] [PubMed] [Google Scholar]
- 28.Powers BE, et al. Remyelination reporter reveals prolonged refinement of spontaneously regenerated myelin. Proceedings of the National Academy of Sciences of the United States of America. 2013;110:4075–4080. doi: 10.1073/pnas.1210293110. [DOI] [PMC free article] [PubMed] [Google Scholar]
- 29.Aharoni R, et al. Distinct pathological patterns in relapsing-remitting and chronic models of experimental autoimmune enchephalomyelitis and the neuroprotective effect of glatiramer acetate. Journal of autoimmunity. 2011;37:228–241. doi: 10.1016/j.jaut.2011.06.003. [DOI] [PubMed] [Google Scholar]
- 30.Barnabe-Heider F, et al. Origin of new glial cells in intact and injured adult spinal cord. Cell stem cell. 2010;7:470–482. doi: 10.1016/j.stem.2010.07.014. [DOI] [PubMed] [Google Scholar]
- 31.Elsworth S, Howell JM. Variation in the response of mice to cuprizone. Research in veterinary science. 1973;14:385–387. [PubMed] [Google Scholar]
- 32.Glausier JR, Khan ZU, Muly EC. Dopamine D1 and D5 receptors are localized to discrete populations of interneurons in primate prefrontal cortex. Cereb Cortex. 2009;19:1820–1834. doi: 10.1093/cercor/bhn212. [DOI] [PMC free article] [PubMed] [Google Scholar]
Associated Data
This section collects any data citations, data availability statements, or supplementary materials included in this article.