

Abstract
HIV patients are often plagued by sleep disorders and suffer from sleep deprivation. However, there remains a wide gap in our understanding of the relationship between HIV status, poor sleep, overall function and future outcomes; particularly in the case of HIV patients otherwise well controlled on cART (combined anti-retroviral therapy). In this study, we compared two groups: 16 non-HIV subjects (seronegative controls) and 12 seropositive HIV patients with undetectable viral loads. We looked at sleep behavioral (macro-sleep) features and sleep spectral (micro-sleep) features obtained from human-scored overnight EEG recordings to study whether the scored EEG data can be used to distinguish between controls and HIV subjects. Specifically, the macro-sleep features were defined by sleep stages and included sleep transitions, percentage of time spent in each sleep stage, and duration of time spent in each sleep stage. The micro-sleep features were obtained from the power spectrum of the EEG signals by computing the total power across all channels and frequencies, as well as the average power in each sleep stage and across different frequency bands. While the macro features do not distinguish between the two groups, there is a significant difference and a high classification accuracy for the scoring-independent micro features. This spectral separation is interesting because evidence suggests a relationship between sleep complaints and cognitive dysfunction in HIV patients stable on cART. Furthermore, there are currently no biomarkers that predict the early development of cognitive decline in HIV patients. Thus, a micro-sleep architectural approach could serve as a biomarker to identify HIV patients vulnerable to cognitive decline, providing an avenue to explore the utility of early intervention.
I. INTRODUCTION
Insomnia, a condition associated with chronic sleep disruption and associated daytime functional symptoms, is considered the most common and disabling sleep disorder, and one of the most common medical conditions that individuals with HIV encounter in the post cART era [1]. For those with HIV infection particularly, sleep quality may be of critical importance for maintaining optimal cognitive functioning, immune system regulation, pain processing, and medication adherence. Currently, the gold standard for discriminating between patients suffering from sleep disorders and healthy sleepers is through the Pittsburgh Sleep Quality Index (PSQI) measure. The PSQI is computed from a questionnaire that assesses sleep quality and disturbances, with a high PSQI indicating poor sleep quality [2]. As such, the score is subject to survey bias, and hence not entirely objective. Subjective assessments may lead to inaccurate diagnostics, which calls for a great necessity to implement a more objective, quantitative means for diagnosing sleep disturbances. A better understanding of the role that disrupted sleep, particularly insomnia, plays in cognitive performance fluctuations, often demonstrated by individuals with HIV, will help with treatment trial design and clinical management.
Spectral analysis is not a standard of care method for diagnosing or managing any sleep disorder. It remains a technique exclusively explored for its utility in further characterizing the underlying sleep neurophysiology in the research arena only. While some quantitative EEG methods have been utilized to better understand the basis of poor subjective sleep complaints notoriously reported in patients with fibromyalgia, chronic fatigue syndrome and insomnia, very few studies have evaluated sleep EEG in HIV patients demonstrating poor sleep quality [3]. Further, most previous HIV studies were done prior to introduction of cART therapy which has since significantly changed and extended the overall morbidity and mortality of HIV patients respectively. We are not aware of any studies that have attempted to operationalize spectral features as a diagnostic tool for sleep disorders such as insomnia, or as a predictive marker of those who may be at a higher risk for developing common comorbid conditions associated with HIV such as HAND (HIV Associated Neurocognitive Disorder).
One important diagnostic tool used to characterize sleep and diagnose sleep disorders is overnight polysomnography (PSG). At present, the traditional PSG measures are limited to diagnosing sleep apnea and involve costly human scoring with poor inter-scorer reliability. A polysomnogram collects, amongst other things, EEG data in a non-invasive way. The EEG data is scored in a laborious and subjective process by sleep specialists who assign a sleep stage to every 30 second window of the EEG data based on (annotated) “blind-eye” estimation of the primary EEG frequency power per window. Clinicians then make a diagnosis based on the annotated data. Consequently, the standard procedure is currently heavily dependent upon human factors. Furthermore, the lack of utility of traditional PSG approaches for non-apnea sleep disorders has led to a reliance on, and general clinical acceptance of, purely subjective diagnostic criteria such as questionnaires and clinician interviews [1].
Analysis of EEG signals presents a possible alternative method to a more objective way of viewing PSG data. In this study, we compared seronegative controls to seropositive HIV patients. We looked at sleep behavioral (macro-sleep architectural) features and sleep spectral (micro-sleep architectural) features from the annotated EEG data. We found that while the behavioral features do not distinguish between the two groups, there is a significant difference (P ≪ 0.05) and a high classification accuracy for the scoring-independent spectral features. This suggests that the behavioral features, that are subjective and prone to human factors, have limitations and do not appear to be useful for identifying sleep complications in HIV patients. Results generated from this study can potentially provide additional insight for investigators across the entire basic and clinical research spectrum, particularly because we believe that sleep disturbance represents a very significant confounder in the interpretation of overall function (particularly neurophysiological) in HIV patients.
II. Methods
A. Experimental Setup
1) Study Population
Our study population consisted of 16 seronegative controls and 12 seropositive HIV patients. All participants were African American males older than 35 years old. The groups were age-, PSQI-, and BMI-matched (Table 1) and heterogeneous in that each group contained both “good sleepers” (PSQI ≤ 5) and “bad sleepers” (PSQI > 5) [2].
TABLE I.
Patient population statistics
| Subject statistics | Controls (n = 16) | HIV patients (n = 12) |
|---|---|---|
| Age (P = 0.1677) | 51.06 ± 6.23 | 47.92 ± 5.45 |
| PSQI (P = 0.1740) | 4.63 ± 2.09 | 5.92 ± 2.61 |
| BMI (P = 0.1317) | 29.66 ± 6.52 | 27.61 ± 5.86 |
All of the seropositive HIV participants were recruited at Johns Hopkins Medical Institutions (JHMI) from an established HIV-research cohort at JHU [the Northeastern AIDS Dementia (NEAD)], Central Nervous System HIV Antiretroviral Therapy Effects Research (CHARTER) and other available seropositive HIV patient research cohorts. Control participants were recruited from other JHMI research cohorts, advertisements, and from personal referral of established participants. This study was approved by the JHMI IRB and all participants provided informed consent prior to enrollment. A full medical evaluation was conducted to ensure that each participant was medically, cognitively, and psychologically stable to participate. Seropositive HIV participants were required to have a relatively low HIV viral load (3000 copies/ml), and those whose cART regimen included efavirenz were excluded from the study due to its potential sleep-altering effects [4]. Participants were also dropped from the study if they screened positive for recreational drug use during the 2-week protocol.
2) EEG acquisition
The study data was collected between August 2008 and April 2011 for the HIV group and between May 2010 and April 2011 for the control group. The raw data was collected at a sampling rate of 500 Hz, which we downsampled to 80 Hz in our analysis. EEG signals were collected in a contralateral ear reference montage using 6 scalp electrodes and 2 ear electrodes (F3A2, F4A1, C3A2, C4A1, O1A2 and O2A1) (Fig. 1). A PSG was conducted in the Johns Hopkins Clinical Research Unit followed by 2-week-in-home functional assessments with questionnaires and actigraphy monitoring of their sleep and wake activity. The PSG device model used was the same across all participants.
Figure 1.
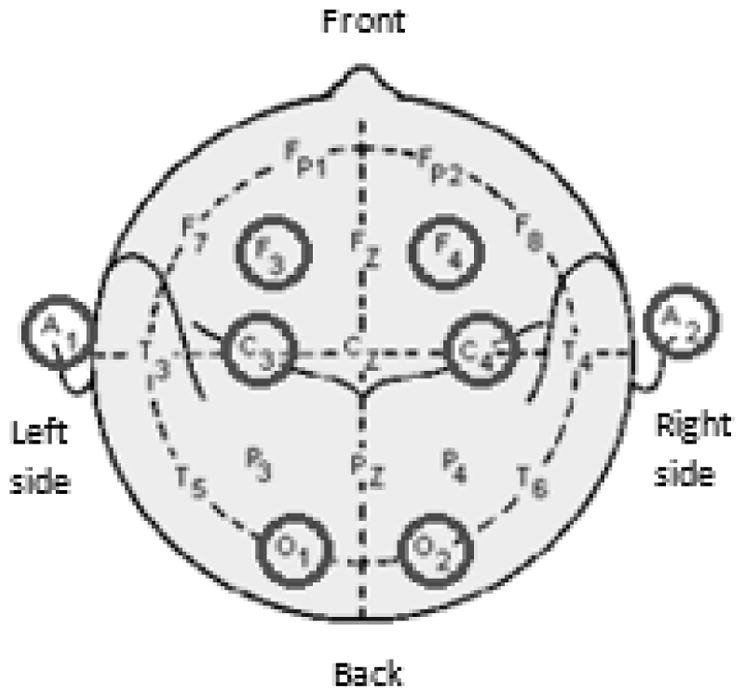
EEG electrode placements in PSG.
3) Sleep Stage Scoring
The EEG data was visually scored according to the 2007 American Academy of Sleep Medicine (AASM) Manual for Scoring Sleep [5] by assigning a sleep stage to every 30 second epoch of the EEG data. The sleep cycle consists of five sleep stages, three non-REM stages; stage N1, stage N2, and stage N3, the REM stage, and wake. A certified sleep specialist reviewed and finalized all of the studies, which were conducted and scored by a registered technician.
B. Data Analysis
1) Sleep Behavioral features
Three types of sleep behavioral features were computed from the scoring files: (i) sleep transitions, (ii) the percentage of time spent in each sleep stage, and (iii) the duration of time spent in each sleep stage. For each participant, a 5-by-5 sleep transitions matrix was created. Each cell in the matrix had a nonnegative integer value representing the count of a specific transition. The direction of a transition flowed from row to column (i.e. cell (1,2) stands for the number of transitions from stage N1 to stage N2. The diagonal of the matrix represents being in a certain sleep stage and staying in that stage for the subsequent epoch). Once a transitions matrix was created, it was normalized by the sum of the matrix to eliminate bias due to total sleep time. From these normalized transitions matrices, the percentage of time spent in each sleep stage was calculated for each patient by summing across the columns. The output was a vector of length 5 with the values representing the percentage of time spent in each of the five sleep stages. Lastly, assuming a patient goes into a sleep stage, a distribution of the duration of time spent in that sleep stage can be extracted. The values of the duration distributions were all non-zero positive multiples of 30 due to the nature of the scoring process.
2) Sleep Spectral features
The sleep spectral features computed were the total power over the entire night, as well as the average power in each of the five sleep stages and across five equally sized frequency bands of 5 Hz between 0–25 Hz.
The features were obtained by inspecting the power spectrum of the EEG signals over the entire night (~8.5 hours). The spectrogram of the EEG signal for each subject was computed using the mtspecgramc command from the Chronux toolbox in MATLAB (R2014b) [6]. This uses a multi-taper estimate scheme based on Slepian functions for calculating the power spectrum of the signal. A sliding window of 3 seconds was used, incrementing by 1 second per step. The time-bandwidth product was 3, with 5 tapers used for estimation. The spectrogram was computed for the frequency of the signal ranging from 0–25 Hz.
From the log power spectrum for each patient, we computed the total average power over the entire night by averaging across all six channels and all frequencies of the signal. Furthermore, we divided the log power spectrum into 5 bands of 5 Hz width (0–5 Hz, 5–10 Hz, …, 20–25 Hz) and calculated the average power in each frequency band. Finally we used the staging files to find the average power in each of the five sleep stages by averaging across all annotated 30 second windows for each sleep stage. All the measures were averaged across all channels since the channels gave very similar results when observed separately.
3) Feature Visualization
We performed principal component analysis on the features for visualization purposes. Feature vectors were created by concatenating all cells of the transitions matrix. Other visualization methods include boxplots and histograms (Fig. 2).
Figure 2.

Normalized counts of all sleep transitions as a feature vector in PC space. There is little to no separation between controls and HIV participants (top). The total average power over the entire night gives the most significant difference between the two groups and yields the highest accuracy of classifying subjects into controls and HIV participants (bottom).
4) Likelihood Ratio Test
In order to test the accuracy of each feature to discriminate between the two groups, we derived a distribution for each subject group and then employed a likelihood ratio classifier. Distributions were created using histograms with a bin size of 20 values. The likelihood ratio test combines the priors of each group with the probability of being in that group derived from a distribution obtained by leaving one patient out at a time. The patient left out is the patient tested. It then assigns the patient to the group with a higher likelihood [7].
5) Testing for Significance
P-values were calculated for sleep behavioral features by bootstrapping with no replacements. We ran a total of 10,000 iterations. For the spectral features the p-values were calculated using a two-sample t-test assuming unequal variances.
III. Results
The difference between the two groups was statistically insignificant (P > 0.05) for all the behavioral features, with the exception of one sleep transition, stage N3 to stage N2, without correction. However, with a Bonferroni correction, all features became insignificant (Table 2). For the spectral features, all features except average power across 10–15 Hz were significantly different between the two groups with the greatest separation in the average total power over the entire night (P = 2.2046·10−4). Even though all spectral features were significantly different between the two groups, scoring independent features had a much better separation between the groups compared to scoring-dependent spectral features.
TABLE II.
P-values of sleep behavior features without correction. Highlighted cells have p-values < 0.05
| Transitions Matrix | % Time | Duration | |||||
|---|---|---|---|---|---|---|---|
| N1 | N2 | N3 | REM | wake | |||
| N1 | 0.0758 | 0.6992 | 0.4976 | 0.1347 | 0.0605 | 0.0794 | 0.3970 |
| N2 | 0.2709 | 0.7320 | 0.0631 | 0.1857 | 0.0858 | 0.6438 | 0.8790 |
| N3 | 0.8697 | 0.0376 | 0.9062 | 0.4327 | 0.7392 | 0.7194 | 0.4070 |
| REM | 0.4859 | 0.5838 | 1.0000 | 0.2907 | 0.8274 | 0.2964 | 0.6921 |
| wake | 0.2162 | 0.1194 | 0.4294 | 0.7042 | 0.9016 | 0.8167 | 0.9242 |
A. Accuracy of Likelihood Ratio Test
1) Sleep Behavioral features
Accuracy values for all sleep behavior features were too low to be considered a good classifier. Accuracy values ranged from 7.14% to 67.86% (Fig. 3). Typically, a feature with accuracy above 70% is considered a good classifier.
Figure 3.

The accuracy of the likelihood ratio classification for sleep transitions with the three lowest p-values without correction (top), the percentage of time spent in each sleep stage (middle) and the duration of time spent in each sleep stage (bottom). Not enough data was available to calculate the accuracy for stage N3 for this feature.
2) Sleep Spectral features
Even though all spectral features were significantly different between the two groups, a likelihood ratio classification using the scoring-independent features yielded much higher accuracy values ranging from 54.05%–78.57%, whereas the accuracy ranged from 32.43% – 54.05% for the scoring-dependent features (Fig. 4).
Figure 4.

The accuracy of the likelihood ratio classification for the scoring-independent spectral features (top). The highest accuracy was obtained using the average total power over the entire night. The accuracy of the likelihood ratio classification for the scoring-dependent spectral features (bottom). All features had a low classification accuracy.
IV. Conclusion
It is well known that HIV patients often complain of sleep disturbances and suffer from sleep deprivation. However, not much research effort has been directed at examining the correlation between sleep disturbances and cognitive function. Nonetheless, it is reasonable to conclude that there is an underlying neurophysiological sleep factor contributing to the cognitive dysfunction observed in HIV patients despite a well-controlled viral load. In this study, we attempted to identify a sleep feature that could potentially act as a predictor for identifying HIV patients most vulnerable to future cognitive decline. Our results showed that behavioral features obtained from human-scored EEG data have limitations and are not able to capture a significant difference between the two groups. On the other hand, we successfully observed a spectral difference through objectively analyzing the EEG data of controls and HIV patients who are PSQI-matched (i.e. the spectral difference is not simply reflecting a difference between good and bad quality sleep). Thus, we conclude that HIV correlates with a change in the brain that manifests in greater spectral power in overnight sleep EEG, and from the preliminary analysis presented above, we propose the average total power over the entire night as a promising biomarker. This may provide insights into why HIV patients present with greater levels of mild cognitive impairment and dementia later in life despite having controlled viral loads and further research in this area can potentially have great impact in the clinical management and treatment design for individuals with HIV.
Acknowledgments
Research supported by JHU CFAR NIH/NIAID 1P30AI094189-01A1
Contributor Information
Kristin M. Gunnarsdottir, Department of Biomedical Engineering, Johns Hopkins University, 3400 Charles St., Baltimore, MD 21218 USA
Yu Min Kang, Department of Biomedical Engineering, Johns Hopkins University, 3400 Charles St., Baltimore, MD 21218 USA.
Matthew S. D. Kerr, Department of Biomedical Engineering, Johns Hopkins University, 3400 Charles St., Baltimore, MD 21218 USA.
Sridevi V. Sarma, Department of Biomedical Engineering, Johns Hopkins University, 3400 Charles St., Baltimore, MD 21218 USA.
Joshua Ewen, Department of Neurology, Johns Hopkins Medicine, 1800 Orleans St. Baltimore, MD 21287 USA.
Richard Allen, Department of Neurology, Johns Hopkins Medicine, 1800 Orleans St. Baltimore, MD 21287 USA.
Charlene Gamaldo, Department of Neurology, Johns Hopkins Medicine, 1800 Orleans St. Baltimore, MD 21287 USA.
Rachel M. E. Salas, Department of Neurology, Johns Hopkins Medicine, 1800 Orleans St. Baltimore, MD 21287 USA
References
- 1.Gamaldo CE, Spira AP, Hock RS, Salas RE, Mcarthur JC, David PM, Smith MT. Sleep, Function and HIV: A Multi-Method Assessment. AIDS and Behavior. 2013;17(8):2808–2815. doi: 10.1007/s10461-012-0401-0. http://doi.org/10.1007/s10461-012-0401-0. [DOI] [PMC free article] [PubMed] [Google Scholar]
- 2.Buysse DJ, Reynolds CF, III, Monk TH, Berman SR, Kupfer DJ. The Pittsburgh Sleep Quality Index (PSQI): A new instrument for psychiatric practice and research. Psychiatry Research. 1989;28(2):193–213. doi: 10.1016/0165-1781(89)90047-4. http://doi.org/10.1016/0165-1781(89)90047-4. [DOI] [PubMed] [Google Scholar]
- 3.Reid S, Dwyer J. Insomnia in HIV infection: A systematic review of prevalence, correlates, and management. Psychosomatic Medicine. 2005;67(2):260–269. doi: 10.1097/01.psy.0000151771.46127.df. http://doi.org/10.1097/01.psy.0000151771.46127.df. [DOI] [PubMed] [Google Scholar]
- 4.Moyle G, Fletcher C, Brown H, Mandalia S, Gazzard B. Changes in sleep quality and brain wave patterns following initiation of an efavirenz-containing triple antiretroviral regimen. HIV Medicine. 2006;7(4):243–247. doi: 10.1111/j.1468-1293.2006.00363.x. http://doi.org/10.1111/j.1468-1293.2006.00363.x. [DOI] [PubMed] [Google Scholar]
- 5.Iber C, Ancoli-Israel S, Chesson A, Quan SF for the American Academy of Sleep Medicine. The AASM manual for the scoring of sleep and associated events: Rules, terminology and technical specifications. Westchester, IL: American Academy of Sleep Medicine; 2007. [Google Scholar]
- 6.Bokil H, Andrews P, Kulkarni JE, Mehta S, Mitra P. Chronux: A Platform for Analyzing Neural Signals. Journal of Neuroscience Methods. 2010;192(1):146–151. doi: 10.1016/j.jneumeth.2010.06.020. [DOI] [PMC free article] [PubMed] [Google Scholar]
- 7.8.2.3.3. Likelihood ratio tests. n.d Retrieved March 28, 2015, from http://www.itl.nist.gov/div898/handbook/apr/section2/apr233.htm.