ABSTRACT
Over the last years, the zebrafish (Danio rerio) has become a key model organism in genetic and chemical screenings. A growing number of experiments and an expanding interest in zebrafish research makes it increasingly essential to automatize the distribution of embryos and larvae into standard microtiter plates or other sample holders for screening, often according to phenotypical features. Until now, such sorting processes have been carried out by manually handling the larvae and manual feature detection. Here, a prototype platform for image acquisition together with a classification software is presented. Zebrafish embryos and larvae and their features such as pigmentation are detected automatically from the image. Zebrafish of 4 different phenotypes can be classified through pattern recognition at 72 h post fertilization (hpf), allowing the software to classify an embryo into 2 distinct phenotypic classes: wild-type versus variant. The zebrafish phenotypes are classified with an accuracy of 79–99% without any user interaction. A description of the prototype platform and of the algorithms for image processing and pattern recognition is presented.
KEYWORDS: feature detection, high-throughput screening, pattern recognition, support vector machine, zebrafish (Danio rerio)
Introduction
Today the zebrafish has become a key model organism in drug discovery,1 toxicity2 and genetic screening.3 The genetic parallels to humans, combined with the advantage of external fertilization and a fast developmental process as well as its translucent body, make the zebrafish ideal for scientific research. Many assays use a large number of zebrafish embryos for high-throughput screening (HTS) using automation technology and computer aided feature detection.4-10 For such screens, often transgenic embryos or embryos with different morphological features have to be separated from wild-type embryos. To increase the throughput in these screens, it is essential to automatize this sorting step using image analysis methods
This study focuses on 4 different zebrafish phenotypes at 72 h post fertilization (hpf). The first phenotype is the wild-type, which also forms the standard template for classification. The second phenotype consists of 1-phenyl 2- thiourea (PTU)-treated wild-type embryos, which do not form melanin and appear brighter than the wild-type.11
The third phenotype consists of transgenic kita-HRAS expressing embryos, which exhibit an over-proliferation of melanocytes and develop melanoma at later stages. Therefore, these embryos/larvae have an increased amount of pigment and hence a darker phenotype than the wild-type.12 The fourth phenotype consists of homozygous rx3-mutants which lack eyes.13
A prototype platform for image acquisition was designed and image-sets (360 images per line) of the 4 different phenotypes were generated. Algorithms for feature extraction and pattern recognition were designed according to the phenotypical differences and applied to the image-sets. The classification task was hampered by variations in intensity of the features. This variation in the test data sets was used to improve the robustness and thereby the applicability of the algorithms to newly acquired data.
The sorting-methods used so far are mostly manual and thus time-consuming. The method proposed here is able to acquire images of zebrafish and automatically classify them according to their phenotype. In the long-term, the aim is to develop a high-throughput system that is capable of sorting hatched larval zebrafish (48–72 hpf) by phenotype.
Method
The automated classification process is a pipeline composed of image acquisition, feature extraction and pattern recognition. For the image acquisition, a prototype platform to generate numerous and comparable test images was designed. In order to get meaningful results during the feature extraction step, the implemented approaches differ with respect to the phenotypes which were to be distinguished from wild-types. In the final step a fault-tolerant and non-linear radial basis function (RBF) support vector machine (SVM) to train a classifier which is capable of classifying newly acquired images was used.
Image acquisition
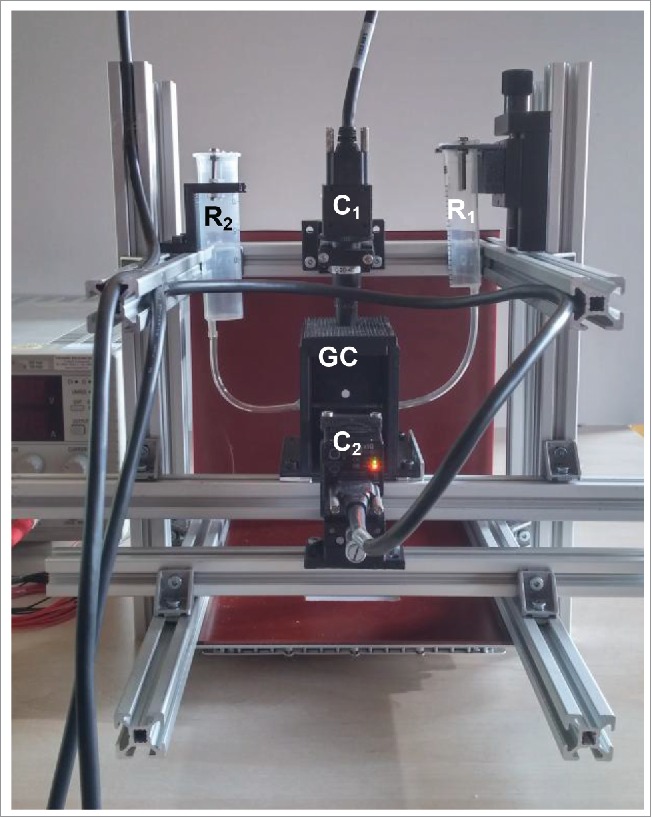
The image acquisition is carried out using a prototype platform which consists of 2 cameras that are arranged in a 90° angle to each other (Fig. 1). The optical axes intersect in a cuvette, in which the zebrafish are located and positioned. This way enabled the generation of 1 transversal and 1 sagittal image per acquisition, thereby avoiding the need for manual orientation of the zebrafish inside the glass capillary. Using both images of 1 acquisition enabled to generate a classifier while using only 1 feature. Image properties can be manipulated through lighting and aperture settings. The image sets consist of around 160 acquisitions per phenotype.
Figure 1.

Image acquisition setup: R1&R2 = reservoirs with zebrafish embryos, C1&C2 = cameras, perpendicular to each other, GC = glass capillary in a dark chamber.
Feature extraction
During feature extraction the aim was to convert the phenotypical features of the zebrafish that are expressed in the images into a numeric representation. Depending on the phenotypes to be discriminated different approaches were used. The PTU treated zebrafish and the kita-HRAS zebrafish are analyzed in accordance to their pigmentation and thus gray value distribution of the image. In contrast, the rx3-mutant is with respect to the eye segment of the image.
Pigmentation
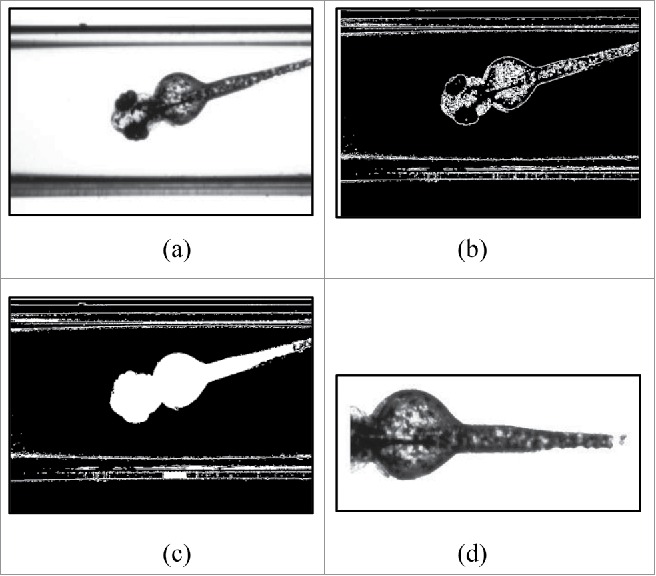
In Fig. 2a, an example input image with cuvette borders and a transversal view of a zebrafish is shown. The image is converted into a binary image by edge detection using a Sobel-filter. The threshold for the edge detection is calculated from the mean gray value of the input image and multiplied by 0.5 to sensitize the edge detection. Furthermore, the binary image is dilated in order to close gaps in the edge contour (Fig. 2b). The closed contours are then filled (Fig. 2c). The segment with the highest amount of pixels is assumed to be the “zebrafish” segment. It is oriented according to the horizontal line and the outline is smoothed. The position of the head is determined quantifying the amount of pixels, and is thereafter separated from the “zebrafish” segment (Fig. 2d). Next, a histogram of the segment is generated. The obtained gray-value-bins of the histogram are subtracted from the corresponding gray-value-bins of a standardized wild-type histogram. The numerical value obtained in this manner is further used as the feature for the pattern recognition.14
Figure 2.

Steps for feature extraction (pigmentation): (A) Input image; (B) Binary image after edge detection and dilation; (C) Binary image after filling; (D) Output segment for feature extraction after segment selection, smoothing and orientation.
Eyesegment
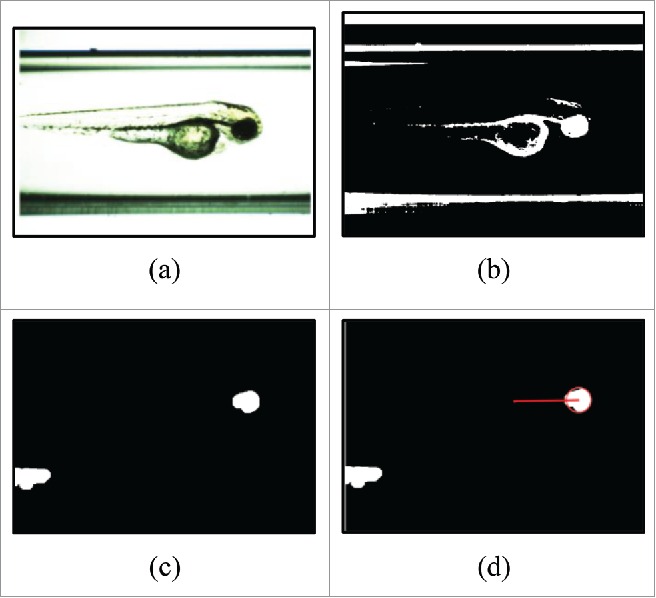
In Figure 3a, an example input image with cuvette borders and a sagittal view of a zebrafish is shown. The image is converted into a binary image by thresholding and subsequently inverted (Fig. 3b). Remaining small structures are filtered out by a morphological opening – dilation after erosion with the same mask size. Furthermore, segments with less than 3000 pixels are removed (Fig. 3c). In the next step, a geometric similarity measurement which uses the length of the major and minor axis to ascertain the best fitting segment according to zebrafish eye geometry is applied. To further minimize the influence of “eye” segment misclassifications, the position of the “eye” segment inside the “zebrafish” segment is taken into account. Therefore, the distance between the center of the “eye” segment and the center of the “zebrafish” segment is determined (Fig. 3d). For images in which no “eye” segment is found, mostly in the case of rx3-mutants, the distance is set to zero. The distance generated in this manner is further used as the feature for the pattern recognition.
Figure 3.

Steps for feature extraction considering the eye segment: (A) An input image; (B) Inverted binary image through thresholding; (C) Binary image after opening and selection; (D) Output distance for feature extraction after geometric similarity measurement and location condition of the eye segment.
Pattern recognition
In the training of classifiers a fault-tolerant and non-linear radial basis function support vector machine with cross-validation was used. With a set of training images, each referring to 1 of the phenotypes to be classified, a SVM creates a decision rule that is able to classify new images. This is done by generating a hyper-plane that separates the 2 phenotype patterns (i.e. wild-type and phenotype of interest). New images are then classified based on which side of the hyper-plane they fall on. Control variables to adjust the SVM are “C”, the weighting parameter for the fault-tolerance and “σ”, the RBF Kernel-parameter.15
Resulting classifiers
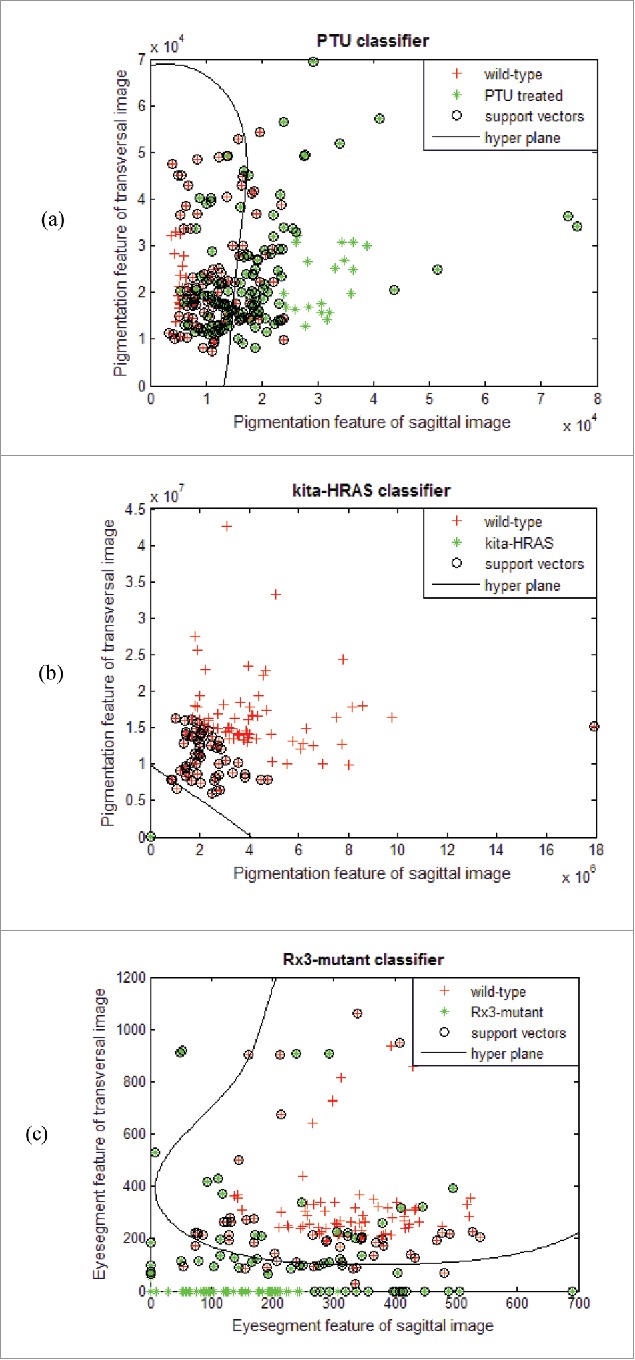
Figure 4 presents the generated classifiers. Each data point represents a single acquisition. The acquisitions are further colored according to their phenotype membership. The nonlinear projection of the hyper-plane is shown as black curve. On the x-axis the feature of the sagittal image is plotted. The transversal feature is plotted on the y-axis, respectively. The PTU classifier achieves a classification rate of 79 %. Misclassifications are mostly due to shadows forming inside the cuvette and different developmental stages in terms of pigment formation and hence gray value expression (Fig. 4a).
Figure 4.

Showing the classifiers with the hyper-plane projections, support vectors and extracted data points from feature ex- traction. Wild-type zebrafish are colored red, the targeted phenotype is colored green. (A) PTU classifier; (B) Kita-HRAS classifier; (C) rx3-mutant classifier.
The kita-HRAS classifier achieves a classification rate of 99%. This is due to the closely located data points of the kita-HRAS line. The reason for this can be found in the increased amount of pigmentation and hence decisively smaller gray values (Fig. 4b).
The rx3-mutant classifier achieves a classification rate of 89%. The data clouds are well separated. Misclassifications mostly arise from inaccurately generated segments and resulting mistakes in distance calculation (Fig. 4c).
Conclusions
A prototype platform has been introduced, with a 2-camera-system, using which classifications of early stage (72hpf) zebrafish phenotypes can be carried out automatically. Classifiers that are able to assign images of different zebrafish to 1 out of 2 phenotypes are proposed. The classification always takes place between the wild-type and another pigment or eye phenotype. The algorithms and classifiers are brought together in a GUI providing an interface for the mechanical sorting machine, which is being developed. Future work includes the application on larger datasets and different phenotypes, dealing with the variation of features used for discrimination, and further developments on the sorting system regarding both software and hardware.
Disclosure of potential conflicts of interest
No potential conflicts of interest were disclosed.
References
- [1].Zon LI, Peterson RT. In vivo drug discovery in the zebrafish. Nat Rev Drug Discov 2005; 4.1:35-44; http://dx.doi.org/ 10.1038/nrd1606 [DOI] [PubMed] [Google Scholar]
- [2].Hill AJ, Teraoka H, Heideman W, Peterson RE. Zebrafish as a model vertebrate for investigating chemical toxicity. Toxicol Sci 2005; 86:6-19; PMID:15703261; http://dx.doi.org/ 10.1093/toxsci/kfi110 [DOI] [PubMed] [Google Scholar]
- [3].Haffter P, Nüsslein-Volhard C. Large scale genetics in a small vertebrate, the zebrafish. Inter J Dev Biol 1996; 40:221-227. [PubMed] [Google Scholar]
- [4].Pylatiuk C, Sanchez D, Mikut R, Alshut R, Reischl M, Hirth S, Rottbauer W, Just S. Automatic zebrafish heartbeat detection and analysis for zebrafish embryos. Zebrafish 2014; 11:379-383; PMID:25003305; http://dx.doi.org/ 10.1089/zeb.2014.1002 [DOI] [PMC free article] [PubMed] [Google Scholar]
- [5].Mikut R, Dickmeis T, Driever W, Geurts P, Hamprecht FA, Kausler BX, Ledesma-Carbayo MJ, Marée R, Mikula K, et al.. Automated processing of zebrafish imaging data: a survey. Zebrafish 2013; 10:401-421; PMID:23758125; http://dx.doi.org/ 10.1089/zeb.2013.0886 [DOI] [PMC free article] [PubMed] [Google Scholar]
- [6].Ishaq O, Negri J, Bray MA, Pacureanu A, Peterson RT, Wählby C. Automated quantification of zebrafish tail deformation for high-throughput drug screening. Proceedings of the IEEE International Symposium on In Biomedical Imaging 2013; 902-905. [DOI] [PMC free article] [PubMed] [Google Scholar]
- [7].Alshut R, Legradi J, Liebel U, Yang L, van Wezel J, Strähle U, Mikut R, Reischl M. Methods for automated high-throughput toxicity testing using zebrafish embryos. KI 2010: Advances in Artificial Intelligence 2010; 6359:219-226. [Google Scholar]
- [8].Peravali R, Gehrig J, Giselbrecht S, Lütjohann DS, Hadzhiev Y, Müller F, Liebel U. Automated feature detection and imaging for high-resolution screening of zebrafish embryos. Biotechniques 2011; 50.5:319. [DOI] [PubMed] [Google Scholar]
- [9].Marcato D, Alshut R, Breitwieser H, Mikut R, Strähle U, Pylatiuk C. An automated and high-throughput photomotor response platform for chemical screens. Proceedings of the IEEE Engineering in Medicine and Biology Conference 2015; 7728-7731. [DOI] [PubMed] [Google Scholar]
- [10].Jeanray N, Marée R, Pruvot B, Stern O, Geurts P, Wehenkel L, Muller M. Phenotype classification of zebrafish embryos by supervised learning. PLoS One 2015; 10.1:e0116989; http://dx.doi.org/ 10.1371/journal.pone.0116989 [DOI] [PMC free article] [PubMed] [Google Scholar]
- [11].Karlsson J, von Hofsten J, Olsson P-E. Generating transparent zebrafish: a refined method to improve detection of gene expression during embryonic development. Mar Biotechnol 2001; 3:522-527; PMID:14961324; http://dx.doi.org/ 10.1007/s1012601-0053-4 [DOI] [PubMed] [Google Scholar]
- [12].Santoriello C, Gennaro E, Anelli V, Distel M, Kelly A, Köster RW, Hurlstone A, Mione M. Kita driven expression of oncogenic hras leads to early onset and highly penetrant melanoma in zebrafish. PLoS One 2010; 5:e15170; PMID:21170325; http://dx.doi.org/ 10.1371/journal.pone.0015170 [DOI] [PMC free article] [PubMed] [Google Scholar]
- [13].Rojas-Muñoz A, Dahm R, Nüsslein-Volhard C Chokh/rx3 specifies the retinal pigment epithelium fate independently of eye morphogenesis. Dev. Biol. 2005; 288:348-362; http://dx.doi.org/ 10.1016/j.ydbio.2005.08.046 [DOI] [PubMed] [Google Scholar]
- [14].Szeliski R. Computer vision Science & Business Media 2011; Algorithms and Applications Springer. [Google Scholar]
- [15].Cortes C, Vapnik V. Support-vector networks. Mach Learn 1995; 20:273. [Google Scholar]


