

Abstract
Objective:
To evaluate differences in amyloid deposition in a community-based cohort without dementia by age, sex, race, education, and APOE ε4 allele status.
Methods:
Recruited from the longitudinal Atherosclerosis Risk in Communities study, 329 participants without dementia, ages 67–88 years, were imaged using florbetapir PET at 3 US community sites (Washington County, Maryland; Forsyth County, North Carolina; and Jackson, Mississippi). Standardized uptake value ratios (SUVRs) were calculated; global cortical SUVR >1.2 was evaluated as the primary outcome. Age, race, sex, education level, and number of APOE ε4 alleles were evaluated in multivariable models including vascular risk factors, brain white matter hyperintensity and total intracranial volume, and cognitive status.
Results:
A total of 141 of the participants (43%) were black. In multivariable models, odds of elevated SUVR was increased in participants with increasing age (odds ratio [OR] 1.63, 95% confidence interval [CI] 1.01–2.65 per 10 years of age) and black race (OR 2.08, 95% CI 1.23–3.51) but did not differ by educational level. Each ε4 allele was associated with increased odds of elevated SUVR (OR 2.65, 95% CI 1.61–4.39).
Conclusions:
In this community-based cohort without dementia, florbetapir uptake is associated with older age and APOE genotype. Black race was associated with higher SUVR, after adjusting for demographics, vascular risk factors, cognitive status, white matter hyperintensity volume, and APOE genotype, with effect sizes nearing those seen for APOE ε4. Replication of these findings is needed in other cohorts, and reasons for and consequences of these observed differences by race warrant further study.
The prevailing hypothesis behind the pathophysiology of Alzheimer disease (AD) focuses on the accumulation of brain amyloid in β-amyloid (Aβ) plaques as a critical mechanism. Use of PET ligands that bind to Aβ allows for the evaluation of Aβ in persons with or without clinical symptoms. Although a recent meta-analysis reported positive amyloid scans in 10% of healthy 50- to 90-year-old participants, and in 27% of similarly aged adults with mild cognitive impairment (MCI),1 few studies in persons of European extraction2,3 have evaluated patterns of Aβ deposition using PET, and none in black participants, to our knowledge. Using Aβ imaging in a biracial cohort would allow further exploration of racial disparities in dementia etiology.
Dementia is more prevalent in blacks than in whites,4–6 although AD-type neuropathologic findings are found on autopsy with equal prevalence in both groups.7,8 Thus, a larger component of dementia in blacks may be due to vascular disease, supported by recent data showing that black decedents with clinical AD more frequently have mixed pathologies on autopsy,9 or that some autopsy series select racial groups differentially. Further, typical AD risk factors may have different associations with clinical AD in blacks than in whites. Carrying an APOE ε4 gene has stronger associations with AD in whites than in blacks,10 with some studies even suggesting that, in black patients, AD is independent of APOE genotype.11
In this study of participants without dementia from the Atherosclerosis Risk in Communities (ARIC) study, we evaluated differences in amyloid deposition, using florbetapir PET, by race, age, sex, education, and APOE status. We hypothesized that racial differences, if observed, would be modified by APOE status, with the specific hypothesis that APOE’s effect would be less in black compared to white participants.
METHODS
Participant inclusion.
Participants were recruited for this ancillary study (ARIC-PET) from the ARIC–Neurocognitive Study (ARIC-NCS), a major ancillary to the ARIC study. The ARIC study included, at its onset in 1987–1989, 15,792 individuals from 4 US communities12; participants completed 5 in-person visits. The fifth visit, ARIC-NCS (2011–2013), was attended by 6,538 surviving participants, and included an extensive neuropsychological battery,13 with informant interview in a subset, and expert classification of cognitive status (normal/MCI/dementia14). A subset of ARIC-NCS participants without a contraindication to MRI and meeting one of the following criteria was selected for a brain MRI: (1) prior brain MRI during the ARIC brain MRI ancillary visit15; (2) low cognitive scores on a thorough neuropsychological battery from ARIC-NCS or decline on scores on tests repeated at ARIC visits 2, 4, and ARIC-NCS; or (3) an age-stratified random sample of participants with normal cognition.13
Among the participants with a brain MRI during the 2011–2013 visit, participants from 3 ARIC sites (Jackson, Mississippi; Washington County, Maryland; and Forsyth County, North Carolina) were recruited into the ARIC-PET study. Only participants without dementia were included (dementia defined as [1] expert committee diagnosis of dementia when adjudication was complete; but, if not complete, when [2] Clinical Dementia Rating [CDR] sum-of-boxes score16 was >3, [3] Functional Activities Questionnaire [FAQ] was >5, or [4] Mini-Mental State Examination [MMSE] score was <19 [blacks] or <21 [whites]). Additional exclusion criteria included heavy current alcohol use, renal dysfunction (creatinine >2 mg/dL), or prolonged QT-c interval (>450 ms).
Standard protocol approvals, registrations, and patient consents.
This study was approved by each institution's institutional review board. All participants provided written informed consent.
Brain MRI and PET.
MRI scans were performed on 3T MRI scanners at each site; magnetization-prepared rapid gradient echo (MPRAGE) was used for coregistration of PET images. Other details about MRI analysis, completed at the ARIC MRI Reading Center (Mayo Clinic), are reported elsewhere.13 Briefly, white matter hyperintensity (WMH) volume was measured quantitatively from fluid-attenuated inversion recovery (FLAIR) sequences, using an in-house algorithm,17 and total intracranial volume (TIV) was measured on MPRAGE, using Freesurfer version 5.1.
Florbetapir PET scans were performed at each site, within 1 year of the brain MRI. Isotope was injected through a butterfly needle, with images acquired from 50 to 70 minutes for a 20-minute (4 × 5 minutes) uptake scan. Images were transferred to the PET image analysis center (Johns Hopkins), where they were reviewed qualitatively for incidental findings, image quality, and quantified for standardized uptake value ratios (SUVRs). Images were coregistered to the MRI, spatially normalized, and 34 total regions of interest (ROIs) were manually drawn and applied to the SUVR images. Further details about image acquisition and processing are provided in the e-Methods on the Neurology® Web site at Neurology.org.
Although SUVR values were available for each ROI,18 the primary analysis uses a global cortical measure of β-amyloid (Aβ), calculated as a weighted average of the following regions: orbitofrontal, prefrontal, and superior frontal cortices, lateral temporal, parietal, and occipital lobes, precuneus, and anterior and posterior cingulates. The SUVR value was dichotomized at the sample median of SUVR >1.2, due to the highly skewed distribution of the data. The Wilcoxon rank-sum test was used to evaluate differences in non-normally distributed, continuous, global cortical SUVR by race for univariate analyses.
Demographic and covariate information.
Primary variables included age at the time of the scan (in years), sex, education level (less than high school [HS]; HS/general educational development/vocational school; any college, graduate, or professional school), race (both self-reported at ARIC visit 1), and APOE genotype (TaqMan assay; Applied Biosystems, Foster City, CA). Status of hypertension (systolic blood pressure >140 mm Hg, diastolic blood pressure >90 mm Hg, or use of antihypertensive medications) and diabetes (fasting glucose ≥126 mg/dL, nonfasting glucose ≥200 mg/dL, HbA1c ≥ 6.5, self-report of physician-diagnosed diabetes, or use of oral diabetes medications or insulin) at the time of ARIC-NCS was included in multivariable models, as were WMH and TIV, by brain MRI.
Cognitive status was defined according to expert-adjudicated cognitive outcomes, available at analysis although not complete at the time of ARIC-PET recruitment. A panel of experts classified all cases determined to be not normal and a subset of cases determined to be normal by computerized algorithm, by current standard criteria,19,20 as normal, MCI, or dementia. Detailed methods are described elsewhere.14 The algorithm and expert review included neuropsychological battery test Z scores, MMSE score, CDR sum-of-boxes, change in neuropsychological scores for the 3 repeated tests, and FAQ. MMSE at ARIC-NCS was included as a covariate in sensitivity analyses. For participants who did not complete the full MMSE (e.g., due to a physical impairment), a prorated score was derived from the total number of items actually completed.
Statistical analysis.
Stata SE version 13 for Macintosh (College Station, TX) was used for all analyses. Descriptive analyses were conducted including box plots for visualization of group comparisons. Florbetapir uptake was evaluated as a dichotomous (SUVR >1.2) measure in logistic regression models. Initial models included age, sex, race, educational level, and APOE status; subsequent models added hypertension and diabetes, and finally, MCI status, WMH volume, and TIV.
Secondary analyses evaluated the specific ROIs contained within the global measure and that were identified as frequent locations for amyloid deposition. We also evaluated effect modification of the APOE genotype on the amyloid outcome by race and by sex.
Sensitivity analyses included restricting the sample to individuals with (1) normal cognition (excluding MCI); (2) no APOE ε4 alleles; and (3) using other published florbetapir thresholds (1.1121 and 1.1022).
RESULTS
Of the 346 participants in ARIC-PET, 2 were excluded for nonwhite or nonblack race, 14 for missing covariates (5: APOE, 3: hypertension status, 5: diabetes status; 1: TIV), and 1 who was eventually classified as having dementia, leaving 329 participants without dementia, representing 95% of the ARIC-PET sample.
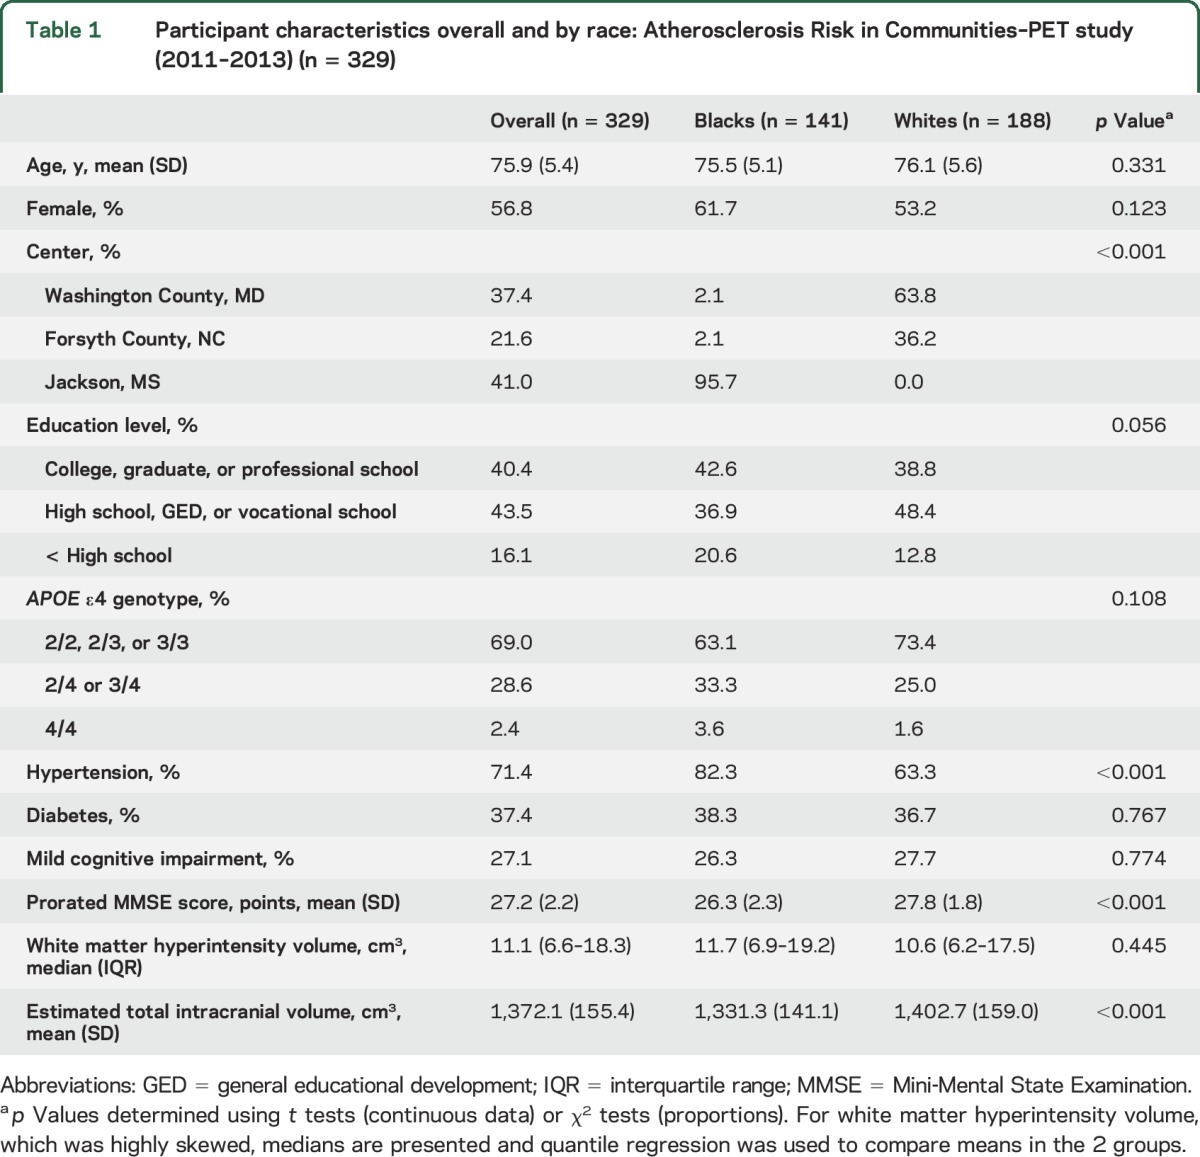
More participants were female than male, with a mean age of 75.9 years (table 1). Fewer white participants had <HS education than black participants, and fewer had MCI. Black and white participants had similar proportions of MCI by expert review. Median florbetapir uptake for the entire sample was 1.20 (interquartile range [IQR] 1.12–1.40; range 0.95–2.31). Of the 89 participants with MCI, 68.5% had positive florbetapir scans (SUVR >1.2), with higher rates by age: 67.2% of participants aged 67 to <80, vs 72.0% of participants aged 80–89 years. In cognitively normal adults, 45.0% had positive florbetapir uptake, with similar rates by age group.
Table 1.
Participant characteristics overall and by race: Atherosclerosis Risk in Communities–PET study (2011–2013) (n = 329)
Analysis of florbetapir uptake by demographic variables.
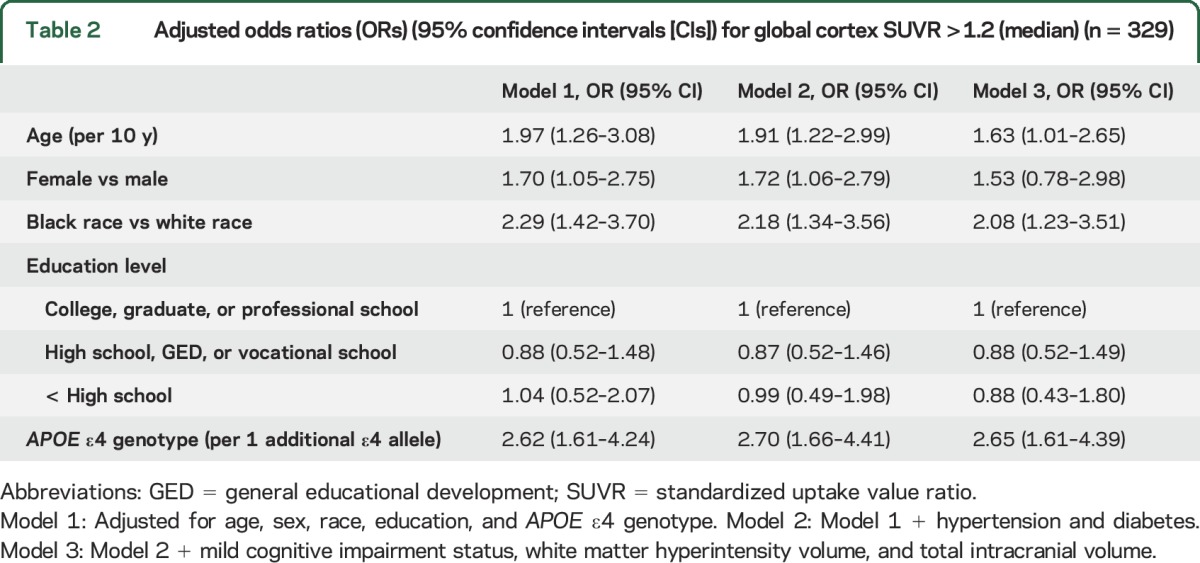
Florbetapir uptake was higher in participants who were older, female, carried 1 or 2 APOE ε4 alleles, and who were black (table 2). There was no association with education level. This pattern persisted despite adjustment for hypertension, diabetes, cognitive status (MCI yes/no), and markers of brain microvascular disease in the models (table 2). Black participants had a >2-fold increased odds of elevated SUVR in the fully adjusted model. Global cortical SUVR, analyzed continuously, was higher in blacks (p < 0.0001).
Table 2.
Adjusted odds ratios (ORs) (95% confidence intervals [CIs]) for global cortex SUVR >1.2 (median) (n = 329)
Secondary and sensitivity analyses.
Secondary analysis of separate ROIs showed similar associations between race and elevated SUVR as for the global cortical SUVR measure, although race associations in the lateral temporal lobe and parietal lobe did not reach statistical significance (figure 1).
Figure 1. Adjusted odds ratios for elevated florbetapir associated with black race.

The odds ratios and their 95% confidence intervals are displayed for black race for a standardized uptake value ratio >1.2. A weighted cortical average (“global”) as well as specific regions of interest are shown. Adjusted for age, sex, education, APOE ε4 genotype, hypertension, diabetes, white matter hyperintensities, total intracranial volume, and mild cognitive impairment status.
We found no statistical evidence of an interaction of sex × APOE (p = 0.22) or race × APOE (p = 0.85). Global cortical SUVR increased in persons with race and increasing APOE ε4 alleles (figure 2).
Figure 2. Unadjusted box plots of global cortex standardized uptake value ratio (SUVR) by race and APOE ε4 genotype.

When racial differences in global cortical SUVR were analyzed in separate cognitive groups (figure 3), differences by race were no longer statistically significant (p = 0.07) in the fully adjusted model among the group of individuals with normal cognition (n = 240; table e-1), although differences by race remained in the MCI group (n = 89; table e-2). When MMSE was included instead of MCI, race differences were not statistically significant in the fully adjusted model (odds ratio [OR] 1.53, 95% confidence interval [CI] 0.88–2.66).
Figure 3. Unadjusted box plots of global cortex standardized uptake value ratio (SUVR) by race and mild cognitive impairment status.

When the primary analysis was repeated only among participants without any ε4 alleles (n = 227), black race remained significantly associated in the fully adjusted model (OR 1.96, 95% CI 1.06–3.62), with loss of statistical significance for sex (p = 0.23) and age (p = 0.26). Within each APOE genotype, blacks had higher median SUVR values than whites (figure e-1).
Evaluation of other SUVR cutpoints as previously used in the literature demonstrated similar associations for race (for SUVR >1.11: model 3 OR 3.22, 95% CI 1.64–6.30) and female sex (OR 2.22, 95% CI 1.03–4.79), although APOE genotype and age were no longer statistically significant (table e-3).
DISCUSSION
This population-based biracial study of 329 adults without dementia aged 67–88 years supports prior work in whites,1 demonstrating higher amyloid deposition, measured by florbetapir PET, in persons with older age, and with a dose response for APOE ε4. We also found that blacks (representing nearly half of our cohort) had a 2-fold increase in rates of elevated Aβ compared to whites. This represents an important extension of prior studies, with clear implications for a possible mechanism underlying observed disparities23 in dementia risk.
We have previously postulated that differences in rates of cognitive decline and dementia by race are due to differences in prevalence of vascular risk factors.24 The present results do not support significant confounding by current levels of vascular risk factors (including brain microvascular disease) as an explanation for race disparities in amyloid, although we acknowledge that vascular effects are more likely related to decades of exposure than just current levels; the higher brain amyloid levels we find may still be due to longstanding uncontrolled vascular risk factors that are disproportionately present in black compared to white participants, or vascular brain changes not reflected by our markers. To argue that disproportionate vascular disease explains the current findings, vascular risk factors would need to have contributed to elevated brain amyloid, despite lack of evidence for this association.25,26 If vascular and AD processes are simply additive, one would have predicted, in this study of individuals without dementia, less brain amyloid in blacks compared to whites (since more vascular disease is found in blacks, and, to have relatively normal cognition, high amounts of both amyloid and vascular disease would be unlikely). Thus, the vascular mechanism story does not fit the current observations. The failure to see a race × APOE interaction argues against differences in APOE ε4 carriage as an explanation, as do our findings demonstrating the race differences to be unchanged in the sample without any ε4 alleles.
APOE ε4 is the strongest genetic risk factor for AD,27 and our data support its importance as a risk factor for amyloid deposition, even in cognitively normal persons. Our results are consistent with prior reports of a 2- to 3.5-fold increased odds of amyloid positivity in cognitively normal carriers with one ε4 allele.1 We see similar increased risk, however, in both races, without effect modification by APOE; further, results remain similar in participants without any ε4 alleles. Other studies have suggested that APOE is a less important risk factor for dementia in blacks than in whites,28 although ε4 carriage is more common in blacks than in whites.29 Age's effect on amyloid levels is slightly lower than what has been described elsewhere,1,30 but our overall levels of amyloid positivity are higher than those in other reports.1
Studies of clinical dementia are potentially biased by errors in diagnosis by race, not always fully corrected by use of available racially appropriate normative cognitive data. This potential for diagnostic error, however, cannot explain our observed differences in amyloid deposition, particularly since MCI in this study was defined using our own robust ARIC-derived race-based norms.31 Social factors such as access to medical care and socioeconomic status may play an important role in management of vascular risk factors or identification of cognitive decline, but unless absence of these factors directly acts to reduce amyloid deposition, differences in social factors are not likely to directly cause differences in amyloid deposition by race. Other potential explanations for racial disparities in dementia rates, and in this study, amyloid deposition rates, include genetic or metabolomic differences by race. The fact that our results no longer show significantly elevated levels in blacks when MMSE scores are included as a covariate, or among persons with normal cognition, is likely a result of the restricted range of cognitive ability resulting from adjusting the comparison for the MMSE or limiting it to those with normal cognition. Since brain amyloid affects cognition, comparing blacks with whites at the same or similar levels of cognition necessarily reduces the black-white difference in amyloid. But such a finding does not affect the interpretation or our primary result, which suggests that blacks, at least in our sample, have more amyloid than whites, providing a partial explanation of their higher dementia prevalence. However, it is also possible that the relationship of amyloid to cognition is subtly different by race. This difference might require a larger study to demonstrate accurately, and would require demonstration of a similar racial difference in other cohorts, which would improve the generalizability of the current findings.
We also found sex differences in florbetapir uptake, in contrast to prior studies,3 with more amyloid positivity in women. Some epidemiologic data have suggested that age-adjusted incidence of AD is higher in women,32 and our data suggest that this may be through more amyloid deposition. Estrogen may reduce aggregation of Aβ, so the decrease in estrogen during menopause might contribute to a rise in Aβ.33 Interestingly, although others have reported higher amyloid in persons with higher educational attainment,1 we did not confirm this association in our study. Further, our own work in ARIC has suggested that level of educational attainment does not influence rate of cognitive decline itself, but rather raises the absolute level of scores, a manifestation of cognitive reserve, and might delay the age at which an individual passes below a threshold and is diagnosed with dementia.34 These florbetapir data support that hypothesis, suggesting that the effect of education on healthy brain aging may be via cognitive reserve rather than through direct changes in amyloid deposition. Our education-adjusted data do not suggest that the race differences observed are the effects of differences in education.
Although we observe a pattern of higher florbetapir uptake in black participants in our study, most of these participants were from a single site (Jackson, Mississippi), which may lead to concern that the effect could be geographic rather than specific to race. Although numbers are small at the other 2 sites (Forsyth County, North Carolina, and Washington County, Maryland), each recruited 3 black participants, and florbetapir values were not significantly elevated in those 6 participants compared to white participants at those field centers. Black participants from these other 2 sites had a median florbetapir SUVR of 1.20 (IQR 1.11–1.64), compared to 1.25 (IQR 1.16–1.51) among black participants from Jackson (and 1.17 [IQR 1.10–1.31] in white participants). Given these small numbers, we cannot rule out the possibility that the effect we are seeing is due to some highly influential exposures unique to the Jackson site. Further studies will need to evaluate diverse populations from other communities.
In addition, we acknowledge a concern that our community-based cohort may not be fully representative: participants recruited into the ARIC-PET study represent those who are able to tolerate MRI and PET scans, who also might be more health-aware. However, we anticipate that, if anything, this might bias our population towards the null of any observed associations. It is clear, however, that individuals in our study who are black differ from those who are white with regards to underlying comorbidities and cognitive performance. Although we have attempted to account for this potential confounding by adjusting for vascular risk factors and markers, as well as cognitive status, we acknowledge that these are observational data so confounding may remain. Finally, we chose an SUVR cutpoint of 1.2 based on our sample median, whereas varying numbers have been used in the literature1; however, our primary findings for race and sex persist despite evaluation of lower cutpoints.
Our study supports prior work demonstrating higher amyloid uptake in persons of older age without dementia who carry 1 or 2 APOE ε4 alleles, and, importantly, suggests higher amyloid in blacks. The mechanism and consequences of this observed difference in amyloid by race requires further study, since, if repeated in additional cohorts, this may reflect differences in risk factor prevalence or control, or may be due to some unsuspected exposures or a genetic predisposition to amyloid deposition. It will be important to further investigate in future studies if the relationship between amyloid and cognition differs by race. Given the existing disparities noted in dementia rates, these data may ultimately help reduce these disparities through analysis of mechanism.
Supplementary Material
ACKNOWLEDGMENT
The authors thank the staff and participants of the ARIC study for their contributions and Andrew Crabb, MS, for oversight of the central data transfer and research PACS at Johns Hopkins University.
GLOSSARY
- Aβ
β-amyloid
- AD
Alzheimer disease
- ARIC
Atherosclerosis Risk in Communities
- ARIC-NCS
Atherosclerosis Risk in Communities–Neurocognitive Study
- CDR
Clinical Dementia Rating
- CI
confidence interval
- FAQ
Functional Activities Questionnaire
- FLAIR
fluid-attenuated inversion recovery
- HS
high school
- IQR
interquartile range
- MCI
mild cognitive impairment
- MMSE
Mini-Mental State Examination
- MPRAGE
magnetization-prepared rapid gradient echo
- OR
odds ratio
- ROI
region of interest
- SUVR
standardized uptake value ratio
- TIV
total intracranial volume
- WMH
white matter hyperintensity
Footnotes
Supplemental data at Neurology.org
Editorial, page 454
AUTHOR CONTRIBUTIONS
Dr. Gottesman: drafting the manuscript, study concept, analysis or interpretation of data, study supervision, obtaining funding. Dr. Schneider: revising the manuscript for content, analysis or interpretation of data, statistical analysis. Dr. Zhou: revising the manuscript for content, analysis or interpretation of data. X. Chen: revising the manuscript for content, analysis or interpretation of data. Dr. Green: revising the manuscript for content, acquisition of data. Dr. Gupta: revising the manuscript for content, acquisition of data. Dr. Knopman: revising the manuscript for content, analysis or interpretation of data. Dr. Mintz: revising the manuscript for content, acquisition of data. Dr. Rahmim: revising the manuscript for content, acquisition of data. Dr. Sharrett: revising the manuscript for content, study concept or design, analysis or interpretation of data. Dr. Wagenknecht: revising the manuscript for content, study coordination. Dr. Wong: revising the manuscript for content, analysis or interpretation of data, acquisition of data, study coordination. Dr. Mosley: revising the manuscript for content, analysis or interpretation of data, study concept or design, study coordination.
STUDY FUNDING
The Atherosclerosis Risk in Communities Study is carried out as a collaborative study supported by National Heart, Lung, and Blood Institute contracts (HHSN268201100005C, HHSN268201100006C, HHSN268201100007C, HHSN268201100008C, HHSN268201100009C, HHSN268201100010C, HHSN268201100011C, and HHSN268201100012C). Neurocognitive data are collected by U01 HL096812, HL096814, HL096899, HL096902, HL096917, and the National Institute of Neurological Disorders and Stroke, with previous brain MRI examinations funded by R01-HL70825 (from the NHLBI). The ARIC-PET study is funded by the National Institute on Aging (R01AG040282). Avid Radiopharmaceuticals provided the florbetapir isotope for the study, but had no role in the study design or interpretation of results.
DISCLOSURE
R. Gottesman serves as Associate Editor for Neurology® and receives research support from the NIH. A. Schneider, Y. Zhou, X. Chen, E. Green, and N. Gupta report no disclosures relevant to the manuscript. D. Knopman previously served as Deputy Editor for Neurology; serves on a Data Safety Monitoring Board for Lundbeck Pharmaceuticals and for the DIAN study; is an investigator in clinical trials sponsored by TauRX Pharmaceuticals, Lilly Pharmaceuticals, and the Alzheimer's Disease Cooperative Study; and receives research support from the NIH. A. Mintz previously received an honorarium as a reader for Avid on florbetapir studies (through 2013). A. Rahmim, A. Sharrett, and L. Wagenknecht report no disclosures relevant to the manuscript. D. Wong has had a number of contracts with Avid and Lilly administered through Johns Hopkins University and has served as a consultant at the early stages of florbetapir development and has received radiotracer as part of research collaborations. T. Mosley reports no disclosures relevant to the manuscript. Go to Neurology.org for full disclosures.
REFERENCES
- 1.Jansen WJ, Ossenkoppele R, Knol DL, et al. Prevalence of cerebral amyloid pathology in persons without dementia: a meta-analysis. JAMA 2015;313:1924–1938. [DOI] [PMC free article] [PubMed] [Google Scholar]
- 2.Jack CR Jr, Wiste HJ, Weigand SD, et al. Age-specific population frequencies of cerebral B-amyloidosis and neurodegeneration among people with normal cognitive function aged 50–89 years: a cross-sectional study. Lancet Neurol 2014;13:997–1005. [DOI] [PMC free article] [PubMed] [Google Scholar]
- 3.Jack CR Jr, Wiste HJ, Weigand SD, et al. Age, sex, and APOE e4 effects on memory, brain structure, and B-amyloid across the adult life span. JAMA Neurol 2015;72:511–519. [DOI] [PMC free article] [PubMed] [Google Scholar]
- 4.Plassman BL, Langa KM, Fisher GG, et al. Prevalence of dementia in the United States: the aging, demographics, and memory study. Neuroepidemiology 2007;29:125–132. [DOI] [PMC free article] [PubMed] [Google Scholar]
- 5.Kuller LH, Lopez OL, Newman A, et al. Risk factors for dementia in the cardiovascular health cognition study. Neuroepidemiology 2003;22:13–22. [DOI] [PubMed] [Google Scholar]
- 6.Caplan LR. Cerebral ischemia and infarction in blacks. In: Gillum RF, Gorelick PB, Cooper ES, editors. Stroke in Blacks. Basel: Karger; 1999:7–18. [Google Scholar]
- 7.Riudavets MA, Rubio A, Cox C, Rudow G, Fowler D, Troncoso JC. The prevalence of Alzheimer neuropathologic lesions is similar in blacks and whites. J Neuropathol Exp Neurol 2006;65:1143–1148. [DOI] [PubMed] [Google Scholar]
- 8.Sandberg G, Stewart W, Smialek J, Troncoso JC. The prevalence of neuropathological lesions of Alzheimer's disease is independent of race and gender. Neurobiol Aging 2001;22:169–175. [DOI] [PubMed] [Google Scholar]
- 9.Barnes LL, Leurgans S, Aggarwal NT, et al. Mixed pathology is more likely in black than white decedents with Alzheimer dementia. Neurology 2015;85:528–534. [DOI] [PMC free article] [PubMed] [Google Scholar]
- 10.Farrer LA, Cupples LA, Haines JL, et al. Effects of age, sex, and ethnicity on the association between apolipoprotein E genotype and Alzheimer disease: a meta-analysis: APOE and Alzheimer Disease Meta Analysis Consortium. JAMA 1997;278:1349–1356. [PubMed] [Google Scholar]
- 11.Tang MX, Stern Y, Marder K, et al. The APOE-epsilon4 allele and the risk of Alzheimer disease among African Americans, whites, and Hispanics. JAMA 1998;279:751–755. [DOI] [PubMed] [Google Scholar]
- 12.The ARIC Investigators. The Atherosclerosis Risk in Communities (ARIC) Study: design and objectives. Am J Epidemiol 1989;129:687–702. [PubMed] [Google Scholar]
- 13.Knopman DS, Griswold ME, Lirette ST, et al. Vascular imaging abnormalities and cognition: mediation by cortical volume in nondemented individuals: Atherosclerosis Risk in Communities–Neurocognitive Study. Stroke 2015;46:433–440. [DOI] [PMC free article] [PubMed] [Google Scholar]
- 14.Knopman DS, Gottesman RF, Sharrett AR, et al. Mild cognitive impairment and dementia prevalence: the Atherosclerosis Risk in Communities Neurocognitive Study (ARIC-NCS). Alzheimers Dement 2016;2:1–11. [DOI] [PMC free article] [PubMed] [Google Scholar]
- 15.Knopman DS, Penman AD, Catellier DJ, et al. Vascular risk factors and longitudinal changes on brain MRI. Neurology 2011;76:1879–1885. [DOI] [PMC free article] [PubMed] [Google Scholar]
- 16.Morris JC. The Clinical Dementia Rating (CDR): current version and scoring rules. Neurology 1993;43:2412–2414. [DOI] [PubMed] [Google Scholar]
- 17.Jack CJ, O'Brien PC, Rettman DW, et al. Flair histogram segmentation for measurement of leukoaraiosis volume. J Magn Reson Imaging 2001;14:668–676. [DOI] [PMC free article] [PubMed] [Google Scholar]
- 18.Buckner RL, Snyder AZ, Shannon BJ, et al. Molecular, structural, and functional characterization of Alzheimer's disease: evidence for a relationship between default activity, amyloid, and memory. J Neurosci 2005;25:7709–7717. [DOI] [PMC free article] [PubMed] [Google Scholar]
- 19.Albert MS, DeKosky ST, Dickson D, et al. The diagnosis of mild cognitive impairment due to Alzheimer's disease: recommendations from the National Institute on Aging–Alzheimer's Association workgroups on diagnostic guidelines for Alzheimer's disease. Alzheimers Dement 2011;7:270–279. [DOI] [PMC free article] [PubMed] [Google Scholar]
- 20.McKhann GM, Knopman DS, Chertkow H, et al. The diagnosis of dementia due to Alzheimer's disease: recommendations from the National Institute on Aging–Alzheimer's Association workgroups on diagnostic guidelines for Alzheimer's disease. Alzheimers Dement 2011;7:263–269. [DOI] [PMC free article] [PubMed] [Google Scholar]
- 21.Landau SM, Mintun MA, Joshi AD, et al. Amyloid deposition, hypometabolism, and longitudinal cognitive decline. Ann Neurol 2012;72:578–586. [DOI] [PMC free article] [PubMed] [Google Scholar]
- 22.Joshi AD, Pontecorvo MJ, Clark CM, et al. Performance characteristics of amyloid PET with florbetapir F 18 in patients with Alzheimer’s disease and cognitively normal subjects. J Nucl Med 2012;53:378–384. [DOI] [PubMed] [Google Scholar]
- 23.Husaini BA, Sherkat DE, Moonis M, Levine R, Holzer C, Cain VA. Racial differences in the diagnosis of dementia and in its effects on the use and costs of health care services. Psychiatr Serv 2003;65:92–96. [DOI] [PubMed] [Google Scholar]
- 24.Gottesman RF, Fornage M, Knopman DS, Mosley TH. Brain aging in African-Americans: the Atherosclerosis Risk in Communities (ARIC) experience. Curr Alzheimer Res 2015;12:607–613. [DOI] [PMC free article] [PubMed] [Google Scholar]
- 25.Roberts RO, Knopman DS, Cha RH, et al. Diabetes and elevated hemoglobin A1c levels are associated with brain hypometabolism but not amyloid accumulation. J Nucl Med 2014;55:759–764. [DOI] [PMC free article] [PubMed] [Google Scholar]
- 26.Vemuri P, Lesnick TG, Przybelski SA, et al. Vascular and amyloid pathologies are independent predictors of cognitive decline in normal elderly. Brain 2015;138:761–771. [DOI] [PMC free article] [PubMed] [Google Scholar]
- 27.Corder EH, Saunders AM, Strittmatter WJ, et al. Gene dose of apolipoprotein E type 4 allele and the risk of Alzheimer's disease in late onset families. Science 1993;261:921–923. [DOI] [PubMed] [Google Scholar]
- 28.Kuller LH, Shemanski L, Manolio T, et al. Relationship between ApoE, MRI findings, and cognitive function in the Cardiovascular Health Study. Stroke 1998;29:388–398. [DOI] [PubMed] [Google Scholar]
- 29.Barnes LL, Bennett DA. Cognitive resilience in APOE*e4 carriers: is race important? Nat Reviews Neurol 2015;11:190–191. [DOI] [PMC free article] [PubMed] [Google Scholar]
- 30.Scheinin NM, Wikman K, Jula A, et al. Cortical 11C-PIB uptake is associated with age, APOE genotype, and gender in “healthy aging.” J Alzheimers Dis 2014;41:193–202. [DOI] [PubMed] [Google Scholar]
- 31.Schneider AL, Sharrett AR, Gottesman RF, et al. Normative data for 8 neuropsychological tests in older blacks and whites from the Atherosclerosis Risk in Communities (ARIC) study. Alzheimer Dis Assoc Disord 2015;29:32–44. [DOI] [PMC free article] [PubMed] [Google Scholar]
- 32.Seshadri S, Wolf PA, Beiser A, et al. Lifetime risk of dementia and Alzheimer's disease: the impact of mortality on risk estimates in the Framingham Study. Neurology 1997;49:1498–1504. [DOI] [PubMed] [Google Scholar]
- 33.Lin KA, Doraiswamy PM. When Mars versus Venus is not a cliche: gender differences in the neurobiology of Alzheimer's disease. Front Neurol 2014;5:288. [DOI] [PMC free article] [PubMed] [Google Scholar]
- 34.Gottesman RF, Rawlings AM, Sharrett AR, et al. Impact of differential attrition in the association of education with cognitive change over 20 years of follow-up: the ARIC–Neurocognitive Study. Am J Epidemiol 2014;179:956–966. [DOI] [PMC free article] [PubMed] [Google Scholar]
Associated Data
This section collects any data citations, data availability statements, or supplementary materials included in this article.