

Abstract
Transcriptional enhancers direct precise on-off patterns of gene expression during development. To explore the basis for this precision, we conducted a high-throughput analysis of the Otx-a enhancer, which mediates expression in the neural plate of Ciona embryos in response to fibroblast growth factor (FGF) signaling and a localized GATA determinant. We provide evidence that enhancer specificity depends on submaximal recognition motifs having reduced binding affinities (“suboptimization”). Native GATA and ETS (FGF) binding sites contain imperfect matches to consensus motifs. Perfect matches mediate robust but ectopic patterns of gene expression. The native sites are not arranged at optimal intervals, and subtle changes in their spacing alter enhancer activity. Multiple tiers of enhancer suboptimization produce specific, but weak, patterns of expression, and we suggest that clusters of weak enhancers, including certain “superenhancers,” circumvent this trade-off in specificity and activity.
The Orthodenticle homeobox (Otx) gene is crucial for patterning the anterior neural plate of vertebrate embryos (1, 2). In the invertebrate chordate Ciona intestinalis, Ci-Otx is activated in the anterior neural plate and dorsal nerve chord by a maternal GATA transcription factor and localized fibroblast growth factor (FGF) signaling (Fig. 1A) (3–6). A minimal 69–base pair (bp) enhancer (Otx-a) was previously identified in Ciona. It contains three GATA binding sites and two ETS sites, which mediate induction by FGF signaling (Fig. 1B) (3–5). This Otx-a enhancer recapitulates the native expression pattern in the neural plate when attached to a minimal promoter and reporter gene and electroporated into Ciona embryos (Fig. 1C). The enhancer has a regulatory logic that is pervasively used in development; namely, a broadly distributed tissue (ectoderm) determinant (GATA) works in concert with a localized signaling event to mediate restricted expression within a subset of the total sites of FGF signaling (7–9).
Fig. 1. Otx-a enhancer is activated by FGF and maternal determinant GATA.
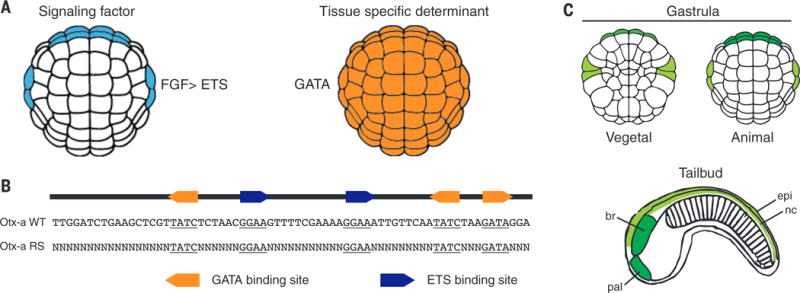
(A) Expression of direct activators of Otx-a enhancer, FGF and GATA. (B) The sequence of the 69-bp Otx-a enhancer, showing the five core binding sites: three for GATA (GATA) and two for ETS (GGAA). The core binding site is defined as the 4 bp recognized by all GATA and ETS transcription factors, and they are the major sites of protein-DNA interactions (32, 33). RS Otx-a enhancer variants retain all five core binding sites with the remaining sequence (49 bp) randomized. (C) Otx-a enhancer drives expression in the a6.5 (dark green) and b6.5 (light green) lineages, beginning at gastrulation. In the tailbud stage, a6.5 cells give rise to the anterior brain (br) and palps (pal), and b6.5 cells give rise to the dorsal nerve cord (nc), dorsal epidermis (epi), and two tail muscle cells (not shown).
To identify all of the sequences important for enhancer activity, we created a library of random synthetic (RS) Otx-a enhancer variants that retain each of the five core recognition sequences, GATA and GGAA, in their native positions (Fig. 1B). Each of these variants was attached to a green fluorescent protein (GFP) coding sequence and unique 30-bp barcode tag, which uniquely identifies each of the different enhancer variants. The fog promoter was used for these assays because it produces the lowest background expression among the different Ciona promoters tested in previous transgene assays (3). The resulting library has a complexity of 2.5 × 10⁶ unique RS enhancer–barcode tag combinations, and we determined each enhancer-barcode association by deep sequencing. The library was electroporated into thousands of fertilized eggs. Once embryos developed to the late gastrula stage, RNA was extracted, reverse-transcribed, amplified by polymerase chain reaction (PCR), and sequenced to identify transcribed barcodes (fig. S1).
Among the RNA barcodes, 163,708 unique barcodes exhibited expression, and 21,799 of these produced the same or higher levels of activity than the wild-type (WT) enhancer, ≥4 normalized reads per million (RPM) (table S1). The vast majority (hundreds of thousands) of enhancer variants failed to produce significant expression, less than one RPM. We randomly selected and individually tested 34 of the RS Otx-a enhancer variants with ≥4 RPM by electroporation. Of the 34 enhancer variants, 24 mediated restricted expression of the GFP reporter gene (table S2). As negative controls, we tested four enhancers that displayed little or no expression of the barcode tag RNAs (≤0.01 RPM), and none produced detectable GFP signals when individually tested by electroporation into embryos (table S2).
Computational analysis of the ~20,000 active enhancers identified short sequence motifs flanking the core GATA and ETS binding sites as the key determinants of enhancer function (fig. S2). Additional sequences residing outside these regions—including those conserved in the Otx-a enhancer of the distantly related Ciona savignyi—were not recovered among the active enhancers in our high-throughput screen. The consensus flanking sequences that were identified, CCGGAARY and SMGATAAS, have 0.98 and 0.96 Pearson coefficient correlations, with the highest-affinity-position weight matrices identified by high-throughput binding assays for orthologous ETS and GATA transcription factors in flies, mice, and humans (10–13) (figs. S3 and S4).
To determine the sufficiency of the flanking motifs, we created “up” mutations, by restoring the activities of inactive derivatives of Otx-a enhancer variants, including RS1 (Fig. 2B). This enhancer contains all five core GATA and ETS binding sites but completely lacks consensus or WT flanking motifs and shares just 13 of 49 matches outside the core sites. Nonetheless, modifying the flanking regions of RS1 to mimic the extended binding motifs of the WT enhancer (RS1wt) is sufficient to restore full activity (Fig. 2D, compare with 2A).
Fig. 2. Suboptimal binding sites are sufficient for tissue-specific expression.
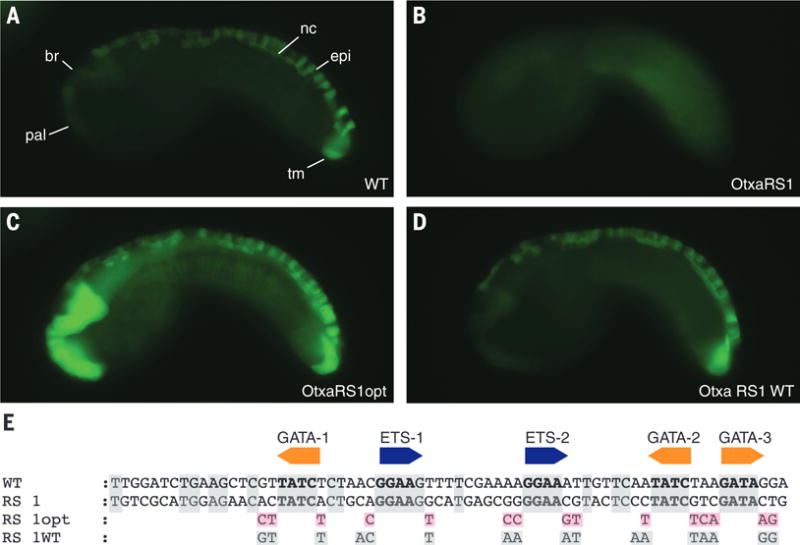
(A) Embryo electroporated with WT Otx-a enhancer; GFP can be seen in the anterior brain (br), palps (pal), dorsal nerve cord (nc), dorsal midline epidermis (epi), and two tail muscle cells (tm). (B) Embryo electroporated with Otx-a RS1, a synthetic enhancer variant identified in our screen that shows no GFP expression. (C) Embryo electroporated with Otx-a RS1opt, with all five core sites changed to have optimized flanking sequence; expression can be seen in endogenous location and in notochord, mesenchyme, endoderm, and posterior brain. (D) Embryo electroporated with Otx-a RS1 WT with all five core sites mutated to have WT flanking sequences; expression can be seen in endogenous Otx-a location only. (E) Sequence of WT, Otx-a RS1, Otx-a RS1 opt, and Otx-a RS1 WT enhancer variants. Gray boxes highlight bases conserved in WT Ciona intestinalis Otx-a sequence; pink boxes highlight bases that were changed to match identified “optimal” flanking motifs. All images were taken at the same exposure time, 500 ms.
The WT Otx-a enhancer contains imperfect matches to the “optimal” GATA and ETS extended motifs identified in this study and previous binding assays (figs. S2 to S4) (10, 11, 13). It is possible to determine relative binding affinities of the native sites by analyzing the frequency of selected sequences using high-throughput binding data sets (13–15). The GATA-1, -2, and -3 binding sites contain 0.8, 0.3, and 0.4 relative binding frequencies, respectively, whereas the ETS-1 and -2 sites contain 0.6 and 0.4 relative binding frequencies, respectively (fig. S5). In other words, each of the GATA and ETS motifs has, on average, half the binding affinity of the optimal motifs. We therefore consider the native binding sites as suboptimal because they have submaximal binding affinities.
To determine whether the native, suboptimal binding motifs are an important feature of normal Otx-a enhancer activity, we created perfect matches for all five GATA and ETS binding motifs (Fig. 2C). The resulting enhancer, RS1opt, mediates intense expression in the neural plate, as well as weaker expression in a variety of ectopic tissues, including the notochord. Similar results were obtained by creating optimal flanking sequences in the WT enhancer (fig. S6).
These results suggest that too many optimal motifs cause the Otx-a enhancer to capture additional sites of FGF signaling, such as the notochord. Thus, “suboptimization” of the enhancer for transcription factor binding appears to be essential for restricted activity in the neural plate. Recent studies also provide evidence that suboptimal binding sites are important for the specificity of Hox transcription factors in Drosophila development (16). Such sites are also an important feature of the classical eve stripe 2 enhancer (17) and other developmental enhancers (18, 19). In all of these examples, an excess of optimal binding sites leads to a loss of specificity and ectopic sites of gene expression.
Having observed the importance of suboptimal GATA and ETS motifs, we asked whether the spacing between motifs might also be sub-optimized. The importance of spacing in developmental gene expression is controversial (18, 20–22), although induction of the interferon-b enhanceosome by viral infections relies on stringently spaced binding sites (23, 24). Our high-throughput analysis of the Otx-a enhancer identified the sufficiency of ETS and GATA motifs for correct expression and thus provided an opportunity to determine whether spacing of these motifs influences enhancer function. For example, the 5′ GATA-1 and 3′ GATA-2 motifs are located 10 bp and 13 bp, respectively, from central ETS-1 and ETS-2 sites within the Otx-a enhancer. It is conceivable that only one, or neither, of these intervals represents an optimal spacing. To explore this possibility, we created 21 Otx-a enhancer derivatives (tables S3 and S4) with altered spacing between GATA-1 and ETS-1, ETS-1 and ETS-2, and ETS-2 and GATA-2 (Fig. 3). For simplicity, many of these experiments were done in the context of a minimal 46-bp enhancer that contained a single 3′ GATA site.
Fig. 3. Suboptimization of spacing and flanking motifs is required for tissue specificity.
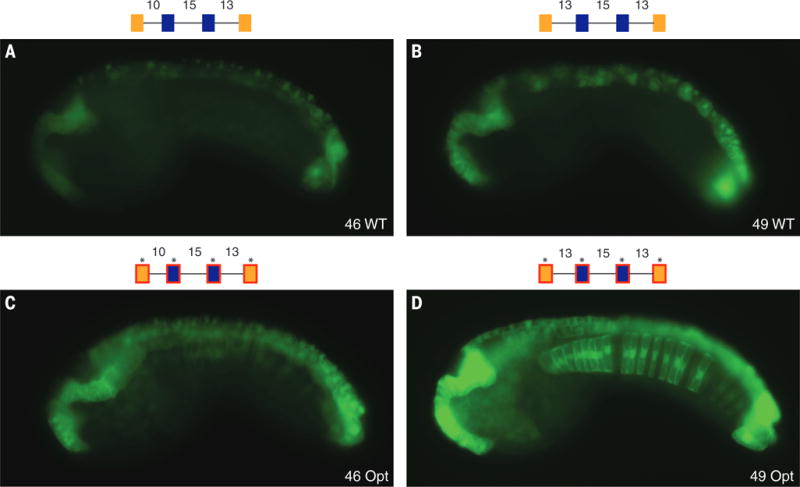
Spacing between adjacent binding sites is important for tissue specificity. (A) Embryo electroporated with Otx-a 46 (10-15-13 spacing); GFP expression can be seen in WT location. (B) Embryo electroporated with Otx-a 49 (13-15-13 spacing); addition of 3 bp between GATA1 and ETS1 leads to a significant increase in neural expression; and no ectopic expression is seen. (C) Embryo electroporated with Otx-a 46opt (10-15-13 spacing and all five core sites with optimized flanking); expression can be seen at higher levels in WT location and ectopic expression in notochord, mesenchyme, and posterior brain. (D) Embryo electroporated with Otx-a 49opt (13-15-13 spacing and all five core sites with optimized flanking); this enhancer shows strong expression in the endogenous neural location and ectopic expression in the notochord, posterior neural tube, and endoderm (see also fig. S12). All images were taken at the same exposure time, 250 ms.
The most striking finding of these studies is that enhancer activity is augmented by inserting 3 bp between the GATA-1 and ETS-1 sites (Fig. 3B, compare with 3A; this was also done on two other synthetic variants—see figs. S7 to S9). Quantitative PCR assays indicate a consistent threefold increase in the levels of expression after insertion of 3 bp (fig. S7). In contrast, reducing the distance of the 3′ ETS-2–GATA-2 linkage from 13 to 10 bp causes a marked reduction in the levels of expression (fig. S8). All of the tested changes in the spacing of the two ETS sites result in reduced expression (figs. S10 and S11).
Of all the manipulations tested, increasing the distance of GATA-1 and ETS-1 from 10 bp to 13 bp is the only one that causes a significant increase in enhancer activity. We observed increases for both the WT 69-bp enhancer and smaller derivatives (Fig. 3 and figs. S7 to S9). It is unlikely that these increases are due to the fortuitous introduction of an unknown activator element, because different trinucleotide motifs were inserted between the GATA-1 and ETS-1 sites. We therefore conclude that the native Otx-a enhancer contains a mixture of good and poor arrangements of linked binding sites. This sub-optimization might be the basis for the general view that most developmental enhancers lack “grammar” and are composed of random arrangements of clustered binding sites.
We next asked whether the improved arrangement of binding sites augments activity only within the native site of expression, the neural plate, or also increases expression in other tissues. As shown previously (Fig. 2C), optimized GATA and ETS sites result in ectopic sites of expression (Fig. 3C). Combining these motifs with optimal spacing (13-15-13 rather than 10-13-15) creates a “supercharged” enhancer that drives robust expression in a variety of tissues, including the neural plate, anterior endoderm, and notochord, which are known sites of FGF signaling (5, 6, 25–28) (Fig. 3D; see also fig. S12). These results emphasize the importance of both the quality and spacing of binding sites in enhancer activity.
In summary, we have presented evidence that regulatory specificity is achieved through multiple tiers of enhancer suboptimization. This suboptimization is balanced across the Otx-a enhancer. For example, the highest-affinity binding sites, GATA-1 and ETS-1, exhibit suboptimal spacing (10 bp rather than 13 bp), whereas the weakest sites, ETS-2 and GATA-2, display optimal spacing (13 bp). Suboptimal binding motifs and spacing attenuate enhancer activity, ensuring restricted expression within specific tissues. Optimal sites and spacing cause ectopic activation in other tissues (fig. S13). In the case of the Otx-a enhancer, this ectopic induction is due to the pleiotropic activities of the FGF signaling pathway. Our study suggests that enhancer evolution is not driven by strongest binding, but is constrained by the need for specificity. This constraint obscures critical properties of enhancer design, such as the spacing of linked binding sites. Suboptimization results in specific, but weak, enhancer activities. Multimerization of suboptimal enhancers leads to augmented levels of expression within specific tissues (fig. S14). We therefore propose that clusters of weak enhancers, such as certain superenhancers (29–31), circumvent this trade-off in specificity and activity and generate robust but localized patterns of expression.
Supplementary Material
Acknowledgments
Sequencing data for this project have been deposited in the National Center for Biotechnology Information, NIH, Sequencing Read Archive (www.ncbi.nlm.nih.gov/sra), PRJNA294804. We thank M. Chung, C. Anderson, E. Wagner, J. Lyons, and members of the Levine and Rokhsar labs for helpful discussions. This work was supported by grants from the NIH (GM46638 and NS076542). There are no conflicts of interest to declare. Author contributions are as follows: E.K.F., D.S.R., and M.S.L. devised experiments; E.K.F. and K.M.O. performed experiments; W.Z. designed and executed bioinformatics analysis; A.J.B. conducted bioinformatics analyses; and E.K.F., D.S.R., and M.S.L. wrote the paper. All authors discussed the results and commented on the manuscript. M.S.L., D.S.R., and E.K.F. have filed a patent application (no. 62/169,458) that relates to the production of enhancer variants using the SEL-Seq method.
Footnotes
SUPPLEMENTARY MATERIALS
www.sciencemag.org/content/350/6258/325/suppl/DC1
Materials and Methods
References (34–41)
REFERENCES AND NOTES
- 1.Acampora D, et al. Brain Res Bull. 2005;66:410–420. doi: 10.1016/j.brainresbull.2005.02.005. [DOI] [PubMed] [Google Scholar]
- 2.Beby F, Lamonerie T. Exp Eye Res. 2013;111:9–16. doi: 10.1016/j.exer.2013.03.007. [DOI] [PubMed] [Google Scholar]
- 3.Rothbächer U, Bertrand V, Lamy C, Lemaire P. Development. 2007;134:4023–4032. doi: 10.1242/dev.010850. [DOI] [PubMed] [Google Scholar]
- 4.Khoueiry P, et al. Curr Biol. 2010;20:792–802. doi: 10.1016/j.cub.2010.03.063. [DOI] [PubMed] [Google Scholar]
- 5.Bertrand V, Hudson C, Caillol D, Popovici C, Lemaire P. Cell. 2003;115:615–627. doi: 10.1016/s0092-8674(03)00928-0. [DOI] [PubMed] [Google Scholar]
- 6.Hudson C, Lemaire P. Mech Dev. 2001;100:189–203. doi: 10.1016/s0925-4773(00)00528-1. [DOI] [PubMed] [Google Scholar]
- 7.Barolo S, Posakony JW. Genes Dev. 2002;16:1167–1181. doi: 10.1101/gad.976502. [DOI] [PubMed] [Google Scholar]
- 8.Oosterveen T, et al. Proc Natl Acad Sci USA. 2013;110:7330–7335. doi: 10.1073/pnas.1220010110. [DOI] [PMC free article] [PubMed] [Google Scholar]
- 9.Guss KA, Nelson CE, Hudson A, Kraus ME, Carroll SB. Science. 2001;292:1164–1167. doi: 10.1126/science.1058312. [DOI] [PubMed] [Google Scholar]
- 10.Wei GH, et al. EMBO J. 2010;29:2147–2160. doi: 10.1038/emboj.2010.106. [DOI] [PMC free article] [PubMed] [Google Scholar]
- 11.Badis G, et al. Science. 2009;324:1720–1723. doi: 10.1126/science.1162327. [DOI] [PMC free article] [PubMed] [Google Scholar]
- 12.Jolma A, et al. Cell. 2013;152:327–339. doi: 10.1016/j.cell.2012.12.009. [DOI] [PubMed] [Google Scholar]
- 13.Nitta KR, et al. eLife. 2015;4:e04837. [Google Scholar]
- 14.Hume MA, Barrera LA, Gisselbrecht SS, Bulyk ML. Nucleic Acids Res. 2015;43:D117–D122. doi: 10.1093/nar/gku1045. [DOI] [PMC free article] [PubMed] [Google Scholar]
- 15.Zhang H, Levine M, Ashe HL. Genes Dev. 2001;15:261–266. doi: 10.1101/gad.861201. [DOI] [PMC free article] [PubMed] [Google Scholar]
- 16.Crocker J, et al. Cell. 2015;160:191–203. doi: 10.1016/j.cell.2014.11.041. [DOI] [PMC free article] [PubMed] [Google Scholar]
- 17.Small S, Kraut R, Hoey T, Warrior R, Levine M. Genes Dev. 1991;5:827–839. doi: 10.1101/gad.5.5.827. [DOI] [PubMed] [Google Scholar]
- 18.Swanson CI, Schwimmer DB, Barolo S. Curr Biol. 2011;21:1186–1196. doi: 10.1016/j.cub.2011.05.056. [DOI] [PMC free article] [PubMed] [Google Scholar]
- 19.Jiang J, Levine M. Cell. 1993;72:741–752. doi: 10.1016/0092-8674(93)90402-c. [DOI] [PubMed] [Google Scholar]
- 20.Lusk RW, Eisen MB. PLOS Genet. 2010;6:e1000829. doi: 10.1371/journal.pgen.1000829. [DOI] [PMC free article] [PubMed] [Google Scholar]
- 21.Kulkarni MM, Arnosti DN. Mol Cell Biol. 2005;25:3411–3420. doi: 10.1128/MCB.25.9.3411-3420.2005. [DOI] [PMC free article] [PubMed] [Google Scholar]
- 22.Swanson CI, Evans NC, Barolo S. Dev Cell. 2010;18:359–370. doi: 10.1016/j.devcel.2009.12.026. [DOI] [PMC free article] [PubMed] [Google Scholar]
- 23.Muhlethaler-Mottet A, et al. J Biol Chem. 2004;279:40529–40535. doi: 10.1074/jbc.M406585200. [DOI] [PubMed] [Google Scholar]
- 24.Panne D, Maniatis T, Harrison SC. Cell. 2007;129:1111–1123. doi: 10.1016/j.cell.2007.05.019. [DOI] [PMC free article] [PubMed] [Google Scholar]
- 25.Shi W, Levine M. Development. 2008;135:931–940. doi: 10.1242/dev.011940. [DOI] [PubMed] [Google Scholar]
- 26.Yasuo H, Hudson C. Dev Biol. 2007;302:92–103. doi: 10.1016/j.ydbio.2006.08.075. [DOI] [PubMed] [Google Scholar]
- 27.Stolfi A, Wagner E, Taliaferro JM, Chou S, Levine M. Development. 2011;138:5429–5439. doi: 10.1242/dev.072108. [DOI] [PubMed] [Google Scholar]
- 28.Wagner E, Levine M. Development. 2012;139:2351–2359. doi: 10.1242/dev.078485. [DOI] [PMC free article] [PubMed] [Google Scholar]
- 29.Whyte WA, et al. Cell. 2013;153:307–319. doi: 10.1016/j.cell.2013.03.035. [DOI] [PMC free article] [PubMed] [Google Scholar]
- 30.Hnisz D, et al. Cell. 2013;155:934–947. doi: 10.1016/j.cell.2013.09.053. [DOI] [PMC free article] [PubMed] [Google Scholar]
- 31.Li Q, Peterson KR, Fang X, Stamatoyannopoulos G. Blood. 2002;100:3077–3086. doi: 10.1182/blood-2002-04-1104. [DOI] [PMC free article] [PubMed] [Google Scholar]
- 32.Clore GM, Bax A, Omichinski JG, Gronenborn AM. Structure. 1994;2:89–94. doi: 10.1016/s0969-2126(00)00011-3. [DOI] [PubMed] [Google Scholar]
- 33.Kodandapani R, et al. Nature. 1996;380:456–460. doi: 10.1038/380456a0. [DOI] [PubMed] [Google Scholar]
Associated Data
This section collects any data citations, data availability statements, or supplementary materials included in this article.