

Abstract
Activator protein‐1 (AP‐1) is a transcriptional factor that regulates the expression of various genes associated with tumor invasion and migration. The purpose of our study was to assess the therapeutic effects of a novel selective AP‐1 inhibitor, T‐5224, in preventing lymph node metastasis in head and neck squamous cell carcinoma (HNSCC) in an orthotopic mouse model. We assessed the effect of T‐5224 on HNSCC cell invasion, migration, proliferation, and MMP activity by carrying out an in vitro study using an invasion assay, scratch assay, WST‐8 assay, and gelatin zymography. We also observed morphological changes in HNSCC cells by time‐lapse microscopy. Furthermore, cervical lymph node metastasis was assessed using an orthotopic tumor model of human oral squamous cell carcinoma cells (HSC‐3‐M3) injected in the tongue of a BALB/c nude mouse. T‐5224 (150 mg/kg) or vehicle was given orally every day for 4 weeks. Animals were killed and assessed for lymph node metastasis by H&E staining of resected lymph nodes. T‐5224 significantly inhibited the invasion, migration, and MMP activity of HNSCC cells in a dose‐dependent manner; there was no significant influence on cell proliferation. The antimetastatic effect of T‐5224 was also confirmed in our animal study. The rate of cervical lymph node metastasis in the model was 40.0% in the T‐5224‐treated group (n = 30) versus 74.1% in the vehicle‐treated group (n = 27; P < 0.05). In conclusion, T‐5224 inhibited the invasion and migration of HNSCC cells in vitro, and prevented lymph node metastasis in head and neck cancer in an animal model.
Keywords: Cell adhesion and motility, invasion and metastasis, metastasis inhibition, metastasis‐related gene
Head and neck squamous cell carcinoma (HNSCC) is the seventh most frequent cancer in the world, affecting over 680 000 patients annually.1 Despite recent therapeutic advances in the locoregional control of HNSCC, the current 5‐year survival rate is only 50–60%.2 Among the prognosis‐predictive factors of HNSCC, lymph node metastasis is a major risk factor, and controlling metastasis is still a challenging theme in the field of HNSCC treatment. In this study, we hypothesized that the selective activator protein‐1 (AP‐1) inhibitor T‐5224 might exert an antimetastatic effect on HNSCC by inhibiting the multigenic programs associated with metastasis.
Activator protein‐1 is a transcriptional factor composed of basic region‐leucine zipper protein families that are composed of the Fos family, Jun family, and cyclic AMP‐dependent transcription factor family. These proteins are dimerized to form a transcriptionally active complex. Activator protein‐1 is activated by numerous upstream signals, including MAPK, JNK, and p38, which are stimulated by growth factors, chemical or physical stimulation, cytokines, and radiation. Activated AP‐1 interacts with the tetradecanoylphorbol acetate responsive sequence element in the promoter region of target genes, and regulates various kinds of downstream gene expressions associated with cellular responses against these extracellular stimulations.3
Several reports have documented the aberrant expression of the AP‐1 protein family in human cancer specimens, including HNSCC.4, 5, 6 The DNA‐binding activity of AP‐1 is markedly elevated in cancerous tissue compared with that in normal mucosa. Furthermore, specific AP‐1 components such as c‐Jun, JunB, JunD, and c‐Fos proteins are predominantly overexpressed in human oral squamous cell carcinoma lesions.6 Because of its constitutive activation and the diverse responses it induces, AP‐1 plays a crucial role in promoting the malignant characteristics of tumor cells such as tumor cell invasion and migration.7, 8 Therefore, AP‐1 is potentially an attractive pharmacological target for cancer treatment.
T‐5224 (or 3‐{5‐[4‐(cyclopentyloxy)‐2‐hydroxybenzoyl]‐2‐[(3‐hydroxy‐1,2‐benzisoxazol‐6‐yl) methoxy] phenyl} propionic acid) is a non‐peptidic small molecule AP‐1 inhibitor that specifically inhibits the binding of AP‐1 to the AP‐1 binding site of the promoter region and was originally developed as an anti‐inflammatory drug for the treatment of rheumatoid arthritis (RA) suppressing inflammatory cytokines and MMPs without any side‐effects.9
In this study, we investigated whether this novel AP‐1 inhibitor can prevent lymph node metastasis in an animal model of HNSCC that simulates the clinical features of highly metastatic HNSCC. In addition, we examined the mechanisms underlying the antimetastatic effect of T‐5224.
Materials and Methods
Cell line and cell culture
Human oral squamous carcinoma cell lines, OSC‐1910 and HSC‐3‐M311 were used in this study. OSC‐19 was obtained from the Health Science Research Resources Bank (Japan Health Sciences Foundation; 2011). HSC‐3‐M3, a highly metastatic subline derived from HSC‐3, was kindly provided by Dr. Ota (Kanazawa Medical University; July, 2011), who established the cell line. These cell lines were grown in DMEM supplemented with 10% FBS and penicillin (50 units/mL)/streptomycin (50 μg/mL) in a humidified atmosphere (5% CO2) at 37°C.
Chemicals
T‐5224 was provided by Toyama Chemical (Tokyo, Japan). T‐5224 was dissolved in DMSO and diluted in culture medium to the target concentration for each experiment. For oral gavage administration, T‐5224 was dissolved in polyvinylpyrrolidone (PVP) solution according to the manufacturer's recommended procedure.
Invasion assay
The invasion activity of highly metastatic cell line HSC‐3‐M3 at various concentrations of T‐5224 was assessed by the Cultrex Cell Invasion Assay (Trevigen, Gaithersburg, MD, USA). HSC‐3‐M3 cells were starved for 24 h with DMEM containing 0.5% FBS. The top chamber of the cell invasion device was coated with 50 μL of 0.1× basement membrane extract solution and incubated overnight. HSC‐3‐M3 cells (5.0 × 10⁴ cells/well) were added to the top chamber with DMEM containing 0.5% FBS mixed with 0–80 μM T‐5224; DMEM with 10% FBS was added to the bottom chamber and incubated for 48 h. The bottom plate was read using a multilabel plate reader (ARVO X3; PerkinElmer Japan, Osaka, Japan). The data were compared with the standard curve to determine the fraction of invaded cells.
Cell proliferation assay
Subconfluent HSC‐3‐M3 and OSC‐19 cells in flasks were resuspended in culture media, and 4000 cells/well were seeded in a 96‐well plate. Twenty‐four hours after preincubation, various concentrations of T‐5224 (0–80 μM) were added and incubated for up to 72 h. The WST‐8 assay (Cell Counting Kit‐8; Dojindo, Tokyo, Japan) was carried out at 0, 24, 48, and 72 h after treatment with T‐5224 according to the manufacturer's instructions. The absorbance at 450 nm was measured using a multilabel plate reader.
Scratch assay
HSC‐3‐M3 and OSC‐19 cells were incubated with DMEM with 10% FBS in 100‐mm dishes. The culture surfaces on the dishes were scratched in line using a 200‐μL pipet tip and the dishes were washed with PBS. The medium was changed to DMEM supplemented with 1% FBS. The concentration of T‐5224 in the medium was 0–80 μM. Six fixed observation points were selected randomly from the scratched area, and a microscopic image was captured at each time point. Cell migration area was defined as the advanced area from the scratched border at 0 h after scratching; the area was measured using the NIH ImageJ software (http://rsb.info.nih.gov/ij/).
Morphological observation of HNSCC cells
Subconfluent HSC‐3‐M3 cells were trypsinized; 5 × 10⁵ cells were seeded in 60‐mm dishes and incubated for 24 h in DMEM with 10% FBS. The medium was then replaced with either DMEM with 0.1% DMSO or 80 μM T‐5224. After 1 h of incubation, images were obtained using a phase‐contrast microscope (Axiovert 40 CFL; Carl Zeiss, Jena, Germany) every 1 min for 20 min. Confocal fluorescent microscopic images were also obtained using a confocal laser‐scanning microscope (LSM 510 META; Carl Zeiss). Cells on glass coverslips in 60‐mm dishes were incubated and treated with T‐5224 using the same method described above. After 6 h of incubation, the cells were fixed with 4% paraformaldehyde in PBS, and F‐actin and nuclei were stained with phalloidin and DAPI, respectively.
In vivo orthotopic tumor implantation model
The study protocols were reviewed and approved by the Animal Ethical Committee of the National Defense Medical College (no. 13075) (Tokorozawa, Japan) and were carried out in accordance with the Guidelines for Proper Conduct of Animal Experiments and the US Public Health Service Policy on Humane Care and Use of Laboratory Animals. Female 5–7‐week‐old BALB/c mice were used in this study. The mice were divided into two groups: T‐5224‐treatment (n = 30) and control (n = 27). HSC‐3‐M3 (1 × 10⁵ cells) were suspended in 50 μL Hank's Balanced Salts Solution and injected in the flank of the tongue at day 0. T‐5224 was diluted in PVP solution, and T‐5224 (150 mg/kg body weight) was given orally to the mice of the treatment group every day from day 1 for 4 weeks; PVP solution (vehicle) was given to the control group. The body weight and size of tumors were also measured. The volume of tongue tumor was calculated using the formula V = 1/2 ab 2 (where V is the volume, a is the longer diameter, and b is the shorter diameter) using a digital caliper.
The animals were killed and the tongue and cervical lymph nodes were dissected. The tissues were fixed with 10% formalin and embedded in a paraffin block. Sections (4‐μm thick) were sliced using a microtome and stained with H&E. Metastasis rate was assessed by counting the number of animals with positive metastasis (at least one positive lymph node metastasis per animal) in each group.
Real‐time semiquantitative PCR
Subconfluent HSC‐3‐M3 cells were used for real‐time semiquantitative PCR. After incubation in medium containing T‐5224 for 1 h, PMA (10 ng/mL) was added, and the plates were incubated for an additional 24 h. Total RNA was isolated using an RNeasy Mini Kit (Qiagen, Valencia, CA, USA) according to the instructions. Expression of mRNA was measured using a One Step SYBR PrimeScript PLUS RT‐PCR Kit (Takara Bio, Shiga, Japan). The PCR primer sequences used for each gene were as follows: β‐actin, 5′‐TGGAGAAAATCTGGCACCAC‐3′ (forward) and 5′‐AATGGTGATGACCTGGCCGT‐3′ (reverse); MMP‐2, 5′‐TTGACGGTAAGGACGGACTC‐3′ (forward) and 5′‐ACTTGCAGTACTCCCCATCG‐3′ (reverse); and MMP‐9, 5′‐TTGACAGCGACAAGAAGTGG‐3′ (forward) and 5′‐GCCATTCACGTCGTCCTTAT‐3′ (reverse). Polymerase chain reaction was carried out with the Thermal Cycler Dice Real time system II (Takara Bio) under the following conditions: 42°C for 5 min and 95°C for 10 s, followed by 40 cycles of 95°C for 5 s and 60°C for 30 s. We used dissociation curve analysis to confirm the specificity of amplification of each product and the absence of primer dimers. β‐actin was used as a reference gene, and the relative mRNA level of each selected gene was measured by the ∆∆Ct method and was standardized by reference gene.
Gelatin zymography for measuring MMP‐2 and MMP‐9 activity
Matrix metalloproteinase activity was measured using a gelatin zymography kit (AK‐47; Cosmo Bio, Tokyo, Japan). Subconfluent cells in a culture flask were harvested and resuspended in DMEM with 1% FBS and then seeded in 60‐mm dishes. After incubation for 12 h, the medium was removed, and the cells were washed with PBS. Serum‐free DMEM with various concentrations of T‐5224 (0–80 μM) was added, and incubated for 24 h. Conditioned medium was collected and centrifuged at 400 g for 10 min at 4°C. Conditioned medium was mixed with an equal volume of sample buffer and was electrophoresed according to the instructions. Gel images were acquired digitally and processed using the ImageQuant TL software (GE Healthcare, Piscataway, NJ, USA).
In situ gelatin zymography of lingual tumor in orthotopic tumor implantation animal model
The gelatinase activities of MMP‐2 and MMP‐9 in unfixed frozen sections of HNSCC were estimated using dye‐quenched gelatin (DQ‐gelatin; Molecular Probes, Eugene, OR, USA). The orthotopic tumor implantation model with HSC‐3‐M3 cells was prepared as described above, and T‐5224 (150 mg/kg) or control vehicle was given orally every day for 21 days. Tongue tumors were resected, and 10‐μm thick serial cryostat sections were obtained. The assays were carried out according to a previously reported protocol.12 Briefly, a 1‐mg/mL DQ‐gelatin solution in sterilized water was diluted (1:10) in 1% (w/v) low gelling‐temperature agarose in PBS containing DAPI (1.0 μg/mL). Each cryostat section was covered with the DQ‐gelatin mixture (40 μL/section), and coverslips were put on the sections. After gelation at 4°C, the sections were incubated for 15 h at room temperature. The FITC fluorescence was detected at areas where DQ‐gelatin was degraded by the intrinsic gelatinase activity. To eliminate the background effect of autofluorescence of the tissue sample, serial sections without DQ‐gelatin were also observed.
Statistical analysis
All statistical analyses were carried out using the JMP 9.0 software (SAS Institute, Cary, NC, USA). Statistical significance was analyzed using Student's t‐test for the proliferation assay and in vivo tumor volume, Dunnett's tests for other in vitro experiments, and the χ2‐test for in vivo metastasis rate. P‐values less than 0.05 were considered statistically significant.
Results
Invasion activity was inhibited by T‐5224 in a dose‐dependent manner
To investigate whether treatment with T‐5224 inhibits the invasion activity of highly metastatic tumor cell line HSC‐3‐M3, we used an invasion assay system. In this assay, the bottom layer of the upper chamber is composed of a membrane coated with 0.1% basement membrane extract solution, which simulates the basement membrane in vivo. Invasion activity was assessed by counting the cells in the lower chamber, into which the cells arrived after traversing the membrane of the upper chamber. The fraction of invasion cells was 51% (±11 SD) in the control medium and 2.4% (±0.3 SD) in the medium containing 80 μM T‐5224. T‐5224 significantly inhibited the invasion activity of HSC‐3‐M3 cells in a dose‐dependent manner (Fig. 1).
Figure 1.
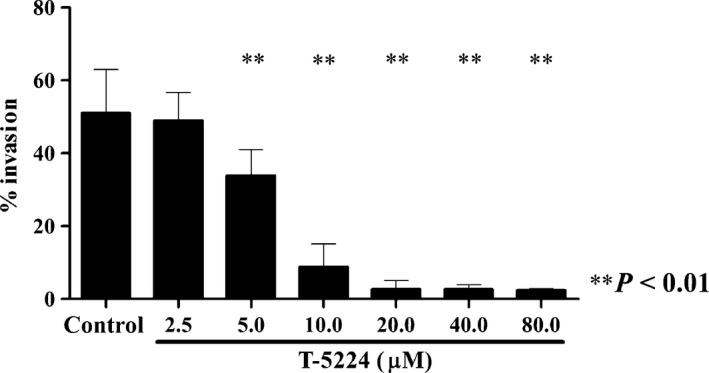
Effect of T‐5224 on the invasion activity of HSC‐3‐M3 head and neck squamous cell carcinoma cells. A basement membrane extract invasion assay was carried out to determine whether exposure to T‐5224 inhibited the invasion activity of HSC‐3‐M3 cells. T‐5224 inhibited the invasion activity in a dose‐dependent manner. Data represent the mean ± SD (n = 6). **Statistically significant differences from the controls are shown (P < 0.01).
T‐5224 had no cytotoxic activity in vitro
We assessed whether T‐5224 has inhibitory effects against tumor cell proliferation. HSC‐3‐M3 and OSC‐19 cells were incubated in T‐5224 (0–80 μM), and cell counts were carried out at 24, 48, and 72 h after treatment. T‐5224 did not significantly affect tumor cell proliferation (Fig. 2).
Figure 2.
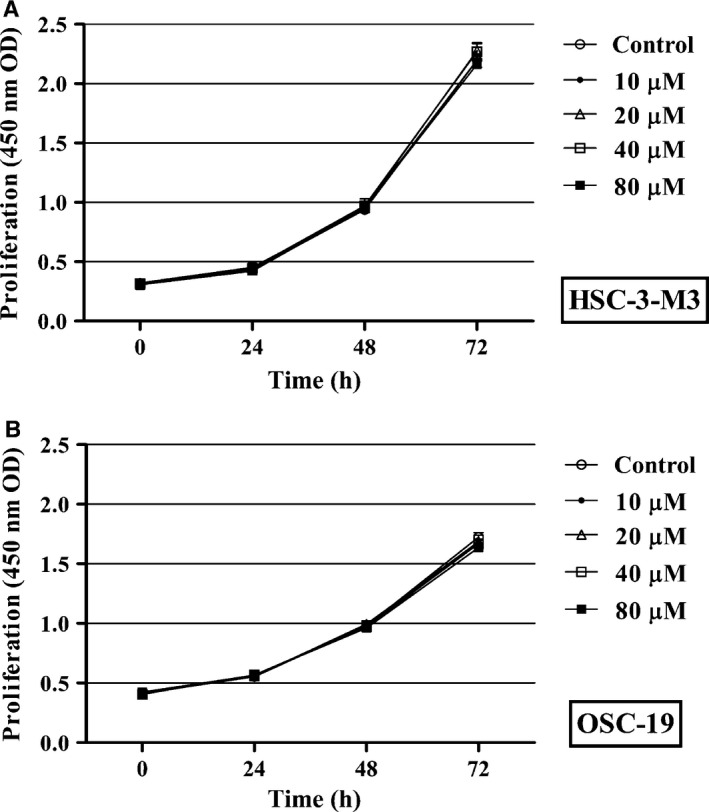
Effect of T‐5224 on tumor cell proliferation in vitro. A WST assay was used to assess the effect of T‐5224 on the proliferation of HSC‐3‐M3 (A) and OSC‐19 (B) head and neck squamous cell carcinoma cells. T‐5224 had no influence on tumor cell proliferation in vitro. Data represent the mean ± SD (n = 6).
Cell motility was significantly inhibited by T‐5224
To assess the effect of T‐5224 on the migration activity of tumor cells, we carried out scratch assays using HSC‐3‐M3 and OSC‐19 cells. Tumor cells migrated from the scratched edge, and the area over which they migrated was measured. Figure 3 shows the microscopic images and migration areas of HSC‐3‐M3 and OSC‐19 at each time point. HSC‐3‐M3 showed greater active migration ability than OSC‐19; this reflects the superior metastatic ability of HSC‐3‐M3. Cell migration was potently inhibited by T‐5224 in both cell lines in a dose‐dependent manner. Migration activity was almost completely inhibited in the medium containing 80 μM T‐5224 (Video S1).
Figure 3.
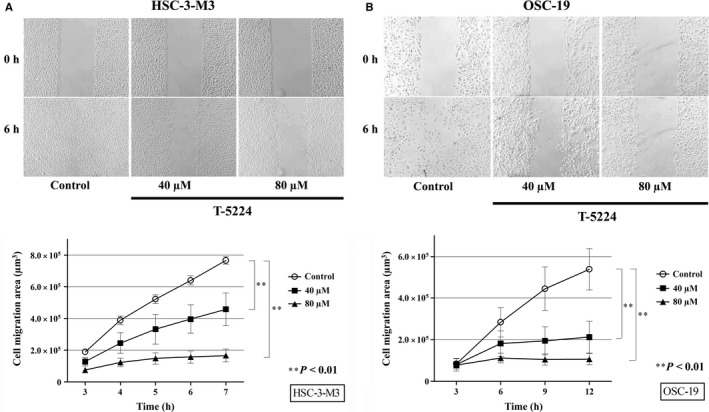
T‐5224 suppressed the migration ability of head and neck squamous cell carcinoma cells. A scratch assay was used to assess the in vitro migration ability of HSC‐3‐M3 (A) and OSC‐19 (B) cells. Areas over which the cells migrated away from the initial scratched borders were quantified using ImageJ software. The migration ability of HSC‐3‐M3 and OSC‐19 were potently suppressed in medium containing T‐5224. Data represent the mean ± SD (n = 6). **Statistically significant differences from the controls are shown (P < 0.01).
Morphological changes induced in tumor cells by T‐5224
Sequential images of tumor cells on culture dishes were obtained 1 h after changing the medium to control or T‐5224‐containing medium. The HSC‐3‐M3 cells in the control medium showed active migration accompanied by lamellipodia formation, contracting movement (Fig. 4A, arrow), and plasma membrane ruffling (Fig. 4A, arrowhead). However, cells in the T‐5224 medium showed inactive migration with decreased lamellipodia formation and ruffling. Fluorescence microscopic images of HSC‐3‐M3 and OSC‐19 cells incubated with T‐5224 maintained epithelial‐like morphology and showed inhibited lamellipodia formation (Fig. 4B, arrow).
Figure 4.
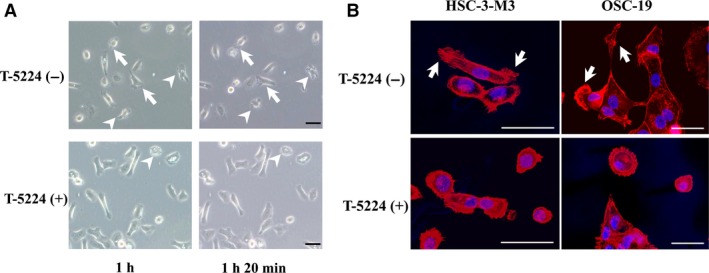
Morphological changes in tumor cells (HSC‐3‐M3 head and neck squamous cell carcinoma) after replacement with normal or T‐5224 (+) media. (A) Time‐lapse images of tumor cells in culture dishes were obtained using a phase‐contrast microscope. Top, images were captured at 1 h and 1 h 20 min after replacing the media. Tumor cells in the normal medium showed active migration, lamellipodia formation with contracting movement (arrow), and plasma membrane ruffling (arrowhead). Bottom, tumor cells in the T‐5224(+) medium showed suppressed migration, with decreased lamellipodia formation and ruffling. (B) Fluorescence confocal microscopic images of head and neck squamous cell carcinoma cells. F‐actin was stained with phalloidin (red) and the nuclei were stained with DAPI (blue). The series of images in the upper and lower rows correspond to tumor cells cultured in the control and T‐5224(+) medium, respectively. Lamellipodia formation (arrow) was inhibited in T‐5224‐treated cells. Scale bar = 50 μm.
T‐5224 inhibited cervical metastasis in orthotopic tumor implantation animal model
To confirm the antimetastatic effect of T‐5224 in vivo, we used an orthotopic tumor implantation model with HSC‐3‐M3, a highly metastatic cell line of oral squamous cell carcinoma. T‐5224 (150 mg/kg) was given every day for 4 weeks, and the cervical lymph nodes were harvested (Fig. 5A,B); H&E‐stained lymph nodes were observed microscopically. Tumor size was not significantly different between the T‐5224 group and the vehicle‐treated control group (Fig. 5C). However, the rate of positive metastasis was significantly lower in the T‐5224‐treated group than in the control group (74.1% in control group versus 40% in treatment group (P < 0.05); Fig. 5D). T‐5224 showed significant inhibitory effects against lymph node metastasis in the animal model of HNSCC.
Figure 5.
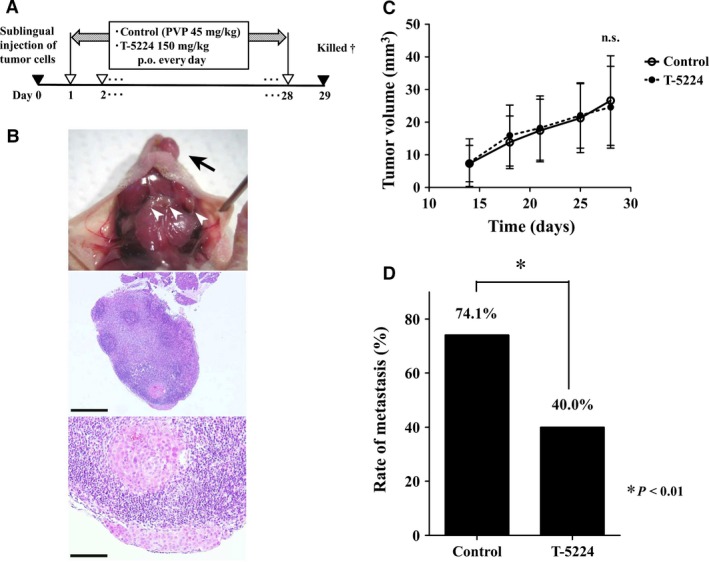
Protocol and results of in vivo study using an orthotopic model of head and neck squamous cell carcinoma. (A) Timeline of in vivo study. After HSC‐3‐M3 cells were injected into the tongue, vehicle or T‐5224 were given every day for 4 weeks. PVP, polyvinylpyrrolidone. †All mice were sacrificed on the 29th day after tumor inoculation into the tongue. (B) Primary lesion of tumor (arrow) and cervical lymph nodes (arrowhead) were observed. Lymph nodes were resected, and metastasis was assessed by H&E staining. Scale bar = 500 μm (middle image) and 100 μm (bottom image). (C) Tumor growth in the primary lesion. Tumors size did not differ significantly between the groups. Data represent mean ± SD. (D) The rate of lymph node metastasis was significantly lower in the T‐5224‐treated group than in the control group. *Statistically significant difference from the control is shown (P < 0.01).
Matrix metalloproteinase‐2 and ‐9 mRNA were inhibited by T‐5224
We investigated whether the expression of MMP mRNA was inhibited by T‐5224 in vitro. Real‐time semiquantitative PCR was carried out to assess MMP‐2 and ‐9 mRNA expressions in HSC‐3‐M3 cells pretreated with T‐5224. The relative expression levels of MMP‐2 and ‐9 mRNA were significantly reduced by incubation with 0–80 μM T‐5224 in comparison with the control (Fig. 6A).
Figure 6.
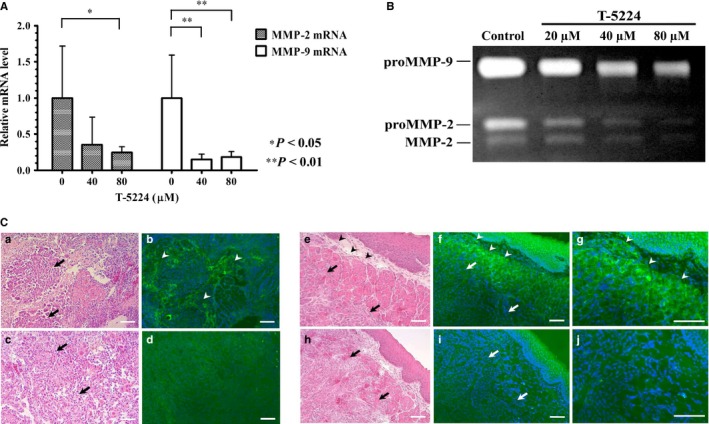
Effect of T‐5224 on the transcription and activity of MMP‐2 and ‐9. (A) T‐5224 suppressed the transcription levels of MMP‐2 and ‐9 mRNA in HSC‐3‐M3 head and neck squamous cell carcinoma cells. β‐Actin mRNA was used as an internal control. Data represent the mRNA levels of MMP‐2 and ‐9 incubated with 0, 40, and 80 μM T‐5224 relative to those in the control group. Data represent mean ± SD (n = 3). *Statistically significant differences from the controls are shown (P < 0.05), **Statistically significant differences from the control are shown (P < 0.01). (B) Gelatinolytic activity, which reflects the activity of MMP‐2 and ‐9, was quantified by gelatin zymography. HSC‐3‐M3 cells were incubated in dishes with different concentrations of T‐5224 (0, 20, 40, and 80 μM) for 24 h, and the supernatant of each medium was collected and electrophoresed. Relative density of MMPs at 20, 40 and 80 μM expressed as ratio of control was 0.85 ± 0.11, 0.43 ± 0.10, and 0.20 ± 0.03 for MMP‐2, and 0.72 ± 0.06, 0.47 ± 0.09, and 0.36 ± 0.07 for MMP‐9, respectively. The gelatinolytic activity of MMP‐2 and ‐9 was significantly suppressed by T‐5224. (C) To identify the localization of activated MMP‐2 and ‐9 in the tumor sites, in situ gelatin zymography was carried out using unfixed cryostat sections of orthotopically implanted tongue tumors. Green fluorescence corresponds to the gelatinolytic activity of MMP‐2 and ‐9. Images (a–d) are tangential sections of the tip of the tumor; images (e–j) are tumor center cross‐sections showing their tumor edge. The intensity of green fluorescence was compared between the control (a,b,e–g) and T‐5224‐treated groups (c,d,h–j). MMP activity was upregulated in the stromal tissue (arrowhead) close to the tumor cells (arrow) in the control groups, and was attenuated in the T‐5224‐treated groups. Scale bar = 100 μm.
T‐5224 attenuated the gelatinase activity of MMP‐2 and ‐9
Matrix metalloproteinases are a family of proteases that play an essential role in tumor invasion and metastasis. Both MMP‐2 and MMP‐9 are collagenases that act on type IV collagen, which is a chief component of the basement membrane. To access the mechanism by which T‐5224 inhibits invasion activity, we carried out in vitro gelatin zymography to assess the activities of MMP‐2 and ‐9. HSC‐3‐M3 cells were incubated in medium containing T‐5224, and the supernatant of each dish was collected and electrophoresed. Bands in the gel represent degraded gelatin, thereby reflecting the degree of gelatinase activity. The bands at 98, 68, and 62 kDa represent proMMP‐9, proMMP‐2, and MMP‐2, respectively. The activities of both MMPs were attenuated by T‐5224 in a concentration‐dependent manner (Fig. 6B).
T‐5224 inhibited gelatinolytic activity of MMP‐2 and ‐9 in stromal tissue of implanted lingual tumor
To evaluate the localization of the gelatinolytic activity of MMP‐2 and ‐9 in the implanted tumor and the therapeutic effect of T‐5224, we carried out in situ gelatin zymography using frozen sections. DQ‐gelatin contains quenched FITC molecules that are activated and start to fluoresce when DQ‐gelatin is degraded by MMP‐2 and ‐9. Strong green fluorescence was observed in the area of the stromal tissue that was close to the tumor cells in the control section (Fig. 6Ca–b,e–g). On the contrary, weak or no fluorescence was observed in the analogous area of the T‐5224‐treated group (Fig. 6Cc–d,h–j). Fluorescence of stromal tissue distant from tumor cells was not observed in either group. These findings indicate that T‐5224 inhibited the gelatinolytic activity of MMP‐2 and ‐9 in the stromal tissue at the invasive front of tumor cells, which is critical for the initiation of tumor invasion and metastasis.
Discussion
In this study, we demonstrated that T‐5224, a selective AP‐1 inhibitor, inhibited tumor cell migration and invasion in a dose‐dependent manner, and that oral administration of T‐5224 resulted in successful prevention of cervical lymph node metastasis in an orthotropic tumor implantation animal model. Our results suggest that inhibition of the expression of MMP‐2 and MMP‐9, and decreased cell motility may be one of the mechanisms by which T‐5224 prevents tumor metastasis.
Our preliminary experiment showed significant overexpression of the AP‐1 component, c‐Jun, in HSC‐3‐M3 cells, a highly metastatic subline compared to other human HNSCC cell lines including OSC‐19 (Fig. S1). Previous reports have described the relationship between AP‐1 activity and malignant metastasis,7, 13 and a positive correlation between c‐Jun expression and invasiveness and carcinogenesis of HNSCC14 has been reported. Based on these reports as well as our data, we suggest that the transcriptional activity of AP‐1 or c‐Jun expression plays a critical role in tumor metastasis in HNSCC.
Tumor metastasis occurs in multiple steps, beginning with decreased adhesiveness of cancer cells in the primary lesion, followed by enhanced cell motility and infiltration into the surrounding tissues by degradation of the extracellular matrix (ECM) and basement membrane. The ECM and basement membrane are composed of collagen, laminin, glycoproteins, and proteoglycans, and are degraded by proteolytic enzymes, including MMPs. Both MMP‐2 and ‐9 play important roles in the initiation of tumor invasion and migration by degrading type IV collagen.15, 16 This is important in the context of metastasis and the prognosis of HNSCC patients.17, 18, 19 The MMP genes have an AP‐1 binding sequence in their promoter regions and are transcriptionally regulated by AP‐1.20 In this study, T‐5224 successfully inhibited the invasion and gelatinolytic activities of MMPs in a dose‐dependent manner (Figs 1 and 6). Moreover, T‐5224 strongly inhibited invasion activity even at low concentrations in the invasion assay. These results indicate that T‐5224 potently inhibits the essential steps of metastasis, infiltration through the basement membrane barrier and migration into the ECM, by transcriptionally suppressing the expression of MMP‐2 and ‐9.
We used in situ gelatin zymography to confirm the localization of the gelatinolytic activity of MMP‐2 and ‐9. The result revealed that the gelatinolytic activities of the MMPs were activated in the stromal tissue, close to the tumor cells, as with the previous study.12 Degradation of the ECM of stromal tissue occurs at the invasive edge of tumors and enables tumor cells to infiltrate surrounding stromal tissue, by co‐activating the tumor cells and surrounding fibroblasts. Our results showed that these activities were also significantly inhibited by T‐5224. Together with the results of the real‐time semiquantitative PCR, these findings suggest that transcriptional inhibition of the expression of MMPs by T‐5224 is not limited to tumor cells only; it also occurs in the ECM of the surrounding tissue, and consequently, inhibits tumor cells from infiltrating the surrounding tissue.
T‐5224 also significantly inhibited cell motility. Close observation of migrating tumor cells revealed that T‐5224 inhibited lamellipodia formation and ruffling. Other studies have indicated that AP‐1 is important for cell motility and that it is a key factor in cytoskeletal rearrangement, which is necessary for lamellipodia formation and cell motility.14, 21, 22, 23 Malliri et al.14 reported that EGF‐induced cell motility and lamellipodia formation were inhibited by the induction of dominant negative c‐Jun in squamous cell carcinoma cells. Our study showed a similar effect against cell motility, caused by the administration of T‐5224.
Apart from the mechanisms mentioned above, AP‐1 is involved in invasion and metastasis through the regulation of numerous genes related to metastasis. Activator protein‐1 regulates COX‐2,24 vascular endothelial growth factor,25 and urokinase plasminogen activator and its receptor,26 which contribute to tumor cell invasion and migration. Inflammation induced by cytokines and chemokines are often observed in the microenvironment in HNSCC and promotes tumor angiogenesis and invasiveness, and AP‐1 is also one of the key regulators of the inflammation in malignant tumor.27 Therefore, suppressing these cytokines by inhibition of AP‐1 might partly contribute to the antimetastatic effect of T‐5224. Moreover, AP‐1 has been associated with the loss of polarity of tumor cells, which is also known as epithelial–mesenchymal transition; morphological transition from an epithelial cell‐like phenotype to a mesenchymal cell‐like phenotype through Snail 1 repression.28, 29 Thus, AP‐1 regulates many downstream genes related to tumor invasion and migration. Although a strategy to control tumor metastasis by regulating individual genes or molecules has been reported previously,30, 31, 32, 33 tumor metastasis consists of multigenic pathways involving a number of signaling cascades and genes. These orchestrated mechanisms present difficulties when dealing with tumor metastasis. Activator protein‐1 is a final downstream target and has multiple upstream signaling cascades that are highly associated with tumor metastasis. Therefore, as a key regulator of metastasis, AP‐1 is an attractive and promising pharmacological target.
Although T‐5224 exerted its antimetastatic effect by inhibiting migration and invasion of tumor cells, by itself, it was not cytotoxic. Activator protein‐1 is involved in the cell cycle, proliferation, and apoptosis,8, 34 and an inhibitor of AP‐1 might exhibit antiproliferation activity in AP‐1 upregulated tumor cells. However, application of T‐5224 to HNSCC cells had no or limited effect on tumor growth in vitro or in vivo in our study. These findings are consistent with those reported previously that the expression of the dominant‐negative mutant of c‐Jun in HNSCC cells inhibited invasiveness without affecting proliferation.14 One of the mechanisms of cell proliferation mediated by AP‐1 is p53 repression by upregulated c‐Jun. However, p53 mutation is most commonly found in malignant tumors, including HNSCC,35 and certain forms of mutant p53 protein are resistant to p53‐mediated growth inhibition. As for cell lines used in this study, HSC‐3, a parental cell line of HSC‐3‐M3, has a p53 mutation lacking the ability to phosphorylate Ser46 of p53,36 resulting in resistance to p53‐mediated growth inhibition, and OSC‐19 has a disruptive mutation that leads to loss of p53 expression.37 This might explain the lack of tumor growth inhibition in the HNSCC cell lines by T‐5224.
T‐5224 was originally developed as an anti‐inflammatory drug against RA; it inhibits inflammatory cytokines and proteases,9 and a phase II clinical trial for RA is underway.38 This molecule also ameliorated inflammatory diseases including systemic sclerosis,39 lipopolysaccharide‐induced liver injury,40 endotoxin‐induced acute kidney injury,41 and allograft rejection.42 Effective doses of T‐5224 in vivo in our study (150 mg/kg) is higher than in other studies for chronic inflammatory diseases such as RA and systemic sclerosis, however, other research into acute inflammatory diseases required even an higher dose (300 mg/kg). We consider that the effective dose in vivo depends on the nature of the disease, and it is possible that higher doses might be required for cells in which activity of AP‐1 is intensively and constitutively activated by genetic mutations or substantial inflammation.
A daily dose of 150 mg/kg T‐5224 has been confirmed to be safe in rodents, and a lower daily dose might be enough to exert therapeutic effects against some inflammatory diseases.9, 39 Safety, ease of administration for clinical usage, and high therapeutic activity in vivo are some of the advantages of T‐5224. Therefore, we suggest that T‐5224 can be given safely in combination with the present standard treatment to prevent metastasis in HNSCC.
Disclosure Statement
The authors have no conflict of interest.
Supporting information
Video S1. Time‐lapse (×900) microscopic movies of HSC‐3‐M3 in normal medium and T‐5224 medium. Confluent HSC‐3‐M3 cells were partially removed and incubated in each medium. T‐5224 showed a potent antimigratory effect against HSC‐3‐M3.
Fig. S1. Western blot analysis of c‐Jun and c‐Fos expression in human oral squamous cell carcinoma cell lines; HSC‐3‐M3, HSC‐3, and OSC‐19. Overexpression of the activator protein‐1 component, c‐Jun, was observed for HSC‐3‐M3 cells, a highly metastatic subline of HSC‐3, whereas no difference was observed in c‐Fos expression. Relative expression of c‐Jun in HSC‐3‐M3, HSC‐3, and OSC‐19 was 1.00, 0.37, and 0.16 in OSC‐19 cells, respectively, and relative expression of c‐Fos was 1.00, 1.05, and 1.04, respectively.
Acknowledgments
This work was supported by a grant from the Japan Society for the Promotion of Science (Kakenhi) (grant no. 23592544 and 26462626). We thank Dr. Y. Aikawa for his helpful discussions and for his cooperation while carrying out the experiments.
Cancer Sci 107 (2016) 666–673
Funding Information
Japan Society for the Promotion of Science.
References
- 1. [Internet] World Health Organization . International Agency for Research in Cancer. Globocan 2012: estimated cancer incidence, mortality and prevalence worldwide 2012. 2013. [Cited 01 July 2015.] Available from URL: http://globocan.iarc.fr/Pages/fact_sheets_cancer.aspx.
- 2. Siegel R, Deepa N, Ahmedin J. Cancer statistics, 2013. CA – Cancer J Clin 2013; 63: 11–30. [DOI] [PubMed] [Google Scholar]
- 3. Angel P, Karin M. The role of Jun, Fos and the AP‐1 complex in cell‐proliferation and transformation. Biochim Biophys Acta 1991; 1072: 129–57. [DOI] [PubMed] [Google Scholar]
- 4. Ondrey FG, Dong G, Sunwoo J et al Constitutive activation of transcription factors NF‐κB, AP‐1, and NF‐IL6 in human head and neck squamous cell carcinoma cell lines that express pro‐inflammatory and pro‐angiogenic cytokines. Mol Carcinog 1999; 26: 119–29. [DOI] [PubMed] [Google Scholar]
- 5. De Sousa SO, Mesquita RA, Pinto DSJ, Gutkind S. Immunolocalization of c‐Fos and c‐Jun in human oral mucosa and in oral squamous cell carcinoma. J Oral Pathol Med 2002; 31: 78–81. [DOI] [PubMed] [Google Scholar]
- 6. Mishra A, Bharti AC, Saluja D, Das BC. Transactivation and expression patterns of Jun and Fos/AP‐1 super‐family proteins in human oral cancer. Int J Cancer 2010; 126: 819–29. [DOI] [PubMed] [Google Scholar]
- 7. Ozanne BW, Spence HJ, McGarry LC, Hennigan RF. Transcription factors control invasion: AP‐1 the first among equals. Oncogene 2007; 26: 1–10. [DOI] [PubMed] [Google Scholar]
- 8. Shaulian E, Karin M. AP‐1 in cell proliferation and survival. Oncogene 2001; 20: 2390–400. [DOI] [PubMed] [Google Scholar]
- 9. Aikawa Y, Morimoto K, Yamamoto T et al Treatment of arthritis with a selective inhibitor of c‐Fos/activator protein‐1. Nat Biotechnol 2008; 26: 817–23. [DOI] [PubMed] [Google Scholar]
- 10. Yokoi T, Homma H, Odajima T. Establishment and characterization of OSC‐19 cell line in serum‐ and protein‐free culture. Tumor Res 1988; 24: 1–17. [Google Scholar]
- 11. Matsui T, Ota T, Ueda Y, Tanino M, Odashima S. Isolation of a highly metastatic cell line to lymph node in human oral squamous cell carcinoma by orthotopic implantation in nude mice. Oral Oncol 1998; 34: 253–6. [PubMed] [Google Scholar]
- 12. Mook OR, Van Overbeek C, Ackema E, Van Maldegem F, Frederiks WM. In situ localization of gelatinolytic activity in the extracellular matrix of metastases of colon cancer in rat liver using quenched fluorogenic DQ‐gelatin. J Histochem Cytochem 2003; 51: 821–9. [DOI] [PubMed] [Google Scholar]
- 13. Zhou Y, Yau C, Gray JW et al Enhanced NFκB and AP‐1 transcriptional activity associated with antiestrogen resistant breast cancer. BMC Cancer 2007; 7: 59. [DOI] [PMC free article] [PubMed] [Google Scholar]
- 14. Malliri A, Symons M, Hennigan RF et al The transcription factor AP‐1 is required for EGF‐induced activation of rho‐like GTPases, cytoskeletal rearrangements, motility, and in vitro invasion of A431 cells. J Cell Biol 1998; 143: 1087–99. [DOI] [PMC free article] [PubMed] [Google Scholar]
- 15. Stetler‐Stevenson WG. Type IV collagenases in tumor invasion and metastasis. Cancer Metastasis Rev 1990; 9: 289–303. [DOI] [PubMed] [Google Scholar]
- 16. McMillan JI, Weeks R, West JW, Bursten S, Rice GC, Lovett DH. Pharmacological inhibition of gelatinase B induction and tumor cell invasion. Int J Cancer 1996; 67: 523–31. [DOI] [PubMed] [Google Scholar]
- 17. Kuwata R, Shimada T, Maruyama S, Hisa Y, Takenaka H, Murakami Y. Enhanced production of matrix metalloproteinase‐2 in human head and neck carcinomas is correlated with lymph node metastasis. Acta Otolaryngol 2002; 122: 101–6. [DOI] [PubMed] [Google Scholar]
- 18. Hong SD, Hong SP, Lee JI, Lim CY. Expression of matrix metalloproteinase‐2 and ‐9 in oral squamous cell carcinomas with regard to the metastatic potential. Oral Oncol 2000; 36: 207–13. [DOI] [PubMed] [Google Scholar]
- 19. Rosenthal EL, Matrisian LM. Matrix metalloproteases in head and neck cancer. Head Neck 2006; 28: 639–48. [DOI] [PMC free article] [PubMed] [Google Scholar]
- 20. Westermarck J, Kahari VM. Regulation of matrix metalloproteinase expression in tumor invasion. FASEB J 1999; 13: 781–92. [PubMed] [Google Scholar]
- 21. Spence HJ, McGarry L, Chew CS et al AP‐1 differentially expressed proteins Krp1 and fibronectin cooperatively enhance Rho‐ROCK‐independent mesenchymal invasion by altering the function, localization, and activity of non differentially expressed proteins. Mol Cell Biol 2006; 26: 1480–95. [DOI] [PMC free article] [PubMed] [Google Scholar]
- 22. Kustikova O, Kramerov D, Grigorian M et al Fra‐1 induces morphological transformation and increases in vitro invasiveness and motility of epithelioid adenocarcinoma cells. Mol Cell Biol 1998; 18: 7095–105. [DOI] [PMC free article] [PubMed] [Google Scholar]
- 23. Belguise K, Kersual N, Galtier F, Chalbos D. FRA‐1 expression level regulates proliferation and invasiveness of breast cancer cells. Oncogene 2005; 24: 1434–44. [DOI] [PubMed] [Google Scholar]
- 24. Wolff H, Saukkonen K, Anttila S, Karjalainen A, Vainio H, Ristimaki A. Expression of cyclooxygenase‐2 in human lung carcinoma. Cancer Res 1998; 58: 4997–5001. [PubMed] [Google Scholar]
- 25. Marconcini L, Marchio S, Morbidelli L et al c‐fos‐induced growth factor/vascular endothelial growth factor D induces angiogenesis in vivo and in vitro. Proc Natl Acad Sci U S A 1999; 96: 9671–6. [DOI] [PMC free article] [PubMed] [Google Scholar]
- 26. Mazar AP, Henkin J, Goldfarb RH. The urokinase plasminogen activator system in cancer: implications for tumor angiogenesis and metastasis. Angiogenesis 1999; 3: 15–32. [DOI] [PubMed] [Google Scholar]
- 27. Wang F, Arun P, Friedman J, Chen Z, Waes CV. Current and potential inflammation targeted therapies in head and neck cancer. Curr Opin Pharmacol 2009; 9: 389–95. [DOI] [PMC free article] [PubMed] [Google Scholar]
- 28. Reichmann E, Schwarz H, Deiner ME et al Activation of an inducible c‐FosER fusion protein causes loss of epithelial polarity and triggers epithelial‐fibroblastoid cell conversion. Cell 1992; 71: 1103–16. [DOI] [PubMed] [Google Scholar]
- 29. Nguyen PT, Tsuneshima T, Yanagisawa S et al The FGFR1 inhibitor PD173074 induces mesenchymal–epithelial transition through the transcription factor AP‐1. Br J Cancer 2013; 109: 2248–58. [DOI] [PMC free article] [PubMed] [Google Scholar]
- 30. Coussens LM, Fingleton B, Matrisian LM. Matrix metalloproteinase inhibitors and cancer – trials and tribulations. Science 2002; 29: 2387–92. [DOI] [PubMed] [Google Scholar]
- 31. Andreasen PA, Kjoller L, Christensen L, Duffy MJ. The urokinase‐type plasminogen activator system in cancer metastasis: a review. Int J Cancer 1997; 72: 1–22. [DOI] [PubMed] [Google Scholar]
- 32. Muraoka RS, Dumont N, Ritter CA et al Blockade of TGF‐β inhibits mammary tumor cell viability, migration, and metastases. J Clin Invest 2002; 109: 1551–9. [DOI] [PMC free article] [PubMed] [Google Scholar]
- 33. Drevs J, Hofmann I, Hugenschmidt H et al Effects of PTK787/ZK 222584, a specific inhibitor of vascular endothelial growth factor receptor tyrosine kinases, on primary tumor, metastasis, vessel density, and blood flow in a murine renal cell carcinoma model. Cancer Res 2000; 60: 4819–24. [PubMed] [Google Scholar]
- 34. Shaulian E, Karin M. AP‐1 as a regulator of cell line and death. Nat Cell Biol 2002; 4: E131–6. [DOI] [PubMed] [Google Scholar]
- 35. Sakai E, Tsuchida N. Most human squamous cell carcinomas in the oral cavity contain mutated p53 tumor‐suppressor genes. Oncogene 1992; 7: 927–33. [PubMed] [Google Scholar]
- 36. Ichwan SA, Yamada S, Sumrejkanchanakij P, Ibrahim‐Auerkari E, Eto K, Ikeda M. Defect in serine 46 phosphorylation of p53 contributes to acquisition of p53 resistance in oral squamous cell carcinoma cells. Oncogene 2006; 25: 1216–24. [DOI] [PubMed] [Google Scholar]
- 37. Sano D, Xie TX, Ow TJ et al Disruptive TP53 mutation is associated with aggressive disease characteristics in an orthotopic murine model of oral tongue cancer. Clin Cancer Res 2011; 17: 6658–70. [DOI] [PMC free article] [PubMed] [Google Scholar]
- 38. Ye N, Ding Y, Wild C, Shen Q, Zhou J. Small molecule inhibitors targeting activator protein 1 (AP‐1). J Med Chem 2014; 57: 6930–48. [DOI] [PMC free article] [PubMed] [Google Scholar]
- 39. Avouac J, Palumbo K, Tomcik M et al Inhibition of activator protein 1 signaling abrogates transforming growth factor β‐mediated activation of fibroblasts and prevents experimental fibrosis. Arthritis Rheum 2012; 64: 1642–52. [DOI] [PubMed] [Google Scholar]
- 40. Izuta S, Ueki M, Ueno M, Nishina K, Shiozawa S, Maekawa N. T‐5224, a selective inhibitor of c‐Fos/activator protein‐1, attenuates lipopolysaccharide‐induced liver injury in mice. Biotechnol Lett 2012; 34: 2175–82. [DOI] [PubMed] [Google Scholar]
- 41. Miyazaki H, Morishita J, Ueki M, Nishina K, Shiozawa S, Maekawa N. The effects of a selective inhibitor of c‐Fos/activator protein‐1 on endotoxin‐induced acute kidney injury in mice. BMC Nephrol 2012; 13: 153. [DOI] [PMC free article] [PubMed] [Google Scholar]
- 42. Yoshida T, Yamashita K, Watanabe M et al The impact of c‐Fos/activator protein‐1 inhibition on allogeneic pancreatic islet transplantation. Am J Transplant 2015; 15: 2565–75. [DOI] [PubMed] [Google Scholar]
Associated Data
This section collects any data citations, data availability statements, or supplementary materials included in this article.
Supplementary Materials
Video S1. Time‐lapse (×900) microscopic movies of HSC‐3‐M3 in normal medium and T‐5224 medium. Confluent HSC‐3‐M3 cells were partially removed and incubated in each medium. T‐5224 showed a potent antimigratory effect against HSC‐3‐M3.
Fig. S1. Western blot analysis of c‐Jun and c‐Fos expression in human oral squamous cell carcinoma cell lines; HSC‐3‐M3, HSC‐3, and OSC‐19. Overexpression of the activator protein‐1 component, c‐Jun, was observed for HSC‐3‐M3 cells, a highly metastatic subline of HSC‐3, whereas no difference was observed in c‐Fos expression. Relative expression of c‐Jun in HSC‐3‐M3, HSC‐3, and OSC‐19 was 1.00, 0.37, and 0.16 in OSC‐19 cells, respectively, and relative expression of c‐Fos was 1.00, 1.05, and 1.04, respectively.