

Abstract
Over the last few decades, numerous biomarkers in Wilms' tumor have been confirmed and shown variations in prevalence. Most of these studies were based on small sample sizes. We carried out a meta‐analysis of the research published from 1992 to 2015 to obtain more precise and comprehensive outcomes for genetic tests. In the present study, 70 out of 5175 published reports were eligible for the meta‐analysis, which was carried out using Stata 12.0 software. Pooled prevalence for gene mutations WT1, WTX, CTNNB1, TP53, MYCN, DROSHA, and DGCR8 was 0.141 (0.104, 0.178), 0.147 (0.110, 0.184), 0.140 (0.100, 0.190), 0.410 (0.214, 0.605), 0.071 (0.041, 0.100), 0.082 (0.048, 0.116), and 0.036 (0.026, 0.046), respectively. Pooled prevalence of loss of heterozygosity at 1p, 11p, 11q, 16q, and 22q was 0.109 (0.084, 0.133), 0.334 (0.295, 0.373), 0.199 (0.146, 0.252), 0.151 (0.129, 0.172), and 0.148 (0.108, 0.189), respectively. Pooled prevalence of 1q and chromosome 12 gain was 0.218 (0.161, 0.275) and 0.273 (0.195, 0.350), respectively. The limited prevalence of currently known genetic alterations in Wilms' tumors indicates that significant drivers of initiation and progression remain to be discovered. Subgroup analyses indicated that ethnicity may be one of the sources of heterogeneity. However, in meta‐regression analyses, no study‐level characteristics of indicators were found to be significant. In addition, the findings of our sensitivity analysis and possible publication bias remind us to interpret results with caution.
Keywords: Children, genetic variations, meta‐analysis, prevalence, Wilms' tumor
Wilms' tumor (WT) is the most common childhood renal malignancy that affects approximately 1 in 10 000 children in Europe and North America.1 The median age of diagnosis is between 3 and 4 years and both kidneys are affected in ~5% of children.2 Most cases of WT are sporadic, however, rare cases of familial WT have also been described.3, 4, 5 Approximately 10% of WT cases are associated with germline mutations and/or congenital abnormalities, such as Denys–Drash syndrome,6 Beckwith–Wiedemann syndrome,7 Wilms–aniridia–genitourinary anomalies–mental retardation syndrome8, 9 and Perlman syndrome.10, 11 Wilms' tumor is a complex embryonal tumor with conventional triphasic histology (blastemic, epithelial, and stromal components). Although these three components are typically found, WT may also display heterologous elements such as cartilage, osteoid, and neural elements. This heterogeneity implies a complexity to the underlying causes of WT that has fascinated investigators for decades.
The WT1 gene, located at chromosome 11p13, was first cloned in 1990 as one of the first tumor suppressor genes in WT.8, 9 Subsequently, CTNNB1 12 and WTX 13 have been identified in tumors. The combined frequency of WT1, CTNNB1, and WTX genetic alterations has been estimated to occur in roughly one‐third of WT.14, 15 Furthermore, WT maintenance and disease progression are associated with the altered expression of many other genes, such as TP53, MYCN, CITED1, SIX2, TOP2A, and CRABP2.16, 17, 18, 19, 20, 21, 22, 23, 24, 25 Specifically, mutations in TP53 appear to be a common finding in unfavorable histology (UH) WT and a notorious marker of treatment resistance.16, 17, 26 A recent whole exome study has identified mutations in microRNA processing genes including DROSHA and DGCR8.27, 28, 29, 30 However, the frequency of alterations in DROSHA and DGCR8 are similarly uncommon, leaving a significant fraction of cases without an identified “driver” genetic defect.27
Numerous recurrent copy number aberrations and loss of heterozygosity (LOH) events have been described, some of which affect known genes (e.g. 11p LOH and 17p loss),26, 31 but the critical genes with other regions (e.g. 1q gain, 1p loss and 16q loss) remain elusive.32, 33, 34 Only a few of these aberrations have known associations with histology or outcome. The documented association between relapse and LOH for 1p and 16q is being used to stratify patients within the current Children's Oncology Group (COG) therapeutic protocols to warrant a more intensive drug regimen upfront for favorable histology (FH) WT.32, 35 Loss of genetic material at 4q, 11q, and 14q has also emerged as a feature of UHWT and poor prognosis.20, 36
Therefore, identification and characterization of these genes is of primary importance in understanding the onset and progression of tumors, ultimately leading to recognition of potential markers and specific targets for prevention and individualized treatment of tumors. Over the last few decades, numerous markers, especially the novel ones, have been confirmed and shown variations in prevalence. However, the results of these studies were inconsistent, partly because the sample sizes were usually small, and the ethnic backgrounds and experimental techniques were varied. In order to overcome the limitation of individual studies, we carried out this meta‐analysis to provide a more precise and comprehensive outcome for genetic tests and a basis for the prevention, early diagnosis, and treatment of WT.
Methods
Data sources
Four English databases including PubMed, Web of Science, Embase, and Cochrane Library were electronically searched to retrieve studies on the gene mutations of WT published before 15 September 2015. The search was based on the following keywords: “genetic variation” or “mutation”, combined with “Wilms tumor” or “Wilms' tumor” or “nephroblastoma”. Furthermore, we checked the reference lists of retrieved reviews to identify more potential pertinent studies.
Inclusion criteria
Studies were included in the systematic review if they met all of the following criteria: (i) the publication explored the relationship between gene mutation and WT; (ii) the frequency of gene mutation and sample size was clearly documented, or other information was provided that assisted in interpreting the results; (iii) the sample size was 15 or more; and (iv) the publication language was confined to English.
Exclusion criteria
Studies that met any of the following exclusion criteria were excluded: (i) research based on animals or cells rather than general population; (ii) reviews, editorials, meeting abstracts, or commentaries; (iii) publications with no target data or no relevant outcomes; (iv) multiple published reports. When there were several reports concerning the same cohort we included the high quality publication in our meta‐analysis.
Quality assessment
A quality assessment of the included articles was carried out using the checklist for appraising studies of genotype prevalence proposed by Little et al.37 It is a validated tool for appraising studies of genotype prevalence including four parts. They focused on the purpose of study (one item), analytic validity of genotyping (eight items), selection of study subjects (five items), and statistical issues (two items). Each item in the scale is scored as 0 (not reported or inadequate) or 1 (reported and adequate). The total ideal score is 16 for these studies. Details are shown in Table S1.
Statistical analyses
The combined rate and its 95% confidence interval were used to evaluate the strength of association between gene mutations and WT. Heterogeneity among included studies was checked by the χ2‐based Q test and I 2 test. If there was no heterogeneity between studies (P > 0.10, I 2 = 0%), the fixed‐effect model was used. Otherwise, the random‐effects models was chosen (Table 1). All statistical tests were carried out with the meta‐analysis software Stata 12.0 (Stata Statistical Software, College Station, TX, USA, www.stata.com). A P‐value of 0.05 for any test or model was considered to be statistically significant unless otherwise specified.
Table 1.
Results of a meta‐analysis and publication bias in research regarding genetic mutation frequencies in Wilms' tumor, published 1992–2015
| Gene mutation | R (95% CI) | Z | P‐value | I 2% | P het | Begg's test | Egger's test | Gene models |
|---|---|---|---|---|---|---|---|---|
| P‐value | P‐value | |||||||
| DGCR8 27, 28, 29 | 0.036 (0.026, 0.046) | 7.190 | 0.000 | 22.8 | 0.274 | 1.000 | 0.309 | Random |
| MYCN 20, 21, 28, 30, 42, 51, 52 | 0.071 (0.041, 0.100) | 4.710 | 0.000 | 68.5 | 0.004 | 1.000 | 0.092 | Random |
| DROSHA 27, 28, 29, 30 | 0.082 (0.048, 0.116) | 4.770 | 0.000 | 76.1 | 0.006 | 0.296 | 0.019 | Random |
| WT1 13, 15, 27, 30, 31, 38, 42, 46, 53, 54, 55, 56, 57, 58, 59, 60, 61, 62, 63, 64, 65 | 0.141 (0.104, 0.178) | 7.480 | 0.000 | 77.9 | 0.000 | 0.007 | 0.001 | Random |
| WTX 13, 14, 15, 27, 31, 38, 42, 46, 53, 54, 55, 56, 57, 66 | 0.147 (0.110, 0.184) | 7.750 | 0.000 | 72.6 | 0.000 | 0.228 | 0.347 | Random |
| CTNNB1 13, 15, 27, 30, 38, 42, 46, 53, 54, 56, 57, 58, 60, 61, 67, 68 | 0.140 (0.100, 0.190) | 7.870 | 0.000 | 70.9 | 0.000 | 0.010 | 0.010 | Random |
| TP53 16, 26, 30, 38, 39, 41, 42 | 0.410 (0.214, 0.605) | 4.110 | 0.000 | 0.8 | 0.000 | 1.000 | 0.300 | Random |
| Gain 1q31, 34, 42, 48, 50, 69 | 0.218 (0.161, 0.275) | 7.470 | 0.000 | 66.9 | 0.006 | 0.368 | 0.436 | Random |
| Gain 1231, 39, 69, 70 | 0.273 (0.195, 0.350) | 6.930 | 0.000 | 0.0 | 0.767 | 0.734 | 0.333 | Fixed |
| LOH 1p+16q45, 50, 71 | 0.029 (0.017, 0.041) | 4.800 | 0.000 | 0.0 | 0.715 | 0.296 | 0.030 | Fixed |
| LOH 1p32, 42, 43, 44, 45, 50, 51, 71, 72, 73, 74 | 0.109 (0.084, 0.133) | 8.600 | 0.000 | 66.3 | 0.001 | 0.640 | 0.586 | Random |
| LOH 22q44, 51, 71, 75 | 0.148 (0.108, 0.189) | 7.140 | 0.000 | 15.1 | 0.316 | 0.734 | 0.256 | Random |
| LOH 16q32, 36, 40, 42, 43, 45, 48, 50, 71, 72, 73, 76, 77, 78, 79 | 0.151 (0.129, 0.172) | 13.510 | 0.000 | 50.3 | 0.110 | 0.499 | 0.098 | Random |
| LOH 7p71, 73, 80, 81 | 0.177 (0.126, 0.227) | 6.860 | 0.000 | 0.0 | 0.903 | 0.734 | 0.335 | Fixed |
| LOH 11q36, 42, 51, 59, 71, 73 | 0.199 (0.146, 0.252) | 7.380 | 0.000 | 57.0 | 0.040 | 0.707 | 0.322 | Random |
| LOH 11p1531, 44, 46, 68, 73, 76, 82 | 0.286 (0.172, 0.399) | 4.920 | 0.000 | 84.9 | 0.000 | 0.548 | 0.049 | Random |
| LOH 11p1331, 40, 42, 44, 61, 76, 82, 83 | 0.319 (0.220, 0.417) | 6.340 | 0.000 | 69.5 | 0.002 | 0.108 | 0.040 | Random |
| LOH 11p31, 43, 51, 59, 72, 73, 76 | 0.334 (0.295, 0.373) | 16.780 | 0.000 | 20.7 | 0.272 | 0.072 | 0.101 | Random |
| LOH 11p15.542, 56, 61 | 0.380 (0.140, 0.620) | 3.100 | 0.002 | 90.4 | 0.000 | 0.296 | 0.439 | Random |
| Loss 1p34, 39, 84 | 0.167 (0.069, 0.265) | 3.340 | 0.001 | 80.7 | 0.006 | 1.000 | 0.855 | Random |
| Loss 11p39, 69, 84 | 0.202 (0.022, 0.382) | 2.200 | 0.028 | 88.9 | 0.000 | 1.000 | 0.540 | Random |
CI, confidence interval; Fixed, fixed‐effect model; LOH, loss of heterozygosity; Phet, P‐value of heterogeneity; R, frequency of gene mutations; Random, random‐effects models.
Sensitivity analyses
Sensitivity analyses were carried out with Stata 12.0 to investigate the influence of every study on the overall effect.
Subgroup analyses and meta‐regression analyses
Subgroup analyses were carried out according to ethnicity to explore the possible explanations for heterogeneity. We used the descriptions “Caucasian” and “non‐Caucasian” to explore the ethnicity influence. Random‐effect meta‐regression analyses were also carried out to identify study‐level factors contributing to heterogeneity between studies according to experimental technology, types of sample, year of publication, and ethnicity.
Publication bias
Potential publication bias was assessed by Begg's rank correlation test and Egger's linear regression test using Stata 12.0.
Data extraction
Two investigators (C.D. and R.D.) independently identified the eligible studies for this systematic review. Any disagreement was resolved by the third party (F.L. and X.L.). Data was extracted and entered into an electronic form in Excel (Microsoft Corporation, WA, USA, www.microsoft.com) by C.D. and was independently checked by F.L. The following information was extracted from each eligible study: (i) gene variations, the name of the first author, and year of publication; (ii) race, study location and period, sample size, types of specimen; and (iii) other details of targeted indicators, including histopathology, preoperative chemotherapy, and bilateral or unilateral disease.
Results
Search of published works
A total of 5174 potentially eligible publications were retrieved. Most of them were excluded after the initial screening of titles and abstracts. The main reasons for exclusion were not referring to our topic and duplication. A total of 114 relevant articles were included in our full‐text selection and 69 eligible articles were included in our systematic review. The main reasons for exclusion were as follow: 34 studies lacked target data, population, or outcome; three studies were concerned with the same cohort; and 8 were case reports, reviews, or had a sample size less than 15 cases. Another relevant publication was found through reference screening. Finally, 70 articles met the criteria for our meta‐analysis (Fig. 1).
Figure 1.
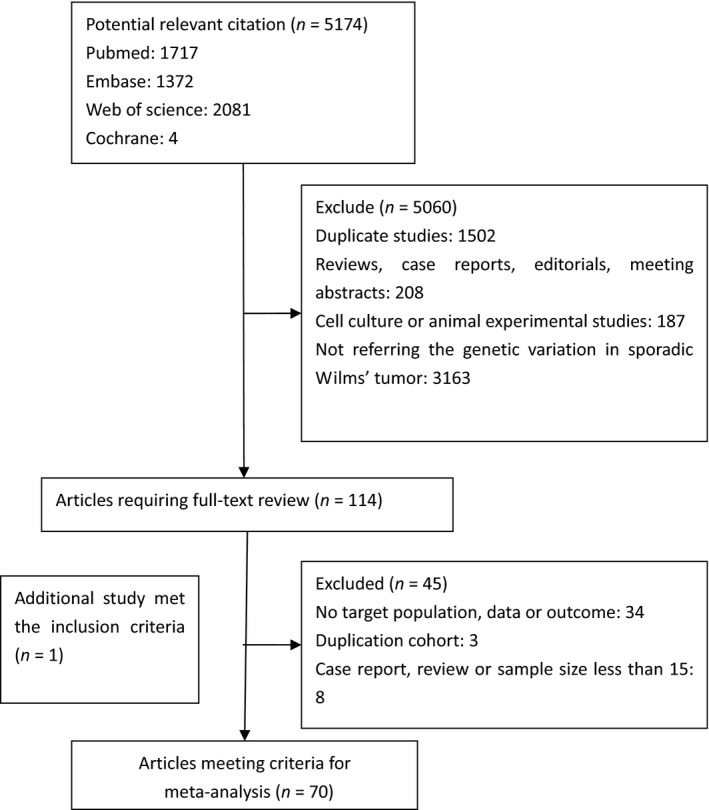
Flow chart of the selection of relevant published works regarding genetic variation frequencies in Wilms' tumor. Of 5174 potentially eligible publications, 5060 were excluded after screening of titles and abstracts. Sixty‐nine eligible articles were included from 114 included in our full‐text selection. The reasons for exclusion were: lack of target data, population, or outcome (34 studies), analysis of the same cohort (three studies), and case reports, reviews, or sample size <15 cases (eight studies). One additional publication was found through reference screening. Finally, 70 articles met the criteria for our meta‐analysis.
Characteristics of included studies
The characteristics of the included studies are presented in Table S2. Studies were published from 1992 to 2015 involving more than 20 genetic variations. WT1, WTX, and CTNNB1 were the genes most commonly studied. DROSHA and DGCR8 alterations had been identified in microRNA processing genes in recent years. In addition, LOH principally tended to a few loci, at 1p, 7p, 11p, 11q, 16q, and 22q. More than half of the patients in our included reports were Caucasian; the studies were carried out in countries such as the USA, Germany, UK, and Italy. In addition, some non‐Caucasian populations were analyzed in Kenya, China, and Japan. Patients were treated mainly according to either the International Society of Pediatric Oncology or COG protocols. The COG protocols were based on primary surgery followed by chemotherapy, whereas patients treated under the International Society of Pediatric Oncology protocols usually received preoperative chemotherapy, followed by surgery and adjusted postoperative chemotherapy and radiotherapy.
Quantitative synthesis for gene variations of WT
The pooled frequencies of gene variations ranged from 0.03 (0.02, 0.04) to 0.41 (0.21, 0.61) including some gene mutations (WT1, WTX, CTNNB1, TP53, MYCN, DROSHA, and DGCR8), LOH (1p, 11p, 11q, 16q, and 22q), and copy number gain (1q and chromosome 12) (Table 1). Copy number loss was not pooled due to too few original studies.26, 34, 38, 39, 40, 41 The forest plots of WT1, WTX, and CTNNB1 are provided in Figures 2, 3, and 4, respectively. Other forest plots are shown in Figures S1–S16.
Figure 2.
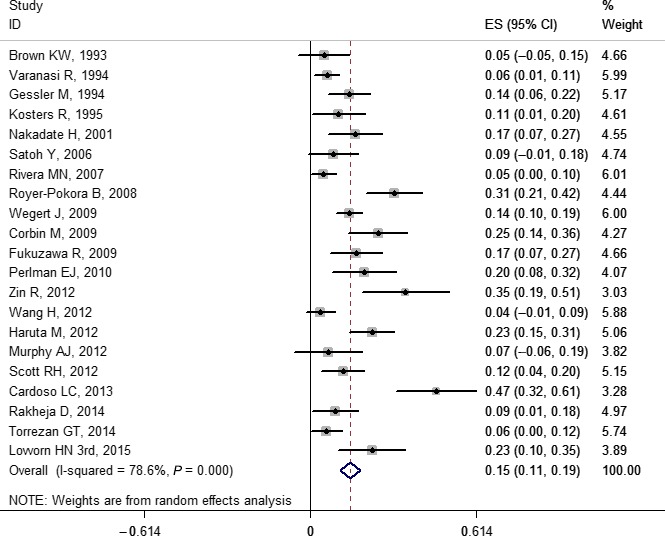
Forest plot for frequency of WT1 gene mutation in Wilms' tumor. Studies are plotted according to the first author's name and publication year. Horizontal lines represent 95% confidence interval (CI). Each square represents the prevalence point estimate and its size is proportional to the weight of the study. The diamond (and broken line) represents the overall summary estimate, with confidence interval given by its width. The unbroken vertical line is at the null value (prevalence = 0). ES, effect size.
Figure 3.
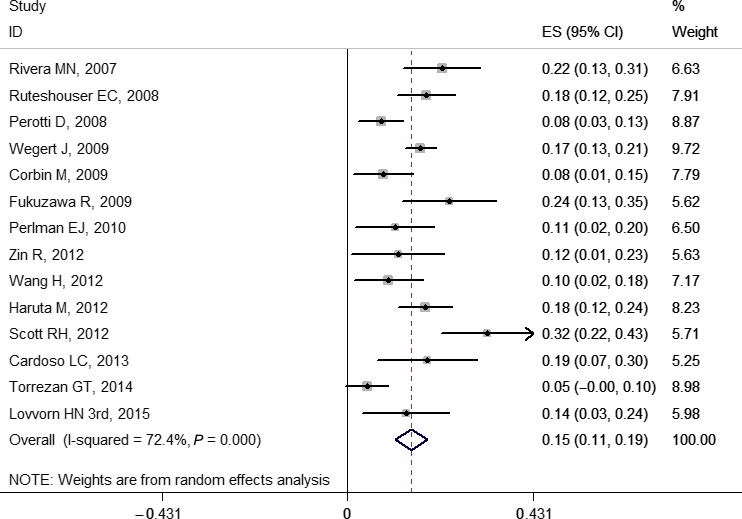
Forest plot for frequency of WTX gene mutation in Wilms' tumor. Studies are plotted according to the first author's name and publication year. Horizontal lines represent 95% confidence interval (CI). Each square represents the prevalence point estimate and its size is proportional to the weight of the study. The diamond (and broken line) represents the overall summary estimate, with confidence interval given by its width. The unbroken vertical line is at the null value (prevalence = 0). ES, effect size.
Figure 4.
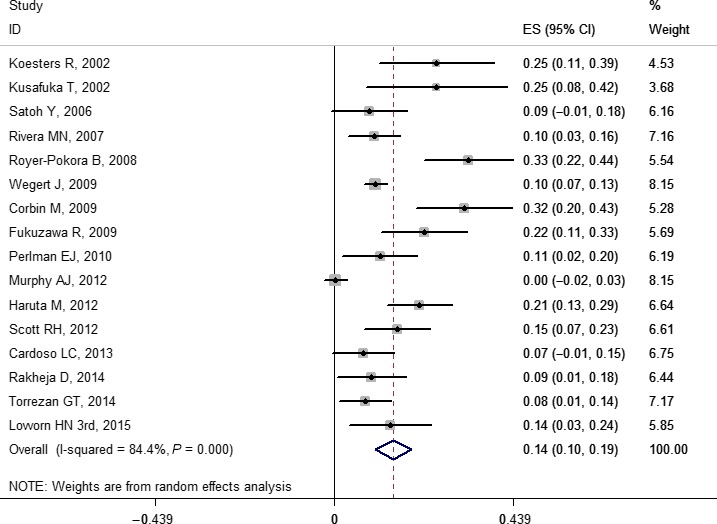
Forest plot for frequency of CTNNB1 gene mutation in Wilms' tumor. Studies are plotted according to the first author's name and publication year. Horizontal lines represent 95% confidence interval (CI). Each square represents the prevalence point estimate and its size is proportional to the weight of the study. The diamond (and broken line) represents the overall summary estimate, with confidence interval given by its width. The unbroken vertical line is at the null value (prevalence = 0). ES, effect size.
Sensitivity analysis
In a few genetic variations, the sensitivity analysis indicated that some results were unstable. See Figures S17–S35 for details.
Subgroup analysis and meta‐regression analyses
Based on the subgroup analysis, our results indicated that the pooled prevalence of mutations for Caucasian and non‐Caucasian populations in WT1, WTX, and CTNNB1 were: 0.14 (0.10, 0.19) and 0.16 (0.10, 0.22); 0.15 (0.10, 0.19) and 0.17 (0.13, 0.21); and 0.16 (0.11, 0.22) and 0.11 (0.05, 0.18), respectively. The forest plots of WT1, WTX, and CTNNB1 are shown in Figures 5, 6, and 7, respectively. No study‐level characteristics of these indicators were found to be significant in meta‐regression analyses (Figs S36–S38).
Figure 5.
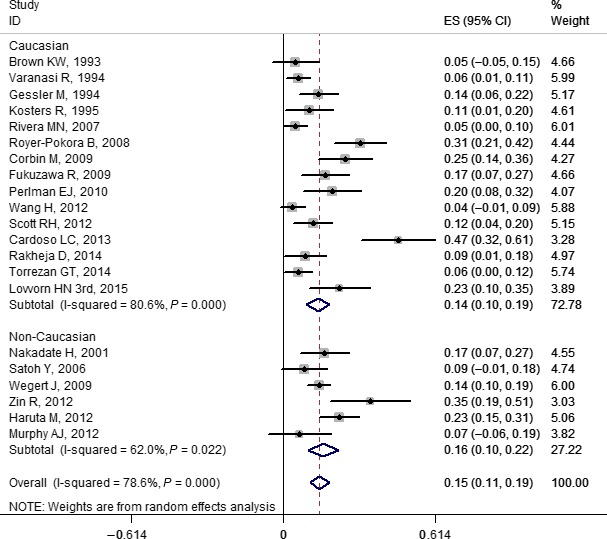
Forest plot for frequency of WT1 gene mutation in Wilms' tumor stratified by ethnicity. Studies are plotted according to the first author's name and publication year. Horizontal lines represent 95% confidence interval (CI). Each square represents the prevalence point estimate and its size is proportional to the weight of the study. The diamond (and broken line) represents the overall summary estimate, with CI given by its width. The unbroken vertical line is at the null value (prevalence = 0). ES, effect size.
Figure 6.
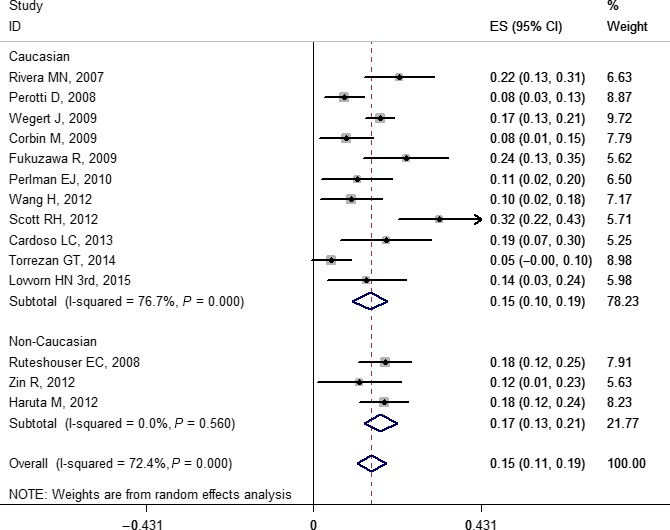
Forest plot for frequency of WTX gene mutation in Wilms' tumor stratified by ethnicity. Studies are plotted according to the first author's name and publication year. Horizontal lines represent 95% confidence interval (CI). Each square represents the prevalence point estimate and its size is proportional to the weight of the study. The diamond (and broken line) represents the overall summary estimate, with confidence interval given by its width. The unbroken vertical line is at the null value (prevalence = 0). ES, effect size.
Figure 7.
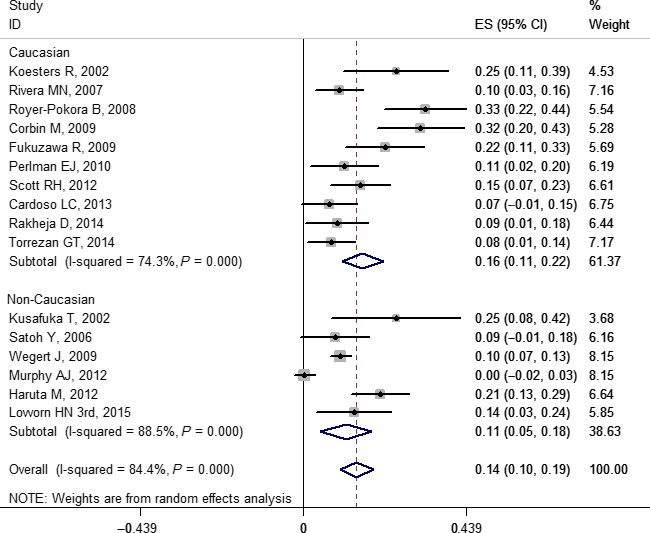
Forest plot for frequency of CTNNB1 gene mutation in Wilms' tumor stratified by ethnicity. Studies are plotted according to the first author's name and publication year. Horizontal lines represent 95% confidence interval CI. Each square represents the prevalence point estimate and its size is proportional to the weight of the study. The diamond (and broken line) represents the overall summary estimate, with confidence interval given by its width. The unbroken vertical line is at the null value (prevalence = 0). ES, effect size.
Publication bias
Begg's rank correlation test and Egger's linear regression test in some of our results indicated that some publication bias might exist (Table 1).
Quality assessment
The scores of included studies ranged from 5 to 15. Twelve studies scored less than or equal to 7, 10 studies scored more than or equal to 12, and 48 studies scored between 8 and 11 (Table S2). Details are provided in Table S3.
Discussion
Based on our systematic review and meta‐analysis, we found that the pooled prevalence of WT1, WTX, and CTNNB1 mutation in patients with WT was 0.141 (0.104, 0.178), 0.147 (0.110, 0.184), and 0.140 (0.100, 0.190), respectively. The incidence of WT1 and CTNNB1 combined was 28.1%, and WT1 and WTX combined was 28.8%. Our findings were basically consistent with Ruteshouser et al.'s report, which indicated that WT1 and WTX mutations occur with similar frequency, and that mutations in WT1, WTX, and CTNNB1 account for only approximately one‐third of tumors.14 However, the reported mutations in these three genes were mostly inconsistent in WT. Reasons for the difference were the relatively small number of investigated cases, and that reports on mutations in different ethnicities have been published. For example, one study reported that WT poses a significant cancer health disparity to black children of sub‐Saharan African ancestry, not only because of its more common occurrence among black populations worldwide, but also because of its persistently high lethality in resource‐constrained nations on the African continent, such as Kenya.42 Our analysis also found that there may be statistical differences between ethnicities across these genes.
Accumulation of the TP53 protein in WT specimens has been associated with unfavorable histology and treatment resistance.16, 17, 26 It has been further postulated that the TP53 mutation in WT is a late occurrence in its disease sequence and progression.33 There is a clear relationship between TP53 mutations and anaplastic WT, the histologic subtype with poorer prognosis. This indicates that these mutations are related to tumor progression and associated with a more aggressive type of disease.16, 26, 41 In anaplastic WT, the pooled frequency of TP53 mutation was 0.410 (0.214, 0.605) based on our systemic review. Therefore, this indicates that screening for such alterations may be advisable in routine diagnosis, especially if there is any hint of anaplasia.
The MYCN gene has been observed in several previous WT studies.20, 21, 28 Originally, Williams et al.20 reported that 4/54 anaplastic (7.4%) and 27/272 non‐anaplastic (9.9%) tumors in this series had MYCN gain. Overall, the results indicated that MYCN copy number gain was not restricted to the anaplastic series, but was relatively common in tumors of both histologies. Recently, Williams et al. described that copy number gains that included the MYCN locus were detected in 37/292 (12.7%) of tumors overall and in 7/23 (30.4%) of diffuse anaplastic WTs. Their finding of an association between MYCN gain and anaplasia, as well as outcome, makes the MYCN pathway an attractive target for further research into new approaches to treatment.21 However, the frequency of alterations in MYCN was merely 0.071 (0.041, 0.100) in our study. It indicates that the frequency of MYCN mutations are similarly uncommon, leaving a significant fraction of cases without an identified “driver” genetic defect.
Similar mutations of DROSHA and DGCR8, as well as a small number of mutations in MYCN, have recently been reported together with altered microRNA patterns in mutant tumors by whole exome study.27, 28, 29, 30 Their results provide evidence that DROSHA, DGCR8, and the microRNA biogenesis pathway may have a crucial role in WT tumorigenesis. DROSHA encodes a nuclear RNase III protein. One COG study reported that DROSHA E1147K is a recurrent mutation and that DROSHA and other microRNA‐processing genes are mutated in approximately 33% (22/66) of WT samples, implying that defective microRNA biogenesis may contribute to WT development.27 However, based on our meta‐analysis, we found that the general mutation prevalence of DROSHA and DGCR8 was 0.082 (0.048, 0.116) and 0.036 (0.026, 0.046), respectively, in WT. Therefore, as the COG cohort study includes WT samples of predominant blastemal histology, the frequency of mutations in this pathway in a broad unbiased WT series still remains to be determined.27
Use of LOH assays to determine areas of allele loss has shown that the majority of WT have few or no changes, and that these tend to be restricted to a few loci, principally at 1p, 11p, 11q, 16q, and 22q.28, 32, 43, 44 The National Wilms Tumor Study Group has prospectively investigated the influence of tumor‐specific LOH at chromosomes 1p and/or 16q on outcome, and reported that losses involving 1p and 16q correlated positively with a poor prognosis.32 Other studies have revealed an association of LOH at chromosomes 1p, 11q, 16q, and 22q with an increased risk of relapse.36, 44, 45 Although LOH on 11p is not associated with any difference in outcome in general, children younger than 2 years with small tumors and allele loss on 11p were recently found to be at greater risk for relapse when treated with minimal therapy (chemo‐naive).46 Our results indicate that the LOH signatures lie in the low sensitivity. This observation supports the need to combine biomarkers based on LOH analyses with other clinical, molecular, and histological prognostic factors but in larger series of patients.
In addition, characteristic chromosomal aberrations include gain at 1q and chromosome 12. The hallmark 1q gain has been reported by early chromosomal as well as array‐based studies.47, 48, 49 Furthermore, Hing et al. reported high frequency gain of 1q in 27 of 46 (59%) relapse versus 5 of 21 (24%) non‐relapse cases of WT.(49) Otherwise, the results of one study have confirmed a strong association between 1q gain and 1p and 16q loss.50 As a result of our meta‐analysis, the pooled prevalence of 1q and chromosome 12 gain was 0.218 (0.161, 0.275) and 0.273 (0.195, 0.350). However, the important gene or genes on 1p, 1q, chromosome 12, and 16q that contribute to tumorigenesis remain an enigma.
In subgroup analyses of WT1, WTX, and CTNNB1, the heterogeneity of the non‐Caucasian group in WTX was 0, indicating that ethnicity might be one of the sources of heterogeneity. However, in meta‐regression analyses, no study‐level characteristics of those indicators were found to be significant. This limitation was unavoidable as we had no access to primary data. It is possible that unidentified study‐level factors were not observed and the results could be exaggerated or narrowed. So our results suggest that we must pay attention to the report specification in future research.
Limitations
This meta‐analysis still has some limitations. Because information regarding subclasses (blastemal, epithelial, and stromal), bilateral/unilateral, and FHWT/UHWT were not given in most of the included studies, we could not carry out more detailed subgroup analysis to explore heterogeneity in this meta‐analysis. Moreover, the sensitivity analysis indicated that some of the results of our study were unstable. Begg's rank correlation test and Egger's linear regression test in some of our results also suggested that there might exist publication bias. In addition, some of the included studies were focused on germline mutations, but we did not distinguish between somatic and germline mutations, which may have affected the results. Because of the publication biases in WT1 and CTNNB1, we must interpret those results with caution.
Disclosure Statement
The authors have no conflict of interest.
Supporting information
Fig. S1. Forest plot for frequency of TP53 gene mutation.
Fig. S2. Forest plot for frequency of MYCN gene mutation.
Fig. S3. Forest plot for frequency of DROSHA gene mutation.
Fig. S4. Forest plot for frequency of DGCR8 gene mutation.
Fig. S5. Forest plot for frequency of loss of heterozygosity at 1p.
Fig. S6. Forest plot for frequency of loss of heterozygosity at 1p and 16q.
Fig. S7. Forest plot for frequency of loss of heterozygosity at 7p.
Fig. S8. Forest plot for frequency of loss of heterozygosity at 11p.
Fig. S9. Forest plot for frequency of loss of heterozygosity at 11p13.
Fig. S10. Forest plot for frequency of loss of heterozygosity at 11p15.15.
Fig. S11. Forest plot for frequency of loss of heterozygosity at 11p15.
Fig. S12. Forest plot for frequency of loss of heterozygosity at 11q.
Fig. S13. Forest plot for frequency of loss of heterozygosity at 16q.
Fig. S14. Forest plot for frequency of loss of heterozygosity at chromosome 22.
Fig. S15. Forest plot for frequency of gain at 1q.
Fig. S16. Forest plot for frequency of gain at chromosome 12.
Fig. S17. Sensitivity analysis for WT1.
Fig. S18. Sensitivity analysis for WTX.
Fig. S19. Sensitivity analysis for CTNNB1.
Fig. S20. Sensitivity analysis forTP53.
Fig. S21. Sensitivity analysis for MYCN.
Fig. S22. Sensitivity analysis for DGCR8.
Fig. S23. Sensitivity analysis for DORSHA.
Fig. S24. Sensitivity analysis for gain at 1q.
Fig. S25. Sensitivity analysis for gain at 12.
Fig. S26. Sensitivity analysis for loss of heterozygosity at 1p.
Fig. S27. Sensitivity analysis for loss of heterozygosity at 1p and 16q.
Fig. S28. Sensitivity analysis for loss of heterozygosity at 7p.
Fig. S29. Sensitivity analysis for loss of heterozygosity at 11p.
Fig. S30. Sensitivity analysis for loss of heterozygosity at 11p13.
Fig. S31. Sensitivity analysis for loss of heterozygosity at 11p15.5.
Fig. S32. Sensitivity analysis for loss of heterozygosity at 11p15.
Fig. S33. Sensitivity analysis for loss of heterozygosity at 11q.
Fig. S34. Sensitivity analysis for loss of heterozygosity at 16q.
Fig. S35. Sensitivity analysis for loss of heterozygosity at 22q.
Fig. S36. Meta regression for WT1.
Fig. S37. Meta regression for WTX.
Fig. S38. Meta regression for CTNNB1.
Table S1. Scale for quality assessment of published articles.
Table S2. Characteristics of 66 published articles included in the analysis.
Table S3. Results of quality assessment of published articles.
Acknowledgment
This work was supported by the Children's Hospital of Chongqing Medical University Clinical Research Projects (Project No.: lcyj2014‐16).
Cancer Sci 107 (2016) 690–699
Funding Information
Children's Hospital of Chongqing Medical University.
References
- 1. Stiller CA, Parkin DM. International variations in the incidence of childhood renal tumours. Br J Cancer 1990; 62: 1026–30. [DOI] [PMC free article] [PubMed] [Google Scholar]
- 2. Breslow NE, Beckwith JB, Perlman EJ, Reeve AE. Age distributions, birth weights, nephrogenic rests, and heterogeneity in the pathogenesis of Wilms tumor. Pediatr Blood Cancer 2006; 47: 260–7. [DOI] [PMC free article] [PubMed] [Google Scholar]
- 3. Breslow NE, Olson J, Moksness J, Beckwith JB, Grundy P. Familial Wilms' tumor: a descriptive study. Med Pediatr Oncol 1996; 27: 398–403. [DOI] [PubMed] [Google Scholar]
- 4. Mcdonald JM, Douglass EC, Fisher R et al Linkage of familial Wilms' tumor predisposition to chromosome 19 and a two‐locus model for the etiology of familial tumors. Cancer Res 1998; 58: 1387–90. [PubMed] [Google Scholar]
- 5. Rahman N, Arbour L, Tonin P et al Evidence for a familial Wilms' tumour gene (FWT1) on chromosome 17q12‐q21. Nat Genet 1996; 13: 461–3. [DOI] [PubMed] [Google Scholar]
- 6. Pelletier J, Bruening W, Kashtan CE et al Germline mutations in the Wilms' tumor suppressor gene are associated with abnormal urogenital development in Denys‐Drash syndrome. Cell 1991; 67: 437–47. [DOI] [PubMed] [Google Scholar]
- 7. Ohlsson R, Nyström A, Pfeifer‐Ohlsson S et al IGF2 is parentally imprinted during human embryogenesis and in the Beckwith‐Wiedemann syndrome. Nat Genet 1993; 4: 94–7. [DOI] [PubMed] [Google Scholar]
- 8. Call KM, Glaser T, Ito CY et al Isolation and characterization of a zinc finger polypeptide gene at the human chromosome 11 Wilms' tumor locus. Cell 1990; 60: 509–20. [DOI] [PubMed] [Google Scholar]
- 9. Gessler M, Poustka A, Cavenee W, Neve RL, Orkin SH, Bruns GA. Homozygous deletion in Wilms tumours of a zinc‐finger gene identified by chromosome jumping. Nature 1990; 343: 774–8. [DOI] [PubMed] [Google Scholar]
- 10. Grundy RG, Pritchard J, Baraitser M, Risdon A, Robards M. Perlman and Wiedemann‐Beckwith syndromes: two distinct conditions associated with Wilms' tumour. Eur J Pediatr 1992; 151: 895–8. [DOI] [PubMed] [Google Scholar]
- 11. Astuti D, Morris MR, Cooper WN et al Germline mutations in DIS3L2 cause the Perlman syndrome of overgrowth and Wilms tumor susceptibility. Nat Genet 2012; 44: 277–84. [DOI] [PubMed] [Google Scholar]
- 12. Koesters R, Ridder R, Kopp‐Schneider A et al Mutational activation of the beta‐catenin proto‐oncogene is a common event in the development of Wilms' tumors. Cancer Res 1999; 59: 3880–2. [PubMed] [Google Scholar]
- 13. Rivera MN, Kim WJ, Wells J et al An X chromosome gene, WTX, is commonly inactivated in Wilms tumor. Science 2007; 315: 642–5. [DOI] [PubMed] [Google Scholar]
- 14. Ruteshouser EC, Robinson SM, Huff V. Wilms tumor genetics: mutations in WT1, WTX, and CTNNB1 account for only about one‐third of tumors. Genes Chromosom Cancer 2008; 47: 461–70. [DOI] [PMC free article] [PubMed] [Google Scholar]
- 15. Wegert J, Wittmann S, Leuschner I, Geissinger E, Graf N, Gessler M. WTX inactivation is a frequent, but late event in Wilms tumors without apparent clinical impact. Genes Chromosom Cancer 2009; 48: 1102–11. [DOI] [PubMed] [Google Scholar]
- 16. Bardeesy N, Falkoff D, Petruzzi MJ et al Anaplastic Wilms' tumour, a subtype displaying poor prognosis, harbours p53 gene mutations. Nat Genet 1994; 7: 91–7. [DOI] [PubMed] [Google Scholar]
- 17. Lahoti C, Thorner P, Malkin D, Yeger H. Immunohistochemical detection of p53 in Wilms' tumors correlates with unfavorable outcome. Am J Pathol 1996; 148: 1577–89. [PMC free article] [PubMed] [Google Scholar]
- 18. Lovvorn HN, Westrup J, Opperman S et al CITED1 expression in Wilms' tumor and embryonic kidney. Neoplasia 2007; 9: 589–600. [DOI] [PMC free article] [PubMed] [Google Scholar]
- 19. Schaub R, Burger A, Bausch D, Niggli FK, Schäfer BW, Betts DR. Array comparative genomic hybridization reveals unbalanced gain of the MYCN region in Wilms tumors. Cancer Genet Cytogenet 2007; 172: 61–5. [DOI] [PubMed] [Google Scholar]
- 20. Williams RD, Al‐Saadi R, Natrajan R et al Molecular profiling reveals frequent gain of MYCN and anaplasia‐specific loss of 4q and 14q in Wilms tumor. Genes Chromosom Cancer 2011; 50: 982–95. [DOI] [PubMed] [Google Scholar]
- 21. Williams RD, Chagtai T, Alcaide‐German M et al Multiple mechanisms of MYCN dysregulation in Wilms tumour. Oncotarget 2015; 6: 7232–43. [DOI] [PMC free article] [PubMed] [Google Scholar]
- 22. Murphy AJ, Pierce J, de Caestecker C et al SIX2 and CITED1, markers of nephronic progenitor self‐renewal, remain active in primitive elements of Wilms' tumor. J Pediatr Surg 2012; 47: 1239–49. [DOI] [PMC free article] [PubMed] [Google Scholar]
- 23. Murphy AJ, Pierce J, de Caestecker C et al CITED1 confers stemness to Wilms tumor and enhances tumorigenic responses when enriched in the nucleus. Oncotarget 2014; 5: 386–402. [DOI] [PMC free article] [PubMed] [Google Scholar]
- 24. Libes JM, Seeley EH, Li M et al Race disparities in peptide profiles of north American and Kenyan Wilms tumor specimens. J Am Coll Surg 2014; 218: 707–20. [DOI] [PMC free article] [PubMed] [Google Scholar]
- 25. Pierce J, Murphy AJ, Panzer A et al SIX2 effects on Wilms tumor biology. Transl Oncol 2014; 7: 800–11. [DOI] [PMC free article] [PubMed] [Google Scholar]
- 26. Maschietto M, Williams RD, Chagtai T et al TP53 mutational status is a potential marker for risk stratification in Wilms tumour with diffuse anaplasia. PLoS ONE 2014; 9: e109924. [DOI] [PMC free article] [PubMed] [Google Scholar]
- 27. Torrezan GT, Ferreira EN, Nakahata AM et al Recurrent somatic mutation in DROSHA induces microRNA profile changes in Wilms tumour. Nat Commun 2014; 5: 4039. [DOI] [PMC free article] [PubMed] [Google Scholar]
- 28. Wegert J, Ishaque N, Vardapour R et al Mutations in the SIX1/2 pathway and the DROSHA/DGCR8 miRNA microprocessor complex underlie high‐risk blastemal type Wilms tumors. Cancer Cell 2015; 27: 298–311. [DOI] [PubMed] [Google Scholar]
- 29. Walz AL, Ooms A, Gadd S et al Recurrent DGCR8, DROSHA, and SIX homeodomain mutations in favorable histology Wilms tumors. Cancer Cell 2015; 27: 286–97. [DOI] [PMC free article] [PubMed] [Google Scholar]
- 30. Rakheja D, Chen KS, Liu Y et al Somatic mutations in DROSHA and DICER1 impair microRNA biogenesis through distinct mechanisms in Wilms tumours. Nat Commun 2014; 2: 4802. [DOI] [PMC free article] [PubMed] [Google Scholar]
- 31. Zin R, Pham K, Ashleigh M, Ravine D, Waring P, Charles A. SNP‐based arrays complement classic cytogenetics in the detection of chromosomal aberrations in Wilms' tumor. Cancer Genet 2012; 205: 80–93. [DOI] [PubMed] [Google Scholar]
- 32. Grundy PE, Breslow NE, Li S et al Loss of heterozygosity for chromosomes 1p and 16q is an adverse prognostic factor in favorable‐histology Wilms tumor: a report from the National Wilms Tumor Study Group. J Clin Oncol 2005; 23: 7312–21. [DOI] [PubMed] [Google Scholar]
- 33. Natrajan R, Williams RD, Hing SN et al Array CGH profiling of favourable histology Wilms tumours reveals novel gains and losses associated with relapse. J Pathol 2006; 210: 49–58. [DOI] [PubMed] [Google Scholar]
- 34. Segers H, van den Heuvel‐Eibrink MM, Williams RD et al Gain of 1q is a marker of poor prognosis in Wilms' tumors. Genes Chromosom Cancer 2013; 52: 1065–74. [DOI] [PubMed] [Google Scholar]
- 35. Dome JS, Perlman EJ, Graf N. Risk stratification for wilms tumor: current approach and future directions. Am Soc Clin Oncol Educ Book 2014; 34: 215–23. [DOI] [PubMed] [Google Scholar]
- 36. Wittmann S, Zirn B, Alkassar M, Ambros P, Graf N, Gessler M. Loss of 11q and 16q in Wilms tumors is associated with anaplasia, tumor recurrence, and poor prognosis. Genes Chromosom Cancer 2007; 46: 163–70. [DOI] [PubMed] [Google Scholar]
- 37. Little J, Bradley L, Bray MS et al Reporting, appraising, and integrating data on genotype prevalence and gene‐disease associations. Am J Epidemiol 2002; 156: 300–10. [DOI] [PubMed] [Google Scholar]
- 38. Scott RH, Murray A, Baskcomb L et al Stratification of Wilms tumor by genetic and epigenetic analysis. Oncotarget 2012; 3: 327–35. [DOI] [PMC free article] [PubMed] [Google Scholar]
- 39. Singh N, Sahu DK, Goel M, Kant R, Gupta DK. Retrospective analysis of FFPE based Wilms' Tumor samples through copy number and somatic mutation related Molecular Inversion Probe Based Array. Gene 2015; 505: 295–308. [DOI] [PubMed] [Google Scholar]
- 40. Nordenskjöld A, Friedman E, Sandstedt B, Söderhäll S, Anvret M. Constitutional and somatic mutations in the WTI gene in wilms' tumor patients. Int J Cancer 1995; 63: 516–22. [DOI] [PubMed] [Google Scholar]
- 41. Ohshima J, Haruta M, Arai Y et al Two candidate tumor suppressor genes, MEOX2 and SOSTDC1, identified in a 7p21 homozygous deletion region in a Wilms tumor. Genes Chromosom Cancer 2009; 48: 1037–50. [DOI] [PubMed] [Google Scholar]
- 42. Lovvorn HN 3rd, Pierce J, Libes J et al Genetic and chromosomal alterations in Kenyan Wilms Tumor. Genes Chromosom Cancer 2015; 54: 702–15. [DOI] [PMC free article] [PubMed] [Google Scholar]
- 43. Grundy PE, Telzerow PE, Breslow N, Moksness J, Huff V, Paterson MC. Loss of heterozygosity for chromosomes 16q and 1p in Wilms' tumors predicts an adverse outcome. Cancer Res 1994; 54: 2331–3. [PubMed] [Google Scholar]
- 44. Klamt B, Schulze M, Thäte C et al Allele loss in Wilms tumors of chromosome arms 11q, 16q, and 22q correlates with clinicopathological parameters. Genes Chromosom Cancer 1998; 22: 287–94. [DOI] [PubMed] [Google Scholar]
- 45. Messahel B, Williams R, Ridolfi A et al Allele loss at 16q defines poorer prognosis Wilms tumour irrespective of treatment approach in the UKW1–3 clinical trials: A Children's Cancer and Leukaemia Group (CCLG) study. Eur J Cancer 2009; 45: 819–26. [DOI] [PubMed] [Google Scholar]
- 46. Perlman EJ, Grundy PE, Anderson JR et al WT1 mutation and 11P15 loss of heterozygosity predict relapse in very low‐risk wilms tumors treated with surgery alone: A Children's Oncology Group Study. J Clin Oncol 2011; 29: 698–703. [DOI] [PMC free article] [PubMed] [Google Scholar]
- 47. Getman ME, Houseal TW, Miller GA, Grundy PE, Cowell JK. Landes GM Comparative genomic hybridization and its application to Wilms' tumorigenesis. Cytogenet Cell Genet 1998; 82: 284–90. [DOI] [PubMed] [Google Scholar]
- 48. Hawthorn L, Cowell JK. Analysis of Wilms tumors using SNP mapping array‐based comparative genomic hybridization. PLoS ONE 2011; 6: e18941. [DOI] [PMC free article] [PubMed] [Google Scholar]
- 49. Hing S, Lu YJ, Summersgill B et al. Gain of 1q is associated with adverse outcome in favorable histology Wilms' tumors. Am J Pathol 2001; 158: 393–8. [DOI] [PMC free article] [PubMed] [Google Scholar]
- 50. Gratias EJ, Jennings LJ, Anderson JR, Dome JS, Grundy P, Perlman EJ. Gain of 1q is associated with inferior event‐free and overall survival in patients with favorable histology Wilms tumor: a report from the Children's Oncology Group. Cancer 2013; 119: 3887–94. [DOI] [PMC free article] [PubMed] [Google Scholar]
- 51. Perotti D, Spreafico F, Torri F et al Genomic profiling by whole‐genome single nucleotide polymorphism arrays in Wilms tumor and association with relapse. Genes Chromosom Cancer 2012; 51: 644–53. [DOI] [PubMed] [Google Scholar]
- 52. Andrade RC, Cardoso LC, Ferman SE et al Association of TP53 polymorphisms on the risk of Wilms tumor. Pediatr Blood Cancer 2014; 61: 436–41. [DOI] [PubMed] [Google Scholar]
- 53. Cardoso LC, De Souza KR, De O Reis AH et al WT1, WTX and CTNNB1 mutation analysis in 43 patients with sporadic Wilms' tumor. Oncol Rep 2013; 29: 315–20. [DOI] [PubMed] [Google Scholar]
- 54. Corbin M, de Reyniès A, Rickman DS et al WNT/β‐catenin pathway activation in Wilms tumors: a unifying mechanism with multiple entries? Genes Chromosom Cancer 2009; 48: 816–27. [DOI] [PubMed] [Google Scholar]
- 55. Wang H, Shen Y, Sun N, Jiang YP, Li ML, Sun L. Identification and analysis of mutations in WTX and WT1 genes in peripheral blood and tumor tissue of children with Wilms' tumor. Chin Med J (Engl) 2012; 125: 1773–9. [PubMed] [Google Scholar]
- 56. Haruta M, Arai Y, Watanabe N et al Different incidences of epigenetic but not genetic abnormalities between Wilms tumors in Japanese and Caucasian children. Cancer Sci 2012; 103: 1129–35. [DOI] [PMC free article] [PubMed] [Google Scholar]
- 57. Fukuzawa R, Anaka MR, Weeks RJ, Morison IM, Reeve AE. Canonical WNT signalling determines lineage specificity in Wilms tumour. Oncogene 2009; 28: 1063–75. [DOI] [PubMed] [Google Scholar]
- 58. Murphy AJ, Axt JR, de Caestecker C et al Molecular characterization of Wilms' tumor from a resource‐constrained region of sub‐Saharan Africa. Int J Cancer 2012; 131: E983–94. [DOI] [PMC free article] [PubMed] [Google Scholar]
- 59. Nakadate H, Yokomori K, Watanabe N et al Mutations/deletions of the WT1 gene, loss of heterozygosity on chromosome arms 11p and 11q, chromosome ploidy and histology in Wilms' tumors in Japan. Int J Cancer 2001; 94: 396–400. [DOI] [PubMed] [Google Scholar]
- 60. Royer‐Pokora B, Weirich A, Schumacher V et al Clinical relevance of mutations in the Wilms tumor suppressor 1 gene WT1 and the cadherin‐associated protein beta1 gene CTNNB1 for patients with Wilms tumors: results of long‐term surveillance of 71 patients from International Society of Pediatric Oncology Study 9/Society for Pediatric Oncology. Cancer 2008; 113: 1080–9. [DOI] [PubMed] [Google Scholar]
- 61. Satoh Y, Nakadate H, Nakagawachi T et al Genetic and epigenetic alterations on the short arm of chromosome 11 are involved in a majority of sporadic Wilms' tumours. Br J Cancer 2006; 95: 541–7. [DOI] [PMC free article] [PubMed] [Google Scholar]
- 62. Varanasi R, Bardeesy N, Ghahremani M et al Fine structure analysis of the WT1 gene in sporadic Wilms tumors. Proc Natl Acad Sci USA 1994; 91: 3554–8. [DOI] [PMC free article] [PubMed] [Google Scholar]
- 63. Gessler M, König A, Arden K et al Infrequent mutation of the WT1 gene in 77 Wilms' Tumors. Hum Mutat 1994; 3: 212–22. [DOI] [PubMed] [Google Scholar]
- 64. Brown KW, Wilmore HP, Watson JE, Mott MG, Berry PJ, Maitland NJ. Low frequency of mutations in the WT1 coding region in Wilms' tumor. Genes Chromosom Cancer 1993; 8: 74–9. [DOI] [PubMed] [Google Scholar]
- 65. Kosters R, Adams V, Hassam S et al Mutational analysis of the tumor‐suppressor gene WT1 ‐ detection of a novel homozygous point mutation in sporadic unilateral wilms‐tumor. Int J Oncol 1995; 7: 1103–7. [DOI] [PubMed] [Google Scholar]
- 66. Perotti D, Gamba B, Sardella M et al Functional inactivation of the WTX gene is not a frequent event in Wilms' tumors. Oncogene 2008; 27: 4625–32. [DOI] [PubMed] [Google Scholar]
- 67. Koesters R, Niggli F, von Knebel Doeberitz M, Stallmach T. Nuclear accumulation of beta‐catenin protein in Wilms' tumours. J Pathol 2003; 199: 68–76. [DOI] [PubMed] [Google Scholar]
- 68. Dao D, Walsh CP, Yuan L et al Multipoint analysis of human chromosome 11p15/mouse distal chromosome 7: inclusion of H19/IGF2 in the minimal WT2 region, gene specificity of H19 silencing in Wilms' tumorigenesis and methylation hyper‐dependence of H19 imprinting. Hum Mol Genet 1999; 8: 1337–52. [DOI] [PubMed] [Google Scholar]
- 69. Mdzin R, Murch A, Charles A. Cytogenetic findings in Wilms' tumour: a single institute study. Pathology 2010; 42: 643–9. [DOI] [PubMed] [Google Scholar]
- 70. Austruy E, Candon S, Henry I et al Characterization of regions of chromosomes 12 and 16 involved in nephroblastoma tumorigenesis. Genes Chromosom Cancer 1995; 14: 285–94. [DOI] [PubMed] [Google Scholar]
- 71. Spreafico F, Gamba B, Mariani L et al Loss of Heterozygosity analysis at different chromosome regions in Wilms tumor confirms 1p allelic loss as a marker of worse prognosis: a study from the Italian association of pediatric hematology and oncology. J Urol 2013; 189: 260–6. [DOI] [PubMed] [Google Scholar]
- 72. Sredni ST, Gadd S, Huang CC et al Subsets of very low risk Wilms tumor show distinctive gene expression, histologic, and clinical features. Clin Cancer Res 2009; 15: 6800–9. [DOI] [PMC free article] [PubMed] [Google Scholar]
- 73. Yuan E, Li CM, Yamashiro DJ et al Genomic profiling maps loss of heterozygosity and defines the timing and stage dependence of epigenetic and genetic events in Wilms' tumors. Mol Cancer Res 2005; 3: 493–502. [DOI] [PubMed] [Google Scholar]
- 74. Steinberg R, Freud E, Zer M et al High frequency of loss of heterozygosity for 1p35‐p36 (D1S247) in Wilms tumor. Cancer Genet Cytogenet 2000; 117: 136–9. [DOI] [PubMed] [Google Scholar]
- 75. Benetkiewicz M, Díaz de Ståhl T, Gördör A et al Identification of limited regions of genetic aberrations in patients affected with Wilms' tumor using a tiling‐path chromosome 22 array. Int J Cancer 2006; 119: 571–8. [DOI] [PubMed] [Google Scholar]
- 76. Coppes MJ, Bonetta L, Huang A et al Loss of heterozygosity mapping in Wilms tumor indicates the involvement of three distinct regions and a limited role for nondisjunction or mitotic recombination. Genes Chromosom Cancer 1992; 5: 326–34. [DOI] [PubMed] [Google Scholar]
- 77. Mason JE, Goodfellow PJ, Grundy PE, Skinner MA. 16q loss of heterozygosity and microsatellite instability in Wilms' tumor. J Pediatr Surg 2000; 35: 891–6. [DOI] [PubMed] [Google Scholar]
- 78. Mummert SK, Lobanenkov VA, Feinberg AP. Association of chromosome arm 16q loss with loss of imprinting of insulin‐like growth factor–II in Wilms tumor. Genes Chromosom Cancer 2005; 43: 155–61. [DOI] [PubMed] [Google Scholar]
- 79. Skotnicka‐Klonowicz G, Rieske P, Bartkowiak J, Szymik‐Kantorowicz S, Daszkiewicz P, Debiec‐Rychter M. 16q heterozygosity loss in Wilms' tumour in children and its clinical importance. Eur J Surg Oncol 2000; 26: 61–6. [DOI] [PubMed] [Google Scholar]
- 80. Blish KR, Clausen KA, Hawkins GA et al Loss of heterozygosity and SOSTDC1 in adult and pediatric renal tumors. J Exp Clin Cancer Res 2010; 29: 147. [DOI] [PMC free article] [PubMed] [Google Scholar]
- 81. Miozzo M, Perotti D, Minoletti F et al Mapping of a putative tumor suppressor locus to proximal 7p in Wilms tumors. Genomics 1996; 37: 310–5. [DOI] [PubMed] [Google Scholar]
- 82. Sigamani E, Wari MN, Iyer VK et al Loss of heterozygosity at 11p13 and 11p15 in Wilms tumor: a study of 22 cases from India. Pediatr Surg Int 2013; 29: 223–7. [DOI] [PubMed] [Google Scholar]
- 83. Zhuang Z, Merino MJ, Vortmeyer AO et al Identical genetic changes in different histologic components of Wilms' tumors. J Natl Cancer Inst 1997; 89: 1148–52. [DOI] [PubMed] [Google Scholar]
- 84. Williams RD, Al‐Saadi R, Chagtai T et al Subtype‐specific FBXW7 mutation and MYCN copy number gain in Wilms' tumor. Clin Cancer Res 2010; 16: 2036–45. [DOI] [PMC free article] [PubMed] [Google Scholar]
Associated Data
This section collects any data citations, data availability statements, or supplementary materials included in this article.
Supplementary Materials
Fig. S1. Forest plot for frequency of TP53 gene mutation.
Fig. S2. Forest plot for frequency of MYCN gene mutation.
Fig. S3. Forest plot for frequency of DROSHA gene mutation.
Fig. S4. Forest plot for frequency of DGCR8 gene mutation.
Fig. S5. Forest plot for frequency of loss of heterozygosity at 1p.
Fig. S6. Forest plot for frequency of loss of heterozygosity at 1p and 16q.
Fig. S7. Forest plot for frequency of loss of heterozygosity at 7p.
Fig. S8. Forest plot for frequency of loss of heterozygosity at 11p.
Fig. S9. Forest plot for frequency of loss of heterozygosity at 11p13.
Fig. S10. Forest plot for frequency of loss of heterozygosity at 11p15.15.
Fig. S11. Forest plot for frequency of loss of heterozygosity at 11p15.
Fig. S12. Forest plot for frequency of loss of heterozygosity at 11q.
Fig. S13. Forest plot for frequency of loss of heterozygosity at 16q.
Fig. S14. Forest plot for frequency of loss of heterozygosity at chromosome 22.
Fig. S15. Forest plot for frequency of gain at 1q.
Fig. S16. Forest plot for frequency of gain at chromosome 12.
Fig. S17. Sensitivity analysis for WT1.
Fig. S18. Sensitivity analysis for WTX.
Fig. S19. Sensitivity analysis for CTNNB1.
Fig. S20. Sensitivity analysis forTP53.
Fig. S21. Sensitivity analysis for MYCN.
Fig. S22. Sensitivity analysis for DGCR8.
Fig. S23. Sensitivity analysis for DORSHA.
Fig. S24. Sensitivity analysis for gain at 1q.
Fig. S25. Sensitivity analysis for gain at 12.
Fig. S26. Sensitivity analysis for loss of heterozygosity at 1p.
Fig. S27. Sensitivity analysis for loss of heterozygosity at 1p and 16q.
Fig. S28. Sensitivity analysis for loss of heterozygosity at 7p.
Fig. S29. Sensitivity analysis for loss of heterozygosity at 11p.
Fig. S30. Sensitivity analysis for loss of heterozygosity at 11p13.
Fig. S31. Sensitivity analysis for loss of heterozygosity at 11p15.5.
Fig. S32. Sensitivity analysis for loss of heterozygosity at 11p15.
Fig. S33. Sensitivity analysis for loss of heterozygosity at 11q.
Fig. S34. Sensitivity analysis for loss of heterozygosity at 16q.
Fig. S35. Sensitivity analysis for loss of heterozygosity at 22q.
Fig. S36. Meta regression for WT1.
Fig. S37. Meta regression for WTX.
Fig. S38. Meta regression for CTNNB1.
Table S1. Scale for quality assessment of published articles.
Table S2. Characteristics of 66 published articles included in the analysis.
Table S3. Results of quality assessment of published articles.