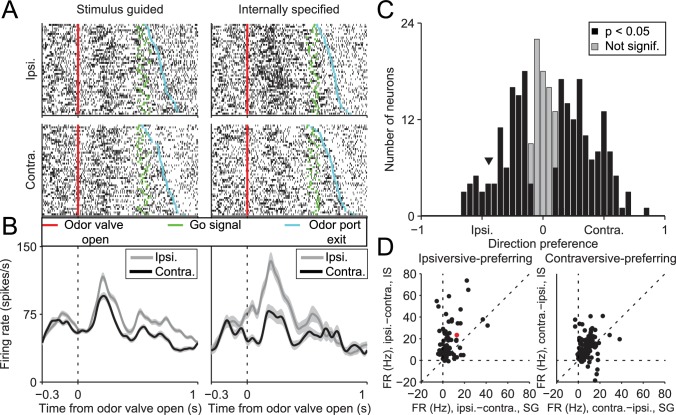
Figure 3. SNr activity during the delay epoch depends on movement direction and trial type.
(A) Rasters for an example neuron grouped by movement direction (rows) and trial type (columns). For each raster, each row shows spikes (black ticks) in one trial, aligned to time of odor valve open (red line) and sorted by duration of delay epoch. Green ticks, times of go signal; blue ticks, times of odor port exit. Fifty pseudo-randomly selected trials are shown per group. (B) Peri-event histograms showing average activity, separately by direction, in stimulus-guided (left) and internally-specified (right) trials. Shading, ± SEM. Histograms are smoothed with a Gaussian filter (σ = 15 ms). Ipsi., ipsiversive; Contra., contraversive. (C) Histogram of direction preferences during delay epoch across population of neurons. Arrowhead corresponds to example neuron in A. (D) Difference in delay-epoch firing rate between ipsiversive and contraversive trials in SG vs. IS trials in the same session, separately for ipsiversive-preferring neurons (left subpanel, corresponding to left black bars in C) and contraversive-preferring neurons (right subpanel, corresponding to right black bars in C). Only correct trials are included; all choices on 50/50 SG trials were considered correct regardless of whether they were rewarded. Dashed lines show x = 0, y = 0, and x = y. Red marker corresponds to example neuron from A and B. FR, firing rate.

