

Abstract
Purpose
Prostaglandin-endoperoxide synthase 2 (PTGS2, cyclooxygenase-2; a target of aspirin) produces inflammatory mediator prostaglandin E2 (PGE2), and contributes to colorectal neoplasia development. PTGS2-driven inflammatory responses can induce tumor expression of microRNA MIR21 (miR-21) that can increase local PGE2 level by downregulating PGE2-metabolizing enzymes. We hypothesized that the prognostic association of tumor MIR21 expression level in colorectal carcinoma might depend on inflammatory tumor microenvironment and be stronger in tumors expressing high-level PTGS2.
Experimental Design
Utilizing 765 rectal and colon cancer specimens in the Nurses’ Health Study and the Health Professionals Follow-up Study, we measured MIR21 expression by quantitative reverse-transcription PCR, and PTGS2 expression by immunohistochemistry. Cox proportional hazards regression model was used to assess statistical interaction between MIR21 and PTGS2 in colorectal cancer-specific survival analysis, controlling for potential confounders including microsatellite instability, CpG island methylator phenotype, LINE-1 methylation level, and KRAS, BRAF, and PIK3CA mutations.
Results
Tumor MIR21 expression level was associated with higher colorectal cancer-specific mortality (Ptrend = 0.029), and there was a statistically significant interaction between MIR21 and PTGS2 (Pinteraction = 0.0004). The association between MIR21 expression and colorectal cancer-specific mortality was statistically significant in PTGS2-high cancers (multivariable hazard ratio of the highest vs. lowest quartile of MIR21, 2.28; 95% confidence interval, 1.42 to 3.67; Ptrend = 0.0004) but not in PTGS2-absent/low cancers (Ptrend = 0.22).
Conclusions
MIR21 expression level in colorectal carcinoma is associated with worse clinical outcome, and this association is stronger in carcinomas expressing high-level PTGS2, suggesting complex roles of immunity and inflammation in tumor progression.
Keywords: colorectum, epigenetics, inflammation, molecular pathological epidemiology, non-coding RNA
Introduction
Colorectal cancers develop through the accumulation of genetic and epigenetic alterations and through tumor-host interactions including inflammatory responses and host immunity (1, 2). Prostaglandin-endoperoxide synthase 2 (PTGS2, cyclooxygenase-2) produces inflammatory mediator prostaglandin E2 (PGE2), and contributes to colorectal tumor development and progression (3–5). Randomized controlled trials and observational studies have demonstrated that regular use of aspirin (PTGS2 inhibitor) reduces the risk of colorectal neoplasia incidence and mortality (6, 7). Levels of PGE2 in the tumor microenvironment are likely influenced by PTGS2 that produces PGE2 (3). Previous studies suggest that cellular PTGS2 expression may influence effects of aspirin and selective inhibitors of PTGS2 on colorectal tumors (8, 9).
MicroRNAs are small non-coding RNAs that posttranscriptionally regulate gene expression, and have been shown to influence diverse physiological and pathological processes, including immunity, inflammation, and carcinogenesis (10). Accumulating evidence indicates that inflammatory responses can alter expression of microRNAs, some of which may contribute to tumor progression (11, 12). Among those microRNAs, MIR21 (miR-21) has been shown to promote inflammation-associated colorectal tumorigenesis in animal models (13, 14). In addition, studies of human colorectal cancer tissue have shown that MIR21 is upregulated in colorectal cancer cells, and that tumor MIR21 expression level is associated with high-level expression of the genes involved in inflammatory responses and worse clinical outcome (15, 16). MIR21 appears to downregulate gene products that catalyze degradation of PGE2, which leads to increased level of PGE2 in the tumor microenvironment and promotes tumor growth in a xenograft model (17). Hence, there might be a synergistic effect of MIR21 and PTGS2 on tumor progression. We hypothesized that the association of tumor MIR21 expression level with worse clinical outcome in colorectal cancer might be stronger in cancers expressing high-level PTGS2.
To test this hypothesis, we utilized resources of 765 colorectal cancer cases in two U.S. nationwide prospective cohort studies (the Nurses’ Health Study [NHS] and the Health Professionals Follow-up Study [HPFS]), and examined a statistical interaction between tumor MIR21 and PTGS2 expression in survival analysis, controlling for potential confounders including major molecular features of colorectal cancer.
Materials and Methods
Study population
We utilized the database of colorectal carcinoma cases within two U.S. nationwide prospective cohort studies, the NHS (121,701 women who enrolled in 1976) and the HPFS (51,529 men who enrolled in 1986) (18, 19). Every 2 years, participants were sent follow-up questionnaires to collect information on health and lifestyle factors, and asked whether they had received diagnoses of major diseases including cancer. The National Death Index was used to ascertain deaths of study participants and identify unreported lethal colorectal cancer cases. For incident colorectal cancer cases, medical records were reviewed. If a patient was deceased, the cause of death was assigned by study physicians. Formalin-fixed paraffin-embedded (FFPE) tissue blocks were collected from hospitals where participants with colorectal cancer had undergone tumor resection. A single pathologist (S.O.), who was unaware of other data, conducted a centralized review of hematoxylin and eosin-stained tissue sections of all colorectal carcinoma cases, and recorded pathological features. Tumor differentiation was categorized as well to moderate or poor (>50% vs. ≤50% glandular area). We analyzed available data on tumor MIR21 and PTGS2 expression and patient survival in 765 patients diagnosed up to 2008. Patients were followed until death or January 1, 2012, whichever came first. Written informed consent was obtained from all study participants. The procedures and protocols of this study were approved by the institutional review boards for the Harvard T.H. Chan School of Public Health and the Brigham and Women’s Hospital (Boston, MA, USA).
RNA isolation and quantitative reverse-transcription polymerase chain reaction (PCR) for MIR21
RNA was extracted from colorectal cancer tissue in whole-tissue sections of FFPE specimens with the use of RecoverAll™ Total Nucleic Acid Isolation Kit (Ambion Inc, Austin, TX). Quantitative reverse-transcription PCR assays for MIR21 and RNU6-2 were performed according to miScript PCR System protocol (Qiagen, Valencia, CA) after assay validation as previously described (20). Briefly, cDNA was synthesized with the use of miScript II RT Kit (Qiagen, Valencia, CA). Each reaction was performed in 25 μL solution containing 1× final concentration QuantiTect SYBR Green PCR Master Mix (Qiagen, Valencia, CA) and each miScript Primer Assay (Qiagen, Valencia, CA) specific for MIR21 (catalog number, MS00009079) and RNU6-2 (catalog number, MS00033740) in a 96-well optical PCR plate. Amplification and detection of MIR21 and RNU6-2 were performed with the StepOnePlus Real-Time PCR Systems (Applied Biosystems, San Diego, CA) with the use of the following reaction conditions: 15 minutes at 95°C and 40 cycles of 15 seconds at 94°C, 30 seconds at 55°C, and 30 seconds at 70°C.
Our validation study has previously shown that the cycle threshold (Ct) values in the quantitative reverse-transcription PCR assays for MIR21 and RNU6-2 decreased linearly with the amount of input cDNA using 10-fold dilution series from the same specimen (r2 > 0.99), and that the inter-assay coefficient of variation of Ct values from the same specimen in five different batches was ≤1% for MIR21 and RNU6-2 (20). Each specimen was analyzed in duplicate for each target in a single batch, and we used the mean of the two Ct values for each target. Spearman’s rank-correlation coefficient between the two Ct values (in duplicated runs) was 0.99 in quantitative PCR assays for MIR21 and RNU6-2 (20). MIR21 expression level in each specimen was calculated as a relative unitless value normalized with RNU6-2 using the 2−∆Ct method (where ∆Ct = “the mean Ct value of MIR21” − “the mean Ct value of RNU6-2”) as previously described (20).
Immunohistochemistry for PTGS2 expression
Immunohistochemistry for PTGS2 (cyclooxygenase-2) was performed using anti-PTGS2 antibody (Cayman Chemical; dilution 1:300) as previously described (5, 8). A single pathologist (S.O.), unaware of other data, interpreted tumor PTGS2 expression level (absent, low, or high), compared with adjacent normal colonic epithelium. A random sample of 124 cancers was examined by a second pathologist (T.M.), and concordance between the two observers was 0.85 (κ = 0.69) (18). Representative sections from PTGS2-absent, PTGS2-low, and PTGS2-high tumors have been shown in our previous study (5).
Analyses of microsatellite instability (MSI), DNA methylation, and KRAS, BRAF, and PIK3CA mutations
DNA was extracted from archival colorectal cancer tissue blocks. MSI status was analyzed with use of 10 microsatellite markers (D2S123, D5S346, D17S250, BAT25, BAT26, BAT40, D18S55, D18S56, D18S67, and D18S487) as previously described (21). We defined MSI-high as the presence of instability in ≥30% of the markers, and MSI-low/microsatellite stable (MSS) as instability in <30% of the markers. Methylation analyses of long interspersed nucleotide element-1 (LINE-1) (22, 23) and eight promoter CpG islands specific for CpG island methylator phenotype (CIMP) (CACNA1G, CDKN2A, CRABP1, IGF2, MLH1, NEUROG1, RUNX3, and SOCS1) (24, 25) were performed. PCR reaction and pyrosequencing were performed for KRAS (codons 12, 13, 61, and 146) (26, 27), BRAF (codon 600) (21), and PIK3CA (exons 9 and 20) (28).
Statistical analysis
All statistical analyses were conducted using SAS (version 9.3, SAS Institute, Cary, NC) and all P values were two-sided. Our primary hypothesis testing was a statistical interaction between tumor MIR21 and PTGS2 expression in relation to colorectal cancer-specific mortality. Neither MIR21 expression nor log-transformed values of MIR21 fit a normal distribution with the use of the Kolmogorov-Smirnov test for normality (P < 0.01). We conducted statistical test for a linear trend across ordinal quartile categories (1 to 4) of the tumor MIR21 expression level as a continuous variable in the Cox regression model. All other analyses including evaluation of individual hazard ratio (HR) estimates were secondary analyses. The statistical interaction was assessed by the Wald test on the cross-product term of tumor MIR21 expression (ordinal quartile categories [1 to 4]) and PTGS2 expression (ordinal categories; absent [1], low [2], and high [3]) variables in a Cox proportional hazards regression model. A two-sided α level was set at 0.05 for our primary hypothesis testing. For all of the primary and secondary analyses, we interpreted our results cautiously, given the exploratory hypothesis-generating nature of this study.
For analyses of colorectal cancer-specific mortality, deaths as a result of other causes were censored. To control for confounding, we used multivariable Cox proportional hazards regression models. In addition to tumor MIR21 expression level, the multivariable model initially included sex, age at diagnosis (continuous), year of diagnosis (continuous), family history of colorectal cancer in a first-degree relative (present vs. absent), tumor location (proximal colon vs. distal colon vs. rectum), disease stage (I/II vs. III/IV), tumor differentiation (well/moderate vs. poor), MSI (high vs. MSI-low/MSS), CIMP (high vs. low/negative), KRAS (mutant vs. wild-type), BRAF (mutant vs. wild-type), PIK3CA (mutant vs. wild-type), and tumor LINE-1 methylation level (continuous). A backward elimination was carried out with P = 0.05 as a threshold, to select variables for the final model. For cases (3.0%) with missing information on LINE-1 methylation level, we assigned a separate indicator variable. For cases with missing information in any of the categorical covariates (family history of colorectal cancer in a first-degree relative [0.4%], tumor location [0.4%], disease stage [5.9%], tumor differentiation [0.1%], MSI [3.4%], CIMP [7.2%], KRAS [3.0%], BRAF [2.4%], and PIK3CA [9.4%]), we included these cases in the majority category of a given covariate to minimize the number of variables in multivariable Cox models. We confirmed that excluding the cases with missing information in any of the covariates did not substantially alter results (data not shown). The proportionality of hazards assumption was assessed by a time-varying covariate, using an interaction term of survival time and tumor MIR21 expression level variable (P = 0.63 for colorectal cancer-specific mortality and P = 0.11 for overall mortality). The Kaplan-Meier method was used to describe the distribution of colorectal cancer-specific survival and overall survival, and the log-rank test for trend was performed to assess a linear trend in survival probability across the ordinal quartile categories of tumor MIR21 expression level.
All cross-sectional univariable analyses for clinical, pathological, and tumor molecular associations were secondary analyses, and we adjusted two-sided α level to 0.003 (= 0.05/15) by simple Bonferroni correction for multiple hypothesis testing. To assess associations between categorical data, the chi-square test was performed. To compare mean age and mean LINE-1 methylation levels, an analysis of variance assuming equal variances was performed.
Results
Clinical, pathological, and tumor molecular associations
To test our primary hypothesis on the statistical interaction between tumor MIR21 and PTGS2 expression in colorectal cancer-specific survival analysis, we utilized the database of 765 colorectal cancer cases within the two prospective cohort studies. We measured tumor MIR21 expression level, using the quantitative reverse-transcription PCR assay as previously described (20). Table 1 summarizes clinical, pathological, and tumor molecular features according to tumor MIR21 expression level. High-level tumor MIR21 expression was associated with higher disease stage and BRAF mutation (P ≤ 0.0008 with adjusted α level of 0.003 for multiple hypothesis testing).
Table 1.
Clinical, pathological, and tumor molecular features according to tumor MIR21 expression level in 765 colorectal cancer cases
| Characteristica | Tumor MIR21 expression level (quartile)
|
|||||
|---|---|---|---|---|---|---|
| Total No. (n = 765) |
Quartile 1 (lowest) (n = 192) |
Quartile 2 (n = 190) |
Quartile 3 (n = 192) |
Quartile 4 (highest) (n = 191) |
P valueb | |
| Mean age ± SD (year) | 68.5 ± 8.7 | 67.2 ± 8.6 | 68.7 ± 9.1 | 69.5 ± 7.8 | 68.5 ± 9.3 | 0.07 |
| Sex | 0.052 | |||||
| Men | 328 (43%) | 84 (44%) | 79 (42%) | 96 (50%) | 69 (36%) | |
| Women | 437 (57%) | 108 (56%) | 111 (58%) | 96 (50%) | 122 (64%) | |
| Year of diagnosis | 0.014 | |||||
| Prior to 1995 | 276 (36%) | 88 (46%) | 70 (37%) | 58 (30%) | 60 (31%) | |
| 1996 to 2000 | 250 (33%) | 54 (28%) | 66 (35%) | 60 (31%) | 70 (37%) | |
| 2001 to 2008 | 239 (31%) | 50 (26%) | 54 (28%) | 74 (39%) | 61 (32%) | |
| Family history of colorectal cancer in a first-degree relative | 0.40 | |||||
| Absent | 605 (79%) | 148 (77%) | 158 (84%) | 151 (79%) | 148 (78%) | |
| Present | 157 (21%) | 44 (23%) | 31 (16%) | 40 (21%) | 42 (22%) | |
| Tumor location | 0.013 | |||||
| Cecum | 134 (18%) | 25 (13%) | 30 (16%) | 41 (21%) | 38 (20%) | |
| Ascending to transverse colon | 242 (32%) | 48 (25%) | 59 (31%) | 62 (32%) | 73 (39%) | |
| Splenic flexure to sigmoid | 216 (28%) | 66 (35%) | 60 (32%) | 44 (23%) | 46 (24%) | |
| Rectosigmoid and rectum | 170 (22%) | 52 (27%) | 40 (21%) | 45 (24%) | 33 (17%) | |
| Disease stage | 0.0008 | |||||
| I | 171 (24%) | 56 (32%) | 45 (25%) | 39 (21%) | 31 (17%) | |
| II | 236 (33%) | 56 (32%) | 65 (37%) | 60 (33%) | 55 (30%) | |
| III | 213 (29%) | 39 (22%) | 50 (28%) | 66 (36%) | 58 (32%) | |
| IV | 100 (14%) | 26 (14%) | 18 (10%) | 17 (9.3%) | 39 (21%) | |
| Tumor differentiation | 0.15 | |||||
| Well/moderate | 694 (91%) | 173 (91%) | 179 (94%) | 175 (91%) | 167 (87%) | |
| Poor | 70 (9.2%) | 18 (9.4%) | 11 (5.8%) | 17 (8.9%) | 24 (13%) | |
| PTGS2 expression | 0.92 | |||||
| Absent | 125 (16%) | 33 (17%) | 26 (14%) | 34 (18%) | 32 (17%) | |
| Low | 170 (22%) | 40 (21%) | 47 (25%) | 42 (22%) | 41 (21%) | |
| High | 470 (62%) | 119 (62%) | 117 (61%) | 116 (60%) | 118 (62%) | |
| MSI status | 0.032 | |||||
| MSI-low/MSS | 627 (85%) | 169 (91%) | 156 (85%) | 154 (84%) | 148 (80%) | |
| MSI-high | 112 (15%) | 17 (9.1%) | 28 (15%) | 30 (16%) | 37 (20%) | |
| MLH1 hypermethylation | 0.19 | |||||
| Absent | 617 (87%) | 162 (91%) | 158 (88%) | 147 (84%) | 150 (85%) | |
| Present | 93 (13%) | 16 (9.0%) | 22 (12%) | 28 (16%) | 27 (15%) | |
| CIMP status | 0.020 | |||||
| Low/negative | 582 (82%) | 154 (87%) | 154 (86%) | 141 (81%) | 133 (75%) | |
| High | 128 (18%) | 24 (13%) | 26 (14%) | 34 (19%) | 44 (25%) | |
| BRAF mutation | 0.0007 | |||||
| Wild-type | 629 (84%) | 171 (91%) | 163 (87%) | 154 (82%) | 141 (76%) | |
| Mutant | 118 (16%) | 17 (9.0%) | 24 (13%) | 33 (18%) | 44 (24%) | |
| KRAS mutation | 0.019 | |||||
| Wild-type | 448 (60%) | 112 (60%) | 97 (52%) | 128 (68%) | 111 (60%) | |
| Mutant | 294 (40%) | 74 (40%) | 88 (48%) | 59 (32%) | 73 (40%) | |
| PIK3CA mutation | 0.78 | |||||
| Wild-type | 577 (83%) | 142 (85%) | 149 (83%) | 144 (81%) | 142 (85%) | |
| Mutant | 116 (17%) | 26 (15%) | 30 (17%) | 34 (19%) | 26 (15%) | |
| Mean LINE-1 methylation level (%) ± SD | 62.1 ± 9.3 | 61.0 ± 9.0 | 60.7 ± 9.8 | 62.7 ± 9.3 | 63.8 ± 8.9 | 0.004 |
Abbreviations: CIMP, CpG island methylator phenotype; LINE-1, long interspersed nucleotide element-1; MSI, microsatellite instability; MSS, microsatellite stable; SD, standard deviation.
Percentage (%) indicates the proportion of cases with a specific clinical, pathological, or tumor molecular feature in colorectal cancer cases with each quartile category of tumor MIR21 expression level. There were cases that had missing values for any of the characteristics except for age, sex, and year of diagnosis.
To assess associations between the ordinal quartile categories of tumor MIR21 expression level and categorical data, the chi-square test was performed. To compare mean age and mean LINE-1 methylation levels, an analysis of variance was performed. We adjusted two-sided α level to 0.003 (= 0.05/15) by simple Bonferroni correction for multiple hypothesis testing.
Association of tumor MIR21 expression level with colorectal cancer mortality
We examined the relationship between tumor MIR21 expression level and colorectal cancer mortality. In the 765 colorectal cancer cases, there were 429 deaths, including 231 colorectal cancer-specific deaths, during a median follow-up of 12.6 years (interquartile range: 9.8 to 17.3 years) for censored cases. In Kaplan-Meier analysis, tumor MIR21 expression level was associated with higher colorectal cancer-specific mortality (P = 0.0008 by the log-rank test for trend) and overall mortality (P = 0.001 by the log-rank test for trend; Figure 1). Tumor MIR21 expression level was associated with higher colorectal cancer-specific mortality in univariable (Ptrend = 0.0008) and multivariable Cox regression analyses (Ptrend = 0.029; Table 2).
Figure 1.
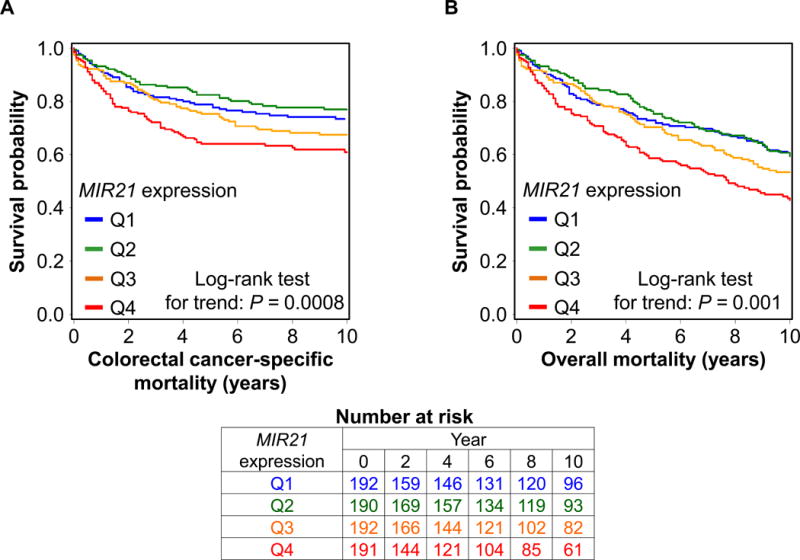
Kaplan-Meier curves for colorectal cancer-specific mortality (A) and overall mortality (B) according to tumor MIR21 expression level. P values were calculated by the log-rank test for trend (two-sided). The tables (bottom) show the number of patients who remained alive and at risk of death at each time point after the diagnosis of colorectal cancer. Q1 to Q4, quartile 1 to quartile 4.
Table 2.
Tumor MIR21 expression level and colorectal cancer mortality
| No. of cases | Colorectal cancer-specific mortality
|
Overall mortality
|
|||||
|---|---|---|---|---|---|---|---|
| No. of events | Univariable HR (95% CI) |
Multivariable HR (95% CI)a |
No. of events | Univariable HR (95% CI) |
Multivariable HR (95% CI)a |
||
| MIR21 expression level | |||||||
| Quartile 1 (lowest) | 192 | 51 | 1 (reference) | 1 (reference) | 104 | 1 (reference) | 1 (reference) |
| Quartile 2 | 190 | 44 | 0.85 (0.57–1.27) | 0.88 (0.58–1.31) | 98 | 0.99 (0.75–1.31) | 0.99 (0.75–1.31) |
| Quartile 3 | 192 | 61 | 1.24 (0.85–1.80) | 1.10 (0.75–1.60) | 106 | 1.17 (0.89–1.53) | 1.03 (0.78–1.35) |
| Quartile 4 (highest) | 191 | 75 | 1.67 (1.17–2.39) | 1.42 (0.98–2.04) | 121 | 1.52 (1.16–1.97) | 1.40 (1.07–1.84) |
| Ptrendb | 0.0008 | 0.029 | 0.001 | 0.016 | |||
Abbreviations: CI, confidence interval; HR, hazard ratio.
The multivariable Cox regression model initially included sex, age, year of diagnosis, family history of colorectal cancer in parent or sibling, tumor location, disease stage, tumor differentiation, microsatellite instability, CpG island methylator phenotype, KRAS, BRAF, and PIK3CA mutations, and long interspersed nucleotide element-1 (LINE-1) methylation level. A backward elimination with a threshold of P = 0.05 was used to select variables in the final models.
Test for a linear trend was conducted across ordinal quartile categories (1 to 4) of tumor MIR21 expression level as a continuous variable in the Cox regression model.
Interactive association of tumor MIR21 and PTGS2 expression level in survival analysis
In our primary hypothesis testing, we found a statistically significant interaction between tumor MIR21 and PTGS2 expression level in colorectal cancer-specific survival analysis (Pinteraction = 0.0004; Table 3). Tumor MIR21 expression level was significantly associated with higher colorectal cancer-specific mortality in PTGS2-high cancers (Ptrend = 0.0004) but not in PTGS2-absent/low cancers (Ptrend = 0.22). Multivariable HRs of the highest vs. lowest quartile of MIR21 expression for colorectal cancer-specific mortality were 2.28 (95% confidence interval [CI], 1.42 to 3.67) in PTGS2-high cancers and 0.61 (95% CI, 0.34 to 1.10) in PTGS2-absent/low cancers (Table 3).
Table 3.
Tumor MIR21 expression level and colorectal cancer mortality according to PTGS2 expression
| No. of cases | Colorectal cancer-specific mortality
|
Overall mortality
|
|||||
|---|---|---|---|---|---|---|---|
| No. of events | Univariable HR (95% CI) |
Multivariable HR (95% CI)a |
No. of events | Univariable HR (95% CI) |
Multivariable HR (95% CI)a |
||
| PTGS2-absent/low cancer | |||||||
| MIR21 expression level | |||||||
| Quartile 1 (lowest) | 73 | 25 | 1 (reference) | 1 (reference) | 44 | 1 (reference) | 1 (reference) |
| Quartile 2 | 73 | 14 | 0.49 (0.26–0.95) | 0.57 (0.29–1.11) | 33 | 0.63 (0.40–1.00) | 0.71 (0.45–1.12) |
| Quartile 3 | 76 | 26 | 0.99 (0.57–1.71) | 0.90 (0.52–1.57) | 43 | 1.07 (0.70–1.63) | 1.01 (0.66–1.56) |
| Quartile 4 (highest) | 73 | 22 | 0.91 (0.51–1.62) | 0.61 (0.34–1.10) | 39 | 1.04 (0.68–1.61) | 0.89 (0.57–1.38) |
| Ptrendb | 0.74 | 0.22 | 0.39 | 0.91 | |||
| PTGS2-high cancer | |||||||
| MIR21 expression level | |||||||
| Quartile 1 (lowest) | 119 | 26 | 1 (reference) | 1 (reference) | 60 | 1 (reference) | 1 (reference) |
| Quartile 2 | 117 | 30 | 1.21 (0.72–2.05) | 1.17 (0.69–1.98) | 65 | 1.29 (0.90–1.83) | 1.20 (0.84–1.72) |
| Quartile 3 | 116 | 35 | 1.46 (0.88–2.43) | 1.29 (0.77–2.15) | 63 | 1.22 (0.86–1.74) | 1.06 (0.74–1.51) |
| Quartile 4 (highest) | 118 | 53 | 2.45 (1.53–3.93) | 2.28 (1.42–3.67) | 82 | 1.86 (1.33–2.60) | 1.75 (1.25–2.45) |
| Ptrendb | < 0.0001 | 0.0004 | 0.0008 | 0.004 | |||
| Pinteractionc | 0.007 | 0.0004 | 0.06 | 0.036 | |||
Abbreviations: CI, confidence interval; HR, hazard ratio.
The multivariable Cox regression model included sex, age, year of diagnosis, family history of colorectal cancer in parent or sibling, tumor location, disease stage, tumor differentiation, microsatellite instability, CpG island methylator phenotype, KRAS, BRAF, and PIK3CA mutations, and long interspersed nucleotide element-1 (LINE-1) methylation level. A backward elimination with a threshold of P = 0.05 was used to select variables in the final models.
Test for a linear trend was conducted across ordinal quartile categories (1 to 4) of tumor MIR21 expression level as a continuous variable in the Cox regression model.
Pinteraction values (two-sided) were calculated by the Wald test on the cross-product term of tumor MIR21 expression (ordinal quartile categories [1 to 4]) and PTGS2 expression (ordinal categories; absent [1], low [2], and high [3]) variables in the Cox regression model.
Interaction of tumor MIR21 expression level and regular aspirin use after diagnosis in survival analysis of stage I to III patients
As a secondary analysis, we examined the relationship between regular aspirin use after diagnosis and colorectal cancer mortality according to tumor MIR21 expression level among 579 patients with stage I to III colorectal cancer (Supplementary Methods and Supplementary Table S1). No statistically significant interaction between tumor MIR21 expression level and postdiagnosis aspirin use was observed in colorectal cancer-specific or overall survival analysis (Pinteraction > 0.20; Supplementary Table S1); however, statistical power was limited.
Discussion
We conducted this study to test the hypothesis that the association of tumor MIR21 expression level in colorectal cancer tissue with worse clinical outcome might be stronger in cancers expressing high-level PTGS2. Utilizing the database of the 765 colorectal cancer cases in the two U.S. nationwide prospective cohort studies, we found that tumor MIR21 expression level was associated with higher colorectal cancer-specific mortality, consistent with previous studies by other investigators (15). Our population-based data have provided evidence for the prognostic significance of tumor MIR21 expression level in colorectal cancer, independent of clinical, pathological, and major tumor molecular features. In addition, there was a statistically significant interaction between tumor MIR21 and PTGS2 expression level in the survival analysis. As we hypothesized, the adverse prognostic association of tumor MIR21 expression level in colorectal cancer was stronger in PTGS2-high cancers than in PTGS2-absent/low cancers. In our secondary analysis, there was no significant difference in the prognostic association of postdiagnosis aspirin use by MIR21 expression level. However, statistical power was limited in our analysis of stage I to III patients, to minimize ascertainment bias in aspirin use data collection after cancer diagnosis.
Colorectal cancers are a heterogeneous group of diseases that result from the accumulation of differing sets of genomic and epigenomic alterations, and tumor-host interactions (29–35). Therefore, research on tumor biomarkers is important for clinical medicine and public health (36–39). In the current study, high-level tumor MIR21 expression was associated with BRAF mutation, which has been associated with clinical outcome in colorectal cancer (40–43). An integrative analysis of multiple gene expression datasets of colorectal cancer by Guinney et al. (44) has suggested four major tumor subtypes. The majority of BRAF-mutated colorectal cancers have been included in one tumor subtype that is also associated with MSI-high and high-level antitumor immunity. Our current study has shown the association of BRAF mutation in colorectal cancer with high-level tumor MIR21 expression, which may potentiate the PTGS2/PGE2 pathway and suppress antitumor immunity (20). However, lack of gene expression profiling data precluded our use of colorectal cancer subtyping scheme described by Guinney et al. (44).
Although the mechanisms underlying the association of tumor MIR21 expression with BRAF mutation in colorectal cancer remain uncertain, experimental evidence suggests that activation of the RAF-MAPK signaling pathway may increase MIR21 expression level (45), and that BRAF mutation may potentiate the signal transducer and activator of transcription 3 (STAT3) signaling pathway that has been shown to increase MIR21 expression level (11, 46). Taken together, BRAF mutation might increase MIR21 expression level through the activation of the MAPK and/or the STAT3 signaling pathways, although additional experimental studies are needed to test this hypothesis. Emerging evidence suggests that PTGS2-derived PGE2 may suppress antitumor T-cell response, and PTGS2 inhibitors may enhance the efficacy of therapeutic antibodies specific for immune checkpoint molecules in BRAF-mutated melanoma (47). Hence, it would be intriguing for future investigations to explore potential influences of tumor MIR21 and/or PTGS2 expression on the efficacy of the immune checkpoint inhibitors in colorectal cancers.
PTGS2 produces inflammatory mediator PGE2, which has been shown to promote colorectal tumor progression (3–5). Recent experimental data suggest that inflammatory responses induce MIR21, which in turn increases local level of PGE2 by suppressing degradation of PGE2 (11–14, 16, 17). These lines of experimental evidence may be consistent with the current population-based data suggesting that the adverse prognostic association of tumor MIR21 expression level in colorectal cancer is stronger in cancers expressing high-level PTGS2. Experimental evidence also suggests that PTGES (prostaglandin E synthase or microsomal prostaglandin E synthase-1 [mPGES-1]) catalyzes the conversion of prostaglandin H2 (PGH2) to PGE2, and that HPGD (hydroxyprostaglandin dehydrogenase 15-(NAD); or 15-PDGH), SLCO2A1 (solute carrier organic anion transporter family member 2A1 or prostaglandin transporter), and ABCC4 (ATP binding cassette subfamily C member 4 or multidrug resistance-associated protein 4) regulate PGE2 degradation (3). Hence, additional future studies of tumor expression of HPGD and the other molecules involved in the PGE2 biosynthetic pathways in relation to MIR21 expression in colorectal cancer are needed. MicroRNA-targeting therapies for human disease including cancer are currently being investigated (48). In light of our findings, future investigations may be warranted to explore a potential strategy of inhibiting MIR21 in treatment for colorectal cancers expressing high-level PTGS2.
We acknowledge limitations of our study. First, data on cancer recurrence were limited in the two cohorts. However, colorectal cancer-specific mortality can be considered as a reasonable cancer-specific outcome in a population-based study with long-term follow-up, because median survival for recurrent (metastatic) colorectal cancer was approximately 10 to 20 months during the time period of this study (49). Second, data on cancer treatment were also limited. However, distributions of chemotherapy use and its regimen would unlikely substantially differ according to tumor MIR21 and PTGS2 expression in resected specimens, because these data were not available for treatment decisions. We recognize that another limitation of our current study is the lack of a widely accepted, standardized classification scheme for tumor PTGS2 expression levels. We assessed tumor PTGS2 expression by immunohistochemistry through the central, blinded review of tumor specimens with rigorous comparison with internal controls. The interobserver agreement for tumor PTGS2 expression levels (0.85; κ = 0.69) was reasonably good. Any random misclassification of tumor PTGS2 expression status would have driven our results towards the null hypothesis. Despite this limitation, we were able to demonstrate the significant interaction between MIR21 and PTGS2 expression in colorectal cancer mortality analysis.
The strengths of our study include the use of our molecular pathological epidemiology (50–52) database of rectal and colon carcinoma cases in the two U.S. nationwide, prospective cohort studies, which integrates clinicopathologic features, long-term survival data, and tumor molecular features including microRNA MIR21 expression in colorectal cancer tissue. This population-based colorectal cancer database enabled us to rigorously examine the interactive prognostic association of tumor MIR21 and PTGS2, controlling for potential confounders. In addition, our colorectal cancer specimens were derived from a large number of hospitals in diverse settings across the U.S., which increase generalizability of our findings.
In conclusion, tumor MIR21 expression level is associated with higher colorectal cancer mortality independent of clinical, pathological, and tumor molecular features, and this association is stronger in cancers expressing high-level PTGS2. Additional prospective studies are needed to validate these findings from the current exploratory, hypothesis-generating study. Upon validation, our population-based data may inform future research to develop strategies for colorectal cancer prevention and treatment through targeting MIR21 and the PTGS2/PGE2 pathway.
Supplementary Material
Translational Relevance.
Accumulating evidence indicates that microRNAs are promising biomarkers and therapeutic targets in cancer. We examined an association of tumor MIR21 expression level with patient survival utilizing 765 colorectal cancer cases in two U.S. nationwide prospective cohort studies (the Nurses’ Health Study and the Health Professionals Follow-up Study). We found that tumor MIR21 expression level was associated with higher colorectal cancer-specific mortality independent of clinical, pathological, and major tumor molecular features, including microsatellite instability, CpG island methylator phenotype, KRAS, BRAF, and PIK3CA mutations, and LINE-1 methylation level. In addition, this adverse prognostic association was stronger in colorectal cancers expressing high-level prostaglandin-endoperoxide synthase 2 (PTGS2, cyclooxygenase-2) that produces inflammatory mediator prostaglandin E2. Our population-based data suggest that MIR21 may serve as a potential therapeutic target, especially for colorectal cancers that express PTGS2 and may depend on inflammatory tumor microenvironment.
Acknowledgments
We would like to thank the participants and staff of the Nurses’ Health Study and the Health Professionals Follow-up Study for their valuable contributions as well as the following state cancer registries for their help: AL, AZ, AR, CA, CO, CT, DE, FL, GA, ID, IL, IN, IA, KY, LA, ME, MD, MA, MI, NE, NH, NJ, NY, NC, ND, OH, OK, OR, PA, RI, SC, TN, TX, VA, WA, WY. The authors assume full responsibility for analyses and interpretation of these data.
Funding: This work was supported by U.S. National Institutes of Health (NIH) grants [P01 CA87969 to M.J. Stampfer; UM1 CA186107 to M.J. Stampfer; P01 CA55075 to W.C. Willett; UM1 CA167552 to W.C. Willett; P50 CA127003 to C.S.F.; R01 CA137178 to A.T.C.; R01 CA151993 to S.O.; R35 CA197735 to S.O.; and K07 CA190673 to R.N.]; and by grants from the Project P Fund, The Friends of the Dana-Farber Cancer Institute, Bennett Family Fund, and the Entertainment Industry Foundation through National Colorectal Cancer Research Alliance. K.M. is supported by a grant from Program for Advancing Strategic International Networks to Accelerate the Circulation of Talented Researchers from Japan Society for the Promotion of Science. The content is solely the responsibility of the authors and does not necessarily represent the official views of NIH. The funders had no role in study design, data collection and analysis, decision to publish, or preparation of the manuscript.
Abbreviations
- CI
confidence interval
- CIMP
CpG island methylator phenotype
- Ct
cycle threshold
- FFPE
formalin-fixed paraffin-embedded
- HPFS
Health Professionals Follow-up Study
- HR
hazard ratios
- LINE-1
long interspersed nucleotide element-1
- MSI
microsatellite instability
- MSS
microsatellite stable
- NHS
Nurses’ Health Study
- PCR
polymerase chain reaction
- PGE2
prostaglandin E2
- SD
standard deviation
Footnotes
Disclosure of potential conflicts of interest: Dr. Chan previously served as a consultant for Bayer Healthcare, Millennium Pharmaceuticals, Pozen Inc, and Pfizer Inc. This study was not funded by Bayer Healthcare, Millennium Pharmaceuticals, Pozen Inc, or Pfizer Inc. No other conflict of interest exists. The other authors declare that they have no conflicts of interest.
Use of standardized official symbols: We use HUGO (Human Genome Organisation)-approved official symbols for genes and gene products, including ABCC4, BRAF, CACNA1G, CDKN2A, CRABP1, HPGD, IGF2, KRAS, MIR21, MLH1, NEUROG1, PIK3CA, PTGES, PTGS2, RNU6-2, RUNX3, SLCO2A1, SOCS1, and STAT3; all of which are described at www.genenames.org. Gene names are italicized, and gene product names are non-italicized.
References
- 1.Vogelstein B, Papadopoulos N, Velculescu VE, Zhou S, Diaz LA, Jr, Kinzler KW. Cancer genome landscapes. Science. 2013;339:1546–58. doi: 10.1126/science.1235122. [DOI] [PMC free article] [PubMed] [Google Scholar]
- 2.Di Leva G, Garofalo M, Croce CM. MicroRNAs in cancer. Annu Rev Pathol. 2014;9:287–314. doi: 10.1146/annurev-pathol-012513-104715. [DOI] [PMC free article] [PubMed] [Google Scholar]
- 3.Wang D, Dubois RN. Eicosanoids and cancer. Nat Rev Cancer. 2010;10:181–93. doi: 10.1038/nrc2809. [DOI] [PMC free article] [PubMed] [Google Scholar]
- 4.Wang D, Fu L, Sun H, Guo L, DuBois RN. Prostaglandin E2 Promotes Colorectal Cancer Stem Cell Expansion and Metastasis in Mice. Gastroenterology. 2015;149:1884–95 e4. doi: 10.1053/j.gastro.2015.07.064. [DOI] [PMC free article] [PubMed] [Google Scholar]
- 5.Ogino S, Kirkner GJ, Nosho K, Irahara N, Kure S, Shima K, et al. Cyclooxygenase-2 expression is an independent predictor of poor prognosis in colon cancer. Clin Cancer Res. 2008;14:8221–7. doi: 10.1158/1078-0432.CCR-08-1841. [DOI] [PMC free article] [PubMed] [Google Scholar]
- 6.Tougeron D, Sha D, Manthravadi S, Sinicrope FA. Aspirin and colorectal cancer: back to the future. Clin Cancer Res. 2014;20:1087–94. doi: 10.1158/1078-0432.CCR-13-2563. [DOI] [PMC free article] [PubMed] [Google Scholar]
- 7.Sandler RS, Halabi S, Baron JA, Budinger S, Paskett E, Keresztes R, et al. A randomized trial of aspirin to prevent colorectal adenomas in patients with previous colorectal cancer. N Engl J Med. 2003;348:883–90. doi: 10.1056/NEJMoa021633. [DOI] [PubMed] [Google Scholar]
- 8.Chan AT, Ogino S, Fuchs CS. Aspirin and the risk of colorectal cancer in relation to the expression of COX-2. N Engl J Med. 2007;356:2131–42. doi: 10.1056/NEJMoa067208. [DOI] [PubMed] [Google Scholar]
- 9.Chan AT, Ogino S, Fuchs CS. Aspirin use and survival after diagnosis of colorectal cancer. JAMA. 2009;302:649–58. doi: 10.1001/jama.2009.1112. [DOI] [PMC free article] [PubMed] [Google Scholar]
- 10.Ha M, Kim VN. Regulation of microRNA biogenesis. Nat Rev Mol Cell Biol. 2014;15:509–24. doi: 10.1038/nrm3838. [DOI] [PubMed] [Google Scholar]
- 11.Yu H, Lee H, Herrmann A, Buettner R, Jove R. Revisiting STAT3 signalling in cancer: new and unexpected biological functions. Nat Rev Cancer. 2014;14:736–46. doi: 10.1038/nrc3818. [DOI] [PubMed] [Google Scholar]
- 12.Tili E, Michaille JJ, Croce CM. MicroRNAs play a central role in molecular dysfunctions linking inflammation with cancer. Immunol Rev. 2013;253:167–84. doi: 10.1111/imr.12050. [DOI] [PubMed] [Google Scholar]
- 13.Shi C, Yang Y, Xia Y, Okugawa Y, Yang J, Liang Y, et al. Novel evidence for an oncogenic role of microRNA-21 in colitis-associated colorectal cancer. Gut. 2016 doi: 10.1136/gutjnl-2014-308455. in press (published online in 2015) [DOI] [PubMed] [Google Scholar]
- 14.Iliopoulos D, Jaeger SA, Hirsch HA, Bulyk ML, Struhl K. STAT3 activation of miR-21 and miR-181b-1 via PTEN and CYLD are part of the epigenetic switch linking inflammation to cancer. Mol Cell. 2010;39:493–506. doi: 10.1016/j.molcel.2010.07.023. [DOI] [PMC free article] [PubMed] [Google Scholar]
- 15.Schetter AJ, Leung SY, Sohn JJ, Zanetti KA, Bowman ED, Yanaihara N, et al. MicroRNA expression profiles associated with prognosis and therapeutic outcome in colon adenocarcinoma. JAMA. 2008;299:425–36. doi: 10.1001/jama.299.4.425. [DOI] [PMC free article] [PubMed] [Google Scholar]
- 16.Schetter AJ, Nguyen GH, Bowman ED, Mathe EA, Yuen ST, Hawkes JE, et al. Association of inflammation-related and microRNA gene expression with cancer-specific mortality of colon adenocarcinoma. Clin Cancer Res. 2009;15:5878–87. doi: 10.1158/1078-0432.CCR-09-0627. [DOI] [PMC free article] [PubMed] [Google Scholar]
- 17.Lu L, Byrnes K, Han C, Wang Y, Wu T. miR-21 targets 15-PGDH and promotes cholangiocarcinoma growth. Mol Cancer Res. 2014;12:890–900. doi: 10.1158/1541-7786.MCR-13-0419. [DOI] [PMC free article] [PubMed] [Google Scholar]
- 18.Nishihara R, Lochhead P, Kuchiba A, Jung S, Yamauchi M, Liao X, et al. Aspirin use and risk of colorectal cancer according to BRAF mutation status. JAMA. 2013;309:2563–71. doi: 10.1001/jama.2013.6599. [DOI] [PMC free article] [PubMed] [Google Scholar]
- 19.Liao X, Lochhead P, Nishihara R, Morikawa T, Kuchiba A, Yamauchi M, et al. Aspirin use, tumor PIK3CA mutation, and colorectal-cancer survival. N Engl J Med. 2012;367:1596–606. doi: 10.1056/NEJMoa1207756. [DOI] [PMC free article] [PubMed] [Google Scholar]
- 20.Mima K, Nishihara R, Nowak JA, Kim SA, Song M, Inamura K, et al. MicroRNA MIR21 and T cells in Colorectal Cancer. Cancer Immunol Res. 2016;4:33–40. doi: 10.1158/2326-6066.CIR-15-0084. [DOI] [PMC free article] [PubMed] [Google Scholar]
- 21.Ogino S, Nosho K, Kirkner GJ, Kawasaki T, Meyerhardt JA, Loda M, et al. CpG island methylator phenotype, microsatellite instability, BRAF mutation and clinical outcome in colon cancer. Gut. 2009;58:90–6. doi: 10.1136/gut.2008.155473. [DOI] [PMC free article] [PubMed] [Google Scholar]
- 22.Ogino S, Kawasaki T, Nosho K, Ohnishi M, Suemoto Y, Kirkner GJ, et al. LINE-1 hypomethylation is inversely associated with microsatellite instability and CpG island methylator phenotype in colorectal cancer. Int J Cancer. 2008;122:2767–73. doi: 10.1002/ijc.23470. [DOI] [PMC free article] [PubMed] [Google Scholar]
- 23.Irahara N, Nosho K, Baba Y, Shima K, Lindeman NI, Hazra A, et al. Precision of pyrosequencing assay to measure LINE-1 methylation in colon cancer, normal colonic mucosa, and peripheral blood cells. J Mol Diagn. 2010;12:177–83. doi: 10.2353/jmoldx.2010.090106. [DOI] [PMC free article] [PubMed] [Google Scholar]
- 24.Ogino S, Kawasaki T, Brahmandam M, Cantor M, Kirkner GJ, Spiegelman D, et al. Precision and performance characteristics of bisulfite conversion and real-time PCR (MethyLight) for quantitative DNA methylation analysis. J Mol Diagn. 2006;8:209–17. doi: 10.2353/jmoldx.2006.050135. [DOI] [PMC free article] [PubMed] [Google Scholar]
- 25.Ogino S, Kawasaki T, Kirkner GJ, Kraft P, Loda M, Fuchs CS. Evaluation of markers for CpG island methylator phenotype (CIMP) in colorectal cancer by a large population-based sample. J Mol Diagn. 2007;9:305–14. doi: 10.2353/jmoldx.2007.060170. [DOI] [PMC free article] [PubMed] [Google Scholar]
- 26.Ogino S, Kawasaki T, Brahmandam M, Yan L, Cantor M, Namgyal C, et al. Sensitive sequencing method for KRAS mutation detection by Pyrosequencing. J Mol Diagn. 2005;7:413–21. doi: 10.1016/S1525-1578(10)60571-5. [DOI] [PMC free article] [PubMed] [Google Scholar]
- 27.Imamura Y, Lochhead P, Yamauchi M, Kuchiba A, Qian ZR, Liao X, et al. Analyses of clinicopathological, molecular, and prognostic associations of KRAS codon 61 and codon 146 mutations in colorectal cancer: cohort study and literature review. Mol Cancer. 2014;13:135. doi: 10.1186/1476-4598-13-135. [DOI] [PMC free article] [PubMed] [Google Scholar]
- 28.Liao X, Morikawa T, Lochhead P, Imamura Y, Kuchiba A, Yamauchi M, et al. Prognostic role of PIK3CA mutation in colorectal cancer: cohort study and literature review. Clin Cancer Res. 2012;18:2257–68. doi: 10.1158/1078-0432.CCR-11-2410. [DOI] [PMC free article] [PubMed] [Google Scholar]
- 29.Weisenberger DJ, Levine AJ, Long TI, Buchanan DD, Walters R, Clendenning M, et al. Association of the colorectal CpG island methylator phenotype with molecular features, risk factors, and family history. Cancer Epidemiol Biomarkers Prev. 2015;24:512–9. doi: 10.1158/1055-9965.EPI-14-1161. [DOI] [PMC free article] [PubMed] [Google Scholar]
- 30.Campbell PT, Newton CC, Newcomb PA, Phipps AI, Ahnen DJ, Baron JA, et al. Association between Body Mass Index and Mortality for Colorectal Cancer Survivors: Overall and by Tumor Molecular Phenotype. Cancer Epidemiol Biomarkers Prev. 2015;24:1229–38. doi: 10.1158/1055-9965.EPI-15-0094. [DOI] [PMC free article] [PubMed] [Google Scholar]
- 31.Tillmans LS, Vierkant RA, Wang AH, Jewel Samadder N, Lynch CF, Anderson KE, et al. Associations between cigarette smoking, hormone therapy, and folate intake with incident colorectal cancer by TP53 protein expression level in a population-based cohort of older women. Cancer Epidemiol Biomarkers Prev. 2014;23:350–5. doi: 10.1158/1055-9965.EPI-13-0780. [DOI] [PMC free article] [PubMed] [Google Scholar]
- 32.Phipps AI, Ahnen DJ, Cheng I, Newcomb PA, Win AK, Burnett T. PIK3CA Somatic Mutation Status in Relation to Patient and Tumor Factors in Racial/Ethnic Minorities with Colorectal Cancer. Cancer Epidemiol Biomarkers Prev. 2015;24:1046–51. doi: 10.1158/1055-9965.EPI-15-0204. [DOI] [PMC free article] [PubMed] [Google Scholar]
- 33.Shiovitz S, Bertagnolli MM, Renfro LA, Nam E, Foster NR, Dzieciatkowski S, et al. CpG island methylator phenotype is associated with response to adjuvant irinotecan-based therapy for stage III colon cancer. Gastroenterology. 2014;147:637–45. doi: 10.1053/j.gastro.2014.05.009. [DOI] [PMC free article] [PubMed] [Google Scholar]
- 34.Park JH, McMillan DC, Powell AG, Richards CH, Horgan PG, Edwards J, et al. Evaluation of a tumor microenvironment-based prognostic score in primary operable colorectal cancer. Clin Cancer Res. 2015;21:882–8. doi: 10.1158/1078-0432.CCR-14-1686. [DOI] [PubMed] [Google Scholar]
- 35.Panarelli NC, Vaughn CP, Samowitz WS, Yantiss RK. Sporadic microsatellite instability-high colon cancers rarely display immunohistochemical evidence of Wnt signaling activation. Am J Surg Pathol. 2015;39:313–7. doi: 10.1097/PAS.0000000000000380. [DOI] [PubMed] [Google Scholar]
- 36.Phipps AI, Limburg PJ, Baron JA, Burnett-Hartman AN, Weisenberger DJ, Laird PW, et al. Association between molecular subtypes of colorectal cancer and patient survival. Gastroenterology. 2015;148:77–87 e2. doi: 10.1053/j.gastro.2014.09.038. [DOI] [PMC free article] [PubMed] [Google Scholar]
- 37.Slattery ML, Herrick JS, Mullany LE, Valeri N, Stevens J, Caan BJ, et al. An evaluation and replication of miRNAs with disease stage and colorectal cancer-specific mortality. Int J Cancer. 2015;137:428–38. doi: 10.1002/ijc.29384. [DOI] [PMC free article] [PubMed] [Google Scholar]
- 38.Sinicrope FA, Mahoney MR, Yoon HH, Smyrk TC, Thibodeau SN, Goldberg RM, et al. Analysis of Molecular Markers by Anatomic Tumor Site in Stage III Colon Carcinomas from Adjuvant Chemotherapy Trial NCCTG N0147 (Alliance) Clin Cancer Res. 2015;21:5294–304. doi: 10.1158/1078-0432.CCR-15-0527. [DOI] [PMC free article] [PubMed] [Google Scholar]
- 39.Cushman SM, Jiang C, Hatch AJ, Shterev I, Sibley AB, Niedzwiecki D, et al. Gene expression markers of efficacy and resistance to cetuximab treatment in metastatic colorectal cancer: results from CALGB 80203 (Alliance) Clin Cancer Res. 2015;21:1078–86. doi: 10.1158/1078-0432.CCR-14-2313. [DOI] [PMC free article] [PubMed] [Google Scholar]
- 40.Samowitz WS, Sweeney C, Herrick J, Albertsen H, Levin TR, Murtaugh MA, et al. Poor survival associated with the BRAF V600E mutation in microsatellite-stable colon cancers. Cancer Res. 2005;65:6063–9. doi: 10.1158/0008-5472.CAN-05-0404. [DOI] [PubMed] [Google Scholar]
- 41.Ogino S, Shima K, Meyerhardt JA, McCleary NJ, Ng K, Hollis D, et al. Predictive and prognostic roles of BRAF mutation in stage III colon cancer: results from intergroup trial CALGB 89803. Clin Cancer Res. 2012;18:890–900. doi: 10.1158/1078-0432.CCR-11-2246. [DOI] [PMC free article] [PubMed] [Google Scholar]
- 42.Lochhead P, Kuchiba A, Imamura Y, Liao X, Yamauchi M, Nishihara R, et al. Microsatellite instability and BRAF mutation testing in colorectal cancer prognostication. J Natl Cancer Inst. 2013;105:1151–6. doi: 10.1093/jnci/djt173. [DOI] [PMC free article] [PubMed] [Google Scholar]
- 43.Seppala TT, Bohm JP, Friman M, Lahtinen L, Vayrynen VM, Liipo TK, et al. Combination of microsatellite instability and BRAF mutation status for subtyping colorectal cancer. Br J Cancer. 2015;112:1966–75. doi: 10.1038/bjc.2015.160. [DOI] [PMC free article] [PubMed] [Google Scholar]
- 44.Guinney J, Dienstmann R, Wang X, de Reynies A, Schlicker A, Soneson C, et al. The consensus molecular subtypes of colorectal cancer. Nat Med. 2015;21:1350–6. doi: 10.1038/nm.3967. [DOI] [PMC free article] [PubMed] [Google Scholar]
- 45.Huang TH, Wu F, Loeb GB, Hsu R, Heidersbach A, Brincat A, et al. Up-regulation of miR-21 by HER2/neu signaling promotes cell invasion. J Biol Chem. 2009;284:18515–24. doi: 10.1074/jbc.M109.006676. [DOI] [PMC free article] [PubMed] [Google Scholar]
- 46.Becker TM, Boyd SC, Mijatov B, Gowrishankar K, Snoyman S, Pupo GM, et al. Mutant B-RAF-Mcl-1 survival signaling depends on the STAT3 transcription factor. Oncogene. 2014;33:1158–66. doi: 10.1038/onc.2013.45. [DOI] [PubMed] [Google Scholar]
- 47.Zelenay S, van der Veen AG, Bottcher JP, Snelgrove KJ, Rogers N, Acton SE, et al. Cyclooxygenase-Dependent Tumor Growth through Evasion of Immunity. Cell. 2015;162:1257–70. doi: 10.1016/j.cell.2015.08.015. [DOI] [PMC free article] [PubMed] [Google Scholar]
- 48.Li Z, Rana TM. Therapeutic targeting of microRNAs: current status and future challenges. Nat Rev Drug Discov. 2014;13:622–38. doi: 10.1038/nrd4359. [DOI] [PubMed] [Google Scholar]
- 49.Meyerhardt JA, Mayer RJ. Systemic therapy for colorectal cancer. N Engl J Med. 2005;352:476–87. doi: 10.1056/NEJMra040958. [DOI] [PubMed] [Google Scholar]
- 50.Ogino S, Chan AT, Fuchs CS, Giovannucci E. Molecular pathological epidemiology of colorectal neoplasia: an emerging transdisciplinary and interdisciplinary field. Gut. 2011;60:397–411. doi: 10.1136/gut.2010.217182. [DOI] [PMC free article] [PubMed] [Google Scholar]
- 51.Ogino S, Lochhead P, Chan AT, Nishihara R, Cho E, Wolpin BM, et al. Molecular pathological epidemiology of epigenetics: emerging integrative science to analyze environment, host, and disease. Mod Pathol. 2013;26:465–84. doi: 10.1038/modpathol.2012.214. [DOI] [PMC free article] [PubMed] [Google Scholar]
- 52.Ogino S, Campbell PT, Nishihara R, Phipps AI, Beck AH, Sherman ME, et al. Proceedings of the second international molecular pathological epidemiology (MPE) meeting. Cancer Causes Control. 2015;26:959–72. doi: 10.1007/s10552-015-0596-2. [DOI] [PMC free article] [PubMed] [Google Scholar]
Associated Data
This section collects any data citations, data availability statements, or supplementary materials included in this article.