

Abstract
Notch signaling plays a critical role in maintaining bone homeostasis partially by controlling the formation of osteoblasts from mesenchymal stem cells (MSCs). We reported that TNF activates Notch signaling in MSCs which inhibits osteoblast differentiation in TNF transgenic (TNF-Tg) mice, a mouse model of chronic inflammatory arthritis. In the current study, we used Hes1-GFP and Hes1-GFP/TNF-Tg mice to study the distribution and dynamic change of Notch active cells in normal and inflammatory bone loss and mechanisms mediating their enhanced proliferation. We found that Hes1-GFP+ cells are composed of cells expressing mesenchymal, hematopoietic and endothelial surface markers. CD45−/Hes1-GFP+ cells express high levels of mesenchymal markers and form CFU-F and CFU-ALP colonies. Expansion of CFU-F colonies is associated with a rapid increase in Hes1-GFP+ cell numbers and their GFP intensity. The GFP signal is lost when a CFU-F colony differentiates into an ALP+ osteoblast colony. TNF increases the numbers of CD45−/Hes1-GFP+ cells, which are stained negatively for osteoblast marker osteocalcin and localized adjacent to endosteal and trabecular bone surfaces. CD45−/Hes1-GFP+ cells in Hes1-GFP/TNF-Tg mice have increased BrdU incorporation and PDGFRβ levels. TNF increases the number of proliferating Hes1-GFP+ cells, which is prevented by a specific PDGFRβ inhibitor. Notch inhibition blocks TNF-mediated PDGFRβ expression and cell proliferation. Thus, TNF-induced MSC proliferation is mediated by PDGFRβ signal, which works at downstream of Notch. Hes1-GFP mice can be used to assess the activation status of Notch in bone cells.
Keywords: Notch, mesenchymal stem cells, inflammation, osteoporosis, proliferation, TNF, PDGFRβ
INTRODUCTION
The Notch pathway is an evolutionarily conserved signaling system, which plays an essential role in regulating cell proliferation, differentiation, cell fate determination and stem/progenitor cell self-renewal in both embryonic and adult organs by cell-autonomous and non-cell-autonomous ways [1]. Notch receptors are activated by direct contact with their ligands that are expressed on adjacent cells. Notch receptors have extracellular, transmembrane, and intracellular domains. Upon ligand binding, Notch receptors are sequentially cleaved by two proteases in the extracellular domain and transmembrane domain. The latter processing is accomplished by the γ-secretase enzyme. As a result, the Notch intracellular domain (NICD) is released from the membrane and translocates to the nucleus to associate with the recombination signal–binding protein jκ (RBPjκ) which leads to transcriptional activation of target genes, such as Hes1 and Hey1.
The role of Notch signaling in bone was first reported when genetic modification of Notch signaling in mice revealed critical roles for Notch in osteoblast (OB) differentiation from mesenchymal stem cells (MSCs). Loss of Notch signaling in MSCs or OB precursors resulted in increased bone mass [2, 3], whereas activation of Notch signaling decreased OB numbers [4], indicating that Notch maintains proliferation and self-renewal of MSCs and inhibits OB differentiation. Subsequent studies revealed that Notch signaling suppresses chondrogenesis and chondrocyte proliferation and promotes chondrocyte hypertrophy and terminal differentiation [5, 6]. In the hematopoietic system, activation of Notch by exposure to Notch ligands [7] or over-expression of Notch target genes [8, 9], increased hematopoietic progenitor self-renewal and decreased their differentiation. Loss of Notch signaling via a Notch inhibitor or a dominant-negative form of Xenopus CSL/RBPJ homolog increased differentiation and decreased progenitor self-renewal [10]. Compared to MSCs-OBs, the reports regarding to the effect of Notch signaling on osteoclast (OC) function are controversial. For instance, depletion of Notch [4] or treatment of OBs with the γ-secretase inhibitor DAPT to inhibit Notch signaling [2] decreased osteoprotegerin production and led to increased OC formation. RBPjκ depletion specifically in myeloid cells increased OC formation in response to inflammatory cytokines [11], indicating that Notch inhibits OC differentiation by indirect and direct mechanisms. However, over-expression of Notch2 in OC precursors enhanced RANKL-induced osteoclastogenesis possibly by regulating nuclear factor of activated T cells c1 expression [12]. Jagged 1-expressing tumor cells promoted OC differentiation by regulating the expression of RANKL and osteoprotegerin [13]. Although the precise role of Notch signal in OC biology needs further investigation, these studies indicate that Notch regulates the functions of all cells involved in bone formation and turnover.
Recently, we reported that Notch signaling plays a critical role in mediating chronic inflammation-induced bone loss through inhibition of OB functions. Using TNF transgenic (TNF-Tg) mice, a mouse model of chronic inflammatory arthritis [14], we found that TNF activates Notch signaling in MSCs by promoting binding of the non-canonical NF-κB p52 and RelB proteins to the NICD and its nuclear translocation, leading to increased expression of Notch target genes, such as Hes1, and decreased OB differentiation and bone formation [15]. Notch signaling is also involved in other bone diseases. Transient and systemic Notch/γ-secretase inhibition accelerated fracture repair by promoting MSC differentiation [16], while Notch activation in intervertebral discs inhibited nucleus pulposus cell differentiation and promoted degenerative disc disease [17]. In these studies, Notch activation was assessed by biochemical, molecular, and/or genetic approaches. The distribution and dynamic change of Notch active cells in bone and bone marrow (BM) under normal and disease conditions have not been studied. Recently, Hes1-GFP reporter mice were generated to assess Notch activity and allow visualization of Hes1-expressing neural stem cells in the central neural system [18]. This mouse line has not been used in bone studies. It is not known if Hes1-GFP+ cells can be detected in BM or if their frequency and distribution change during OB or OC differentiation under normal or pathological condition, such as inflammatory bone loss.
In this study, we used Hes1-GFP/TNF-Tg and Hes1-GFP mice to study the distribution and changes of cells with active Hes1 promoter in inflammatory bone loss. We found increased numbers and intensity of Hes1-GFP+ cells that Our findings indicate that Hes1-GFP mice may represent a useful model to assess the activation status of Notch signaling in vivo, ex vivo, and in vitro in bone cells. Furthermore, elevated proliferation in Notch active MSCs under condition of TNF over-expression is likely mediated by PDGFRβ signal.
MATERIALS AND METHODS
Animals
Hes1-GFP transgenic (Hes1-GFP) mice generated in Dr. Ryoichiro Kageyama’s lab (Kyoto University) on a C57BL/6J background, in which the 2.5-kb Hes1 promoter was inserted upstream of sequences encoding destabilized eGFP [18]. TNF-Tg mice (the line 3647) were originally obtained from Dr. G. Kollias [19], which carry a human TNF transgene in which the 3′-untranslated region of the hTNF gene is replaced with that of the human β-globin gene. TNF-Tg mice develop arthritis starting at 2 months of age, and arthritis and bone loss progress with age. TNF-Tg mice have been crossed with C57BL/6 mice for more than 10 generation. To generate Hes1-GFP/TNF-Tg double transgenic mice, heterozyzous Hes1-GFP male mice were bred with heterozygous TNF-Tg female mice. Six-month-old Hes1-GFP/TNF-Tg male mice were used for in the vivo study and Hes1-GFP littermates were used as a control. All animal procedures were approved by the University Committee on Animal Resources in the University of Rochester.
Flow cytometry and cell sorting
Bone marrow (BM) cells were flushed out from tibiae and femurs with PBS. Red blood cells were lysed using lysis buffer (ThermoFisher Scientific A1049201). After washing with PBS, cells were suspended in PBS with 2% FBS. Cells were stained with various fluorescein-labeled antibodies (Abs) and subjected to flow cytometric analysis using Becton-Dickinson FACSCanto II Cytometer [20]. APC-anti-CD45, PE-anti-CD105, PE-cy7-anti-Sca-1, PE-anti-CD11b, PE-cy5-anti-Gr1, PE-anti-CD3, PE-anti-B220 Abs and anti-αSMA were purchased from eBioscience. PE-anti-Goat, APC-anti-Rabbit, PE-anti-mouse anti-PDGFRβ Abs were purchased from Santa Cruz Biotechnology. Anti-LeptinR Ab was purchased from Abcam. Results were analyzed by Flowjo7 data analysis software (Ashland, OR). For cell sorting, cells were stained with APC-anti-CD45 Ab and CD45−GFP+ cells were sorted by Becton-Dickinson FACSAria III sorter [20].
Cell culture and analysis
Cell culture and flow analyses were done using cells from 3 months old female mice. We did not find obvious difference when cells from male and female mice were used. For CFU colony formation and CFU-Alkaline phosphatase (ALP) assays, sorted BM CD45−/Hes1-GFP+, CD45+/Hes1-GFP+ and CD45−/Hes1-GFP− cells were cultured in α-MEM growth medium containing 10% FCS or in OB inducing medium (50μg/mL ascorbic acid and 10mM β-glycerophosphate) for 28 days. Cells were stained with H&E or for ALP. To observe changes of Hes1-GFP+ cells during CFU formation, Hes1-GFP mouse BM cells were cultured in growth medium for 20 days and then switched to OB inducing medium for an additional 10 days. On day 5, colonies were observed using a fluorescence microscope (Olympus, Japan) and cell clusters of more than 30 cells were defined as a CFU-F. Fifty colonies/dish were randomly selected and labeled for analyses. The number and percentage of colonies containing Hes1-GFP+ cells and Hes1-GFP+ cells/colony were counted every 5 days. To assess the effect of Notch signaling inhibition, DAPT was added into the growth or OB inducing medium for an additional 5 days. Hes1-GFP+ colonies were observed before and after DAPT treatment. GFP fluorescence intensity was quantified by measuring the area and intensity of the entire image using Image Pro Plus 6.0 software. Results were expressed as integrated optical density (IOD): IOD=area × intensity of fluorescence. For osteoclast (OC) formation assays, sorted BM cells (10,000/well) were cultured with conditioned medium (1:50 dilution) from a M-CSF-producing cell line for 3 days in α-MEM with 10% FCS to generate OC precursors. OC precursors were cultured with M-CSF conditioned medium and RANKL (10 ng/ml, R&D) for 2–3 days. After multinucleated cells were observed under a microscope, the cells were fixed, stained for TRAP activity to identify OCs, and the number of OCs (TRAP+ cells containing >3 nuclei) was counted, as described previously [15].
Cell proliferation and apoptosis assays
For cell proliferation assays, mice were given two injections of BrdU (1 mg/mouse/injection, ip) spaced 16 hours apart and were euthanized 2 hours after the second injection. BM cells were stained with PE-anti-CD45 and APC-conjugated anti-BrdU Abs for flow cytometry using a BrdU Flow Kit (BD Phamingen). The percentage of BrdU+ cells in the CD45−GFP+ cells was assessed. For cell apoptosis assays, BM cells were stained with PE-anti-CD45 Ab and APC-anti-AnnexinV Abs using an Apoptosis Detection Kit (eBioscience). After being stained with Propidium iodide (PI), the percentage of PI−/AnnexinV+ apoptotic cells was assessed by flow cytometry. For BrdU incorporation assays, CFU-F cells derived from Hes1-GFP mouse BM cells were incubated with 10 μM BrdU for 12 hrs. Cells were fixed with 10% buffered formalin and were stained with anti-BrdU monoclonal Ab (AbD Serotec, 1:100) followed by goat anti-rabbit Alexa Fluor 568 (Invitrogen, 1:400). The percentage of GFP+/BrdU+ cells was determined on the randomly taken pictures (3–4 points/well; three wells/group).
Histology and histomorphometric analysis
Femora were fixed in 10% buffered formalin, decalcified in 10% EDTA, and embedded in Tissue-Tek. Bones were sectioned using a Leica CM1850 cryostat (Leica, German). Sections for visualizing GFP signals were unstained or stained with H&E or immunofluorescence (IF). For IF staining, sections were blocked in PBS with 10% normal goat serum and 0.2% Triton X-100 and stained overnight with rabbit anti- osteocalcin (Enzo, 1:200) or rat anti-CD31 Ab (BD Pharmingen, 1:200) followed by goat anti-rabbit Alexa Fluor 568 or goat anti-rat Alexa Fluor 568 (Invitrogen, 1:400). Slides were mounted with mounting medium containing DAPI (Vector) and images were scanned with an Olympus VS-120 whole-slide imaging system, as we reported previously [21]. The numbers of total GFP+, osteocalcin+/GFP+, and CD31+/GFP+ cells were counted on scanned images, and expressed as cell numbers per section. The average of GFP fluorescence intensity was quantified by measuring the total GFP intensity that was divided by GFP+ cell numbers in scanned images using Image Pro Plus 6.0 software.
Quantitative real time RT-PCR
Total RNA was extracted using TRIzol reagent (Invitrogen). cDNAs were synthesized by iSCRIPT cDNA Synthesis Kit (Bio-Rad). Quantitative real time RT-PCR amplifications were performed in an iCycler (Bio-Rad) real time PCR machine using iQ SYBR Green supermix (Bio-Rad), according to the manufacturer’s instructions. Gapdh was amplified on the same plates and used to normalize the data. Each sample was prepared in triplicate. The relative abundance of each gene was calculated by subtracting the CT value of each sample for an individual gene from the corresponding CT value of Gapdh (ΔCT). ΔΔCT were obtained by subtracting the ΔCT of the reference point. These values were then raised to the power 2 (2ΔΔCT) to yield fold-expression relative to the reference point. The sequences of primer sets for p52, RelB, Hes1 and Gapdh mRNAs are shown in Table.
Western blot
Whole-cell lysates (10 μg) from C3H10T1/2 cells treated with TNF and/or Thapsigargin were loaded in 10% SDS-PAGE gels and blotted with anti-Cyclin D1 (Cell Signaling Technology), Hes1, PDGFRβ or Actin Abs (Santa Cruz Biotechnology Inc.). Bands were visualized using enhanced chemiluminescence (ECL) (GE Healthcare Amersham Biosciences, Piscataway, NJ, USA).
Statistical analysis
Results are given as mean ± SD. All in vitro experiments were repeated at least 2 times. Statistical analysis was performed using GraphPad Prism 5 software (GraphPad Software Inc., San Diego, CA, USA). Comparisons between 2 groups were analyzed using the 2-tailed unpaired Student’s t test. One way ANOVA and Dunnett’s post-hoc multiple comparisons were used for comparisons among 3 or more groups. P values less than 0.05 were considered statistically significant.
RESULTS
Characterization of BM Hes1-GFP+ cells from Hes1-GFP reporter mice
We utilized a previously developed Hes1 reporter mouse line [18], Hes1-GFP transgenic mice, to analyze the immunophenotypes of GFP-positive (Hes1-GFP+) cells from BM using flow cytometry. In normal adult Hes1-GFP mice, about 0.7% to 1.5% of total BM cells were Hes1-GFP+, of which 80% were also CD45+, indicating that many Hes1 expressing cells come from a hematopoietic origin (Fig. 1A). Among total Hes1-GFP+ cells, about 30% were CD3+ (T cells) or B220+ (B cells), 60% were CD11b+ (myeloid lineage cells), 8% were CD105+ (mesenchymal cells) and 35% were Sca-1+ cells (stem cells) (Fig. 1B). BM CD45− cells were used as a enriched MSC preparation [15]. To determine the composition of Hes1-GFP+ cells that express MSC markers, we gated on CD45−/Hes1-GFP+ cells and found that 70% of them were CD105+, 76% were Sca1+, 65% were CD105+Sca1+, 81% were LeptinR+, and 56% were αSMA+ cells (Fig. 1C). Thus, the majority of BM CD45− cells with active Hes1 promoter (Hes1 active; CD45−/Hes1-GFP+ cells) under normal homeostatic conditions express MSC surface markers. To investigate the bone cell differentiation potential of these cells, we examined the ability of CD45−/Hes1-GFP+ and CD45+/Hes1-GFP+ cells to form CFU-F, CFU-ALP+ colonies or OCs. CD45−/Hes1-GFP+ cells, but not CD45+/Hes1-GFP+ cells, formed both CFU-F and CFU-ALP+ colonies (Fig. 1D). CD45−/Hes1-GFP+ cells formed more CFU-ALP+ colonies and expressed higher levels of OB transcription factor, runx2, than CD45−/Hes1-GFP− cells (Fig. 1E). CD45+/Hes1-GFP+ cells formed slightly more OCs than CD45+/Hes1-GFP− cells (Fig. 1F). The expression of GFP, Hes1 and Hey1 in Hes1-GFP+ cells was confirmed by qPCR (Fig. 1G). Our data suggest that CD45−/Hes1-GFP+ cells from Hes1-GFP mice have characteristics of MSCs that can give rise to OBs.
Figure 1. CD45−/Hes1-GFP+ cells from bone marrow of Hes1-GFP transgenic mice have MSC properties.

3-month-old Hes1-GFP mice were used. Total bone marrow cells were stained with antibodies for various cell markers and subjected to flow cytometry. (A) Dot-plot of the distribution of CD45/GFP cells. (B) Sub-populations of total GFP+ cells. (C) Sub-populations of CD45−/GFP+ cells. Values are mean ± SD of 5 mice. (D) CD45−/GFP+ and CD45+/GFP− cells were sorted by FACS and cultured for CFU-F and CFU-ALP+ colony formation. CFU-F and CFU-ALP+ colony #/well were counted. Values are mean ± SD of 3 wells. (E) CD45−/GFP− and CD45−/GFP+ cells were sorted by FACS and cultured for CFU-ALP+ colony formation. Values are mean ± SD of 3 wells. Runx2 gene expression in cultured cells were determined by qPCR. (F) CD45+/GFP+ and CD45+/GFP− cells were cultured for osteoclast formation. TRAP+ osteoclasts (osteoclasts >3 nucleus) were counted. Photos show TRAP+ osteoclasts. Values are mean ± SD of 5 wells. (G) gfp, hes1 and Hey1 expressions in sorted GFP− and GFP+ cells were determined by qPCR. Values are the mean ± SD of 3 wells. All experiments were repeated 2 times. p<0.05 vs. GFP− cells.
Utilization of Hes1-GFP mice to monitor Hes1 promoter activity during OB differentiation in vitro
To determine if the frequency, intensity and distribution of Hes1-GFP+ cells can be used as outcome measures to dynamically assess changes in Hes1 promoter activity during OB differentiation, we cultured BM stromal cells from Hes1-GFP mice in basal growth medium for 20 days to form CFU-F colonies, and then switched the culture medium to OB inducing medium for another 10 days to form CFU-ALP+ colonies. We observed and quantified Hes1-GFP+ cells every 5 days up to 30 day. We defined a colony that is composed of more than 30 cells under a high magnification (power x20) inverted microscope. At day 5, numerous small CFU-F colonies were detected. We randomly marked 50 colonies and observed the same colonies for 30 days. At day 5, about 40% of colonies contained Hes1-GFP+ cells, but the number of Hes1-GFP+ cells per colony was very low. At day 10, all colonies contained Hes1-GFP+ cells, which were persistent up to the end of the experiment. Interestingly, the percentage and average number of Hes1-GFP+ cells per colony rapidly increased to 24±2% and 190±10 cells until day 20, respectively. After switching to OB inducing medium, the percentage or average number of GFP+ cells per colony gradually declined to 17%±2% and 120±15 cells, respectively, at day 30 (Fig. 2A). Representative pictures show decreased numbers of Hes1-GFP+ cells and GFP fluorescence intensity in a CFU-F colony (Fig. 2B) after switching to OB inducing medium at day 30 (Fig. 2C). ALP staining revealed that ALP+ cells were GFP− (Fig. 2D). Data suggested that Hes1 was activated during CFU cell expansion and was inhibited when cells differentiate to OBs. To examine if Hes1 promoter activity during CFU cell expansion and differentiation can be modified, we treated CFU and CFU-ALP+ cells with DAPT to suppress Notch signaling [15]. A similar GFP florescence intensity was observed in cells treated with DAPT and control at the beginning of treatment (Fig. 3A). DAPT decreased the fluorescence intensity of Hes1-GFP+ colony cells (Fig. 3B–D). DAPT also reduced the cell number in a CFP-F colony, but increased the cell number in a CFU-ALP+ colony (Fig. 3E).
Figure 2. Decreased Notch activation during osteoblast differentiation from MSC colonies.
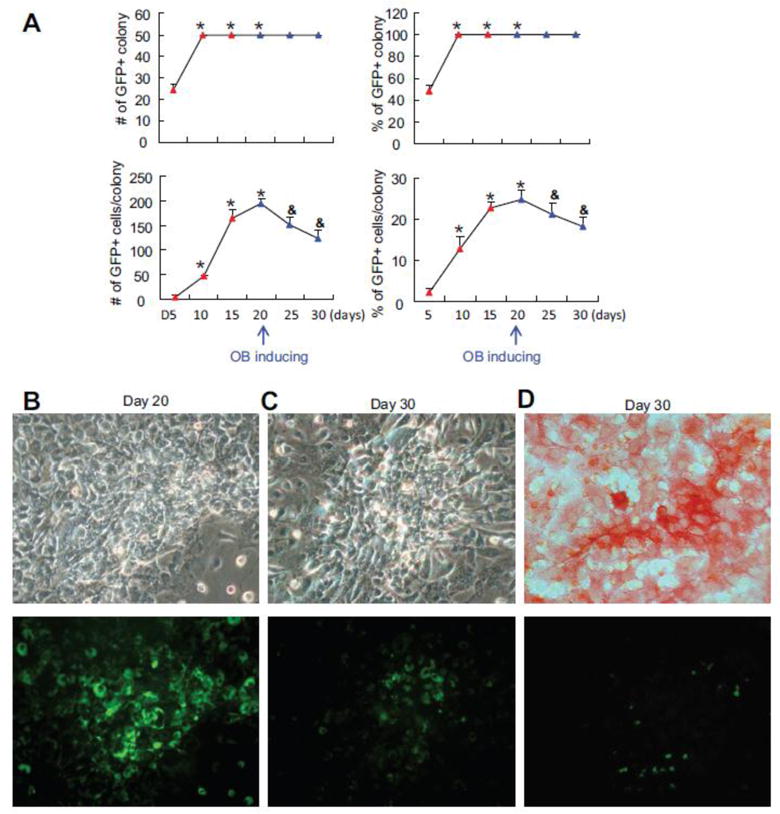
Total bone marrow stromal cells from Hes1-GFP mice were cultured in growth medium for 20 days and then switched to osteoblast inducing medium for additional 10 days in CFU assays. Fifty colonies/dish were randomly selected and labeled for analyses. (A) The # and % of colony that contains GFP+ cells and the # and % GFP+/colony were counted every 5 days. Values are mean ± SD of 3 dishes. * p<0.05 vs D5; & p<0.05 vs. day 20. The experiments were repeated 3 times with similar results. Representative image of a GFP+ colony at day 20 (B) and day 30 (C). (D) Representative image of ALP+ colony at day 30. Up panel in (A), (B) and (C) showed the ALP staining under the bright field. Low panel showed the GFP fluorescence.
Figure 3. Treatment of CFU colonies with the γ-secretase inhibitor, DAPT, decreases Hes1-GFP+ cells in MSC colonies.

(A) Representative image of a GFP+ CFU-F colony prior to DAPT treatment. (B) Representative image of the same GFP+ colony in 5 days after DAPT treatment. (C) Representative image of ALP+ and GFP+ colony induced in osteoblast inducing medium and treated with DAPT for 5 days. (D) Values are mean plus SD of GFP signal intensity before and after DAPT treatment from 12 individual colonies. (E) Values are mean plus SD of ALP+ or GFP+ cell number/colony. p<0.05 vs. day 0. The experiments were repeated 3 times with similar results.
Increased CD45−/Hes1-GFP+ MSCs in Hes1-GFP mice exposed to acute and chronic TNF stimulation
We reported previously that TNF limits OB differentiation by activating Notch signaling in MSCs and CD45−/CD105+/Scal+ MSCs from TNF-Tg mice have elevated expression levels of Notch target genes, such as Hes1 [15]. To determine if we could observe similar Notch activation in CD45−/Hes1-GFP+ cells after TNF stimulation, we injected TNF (0.5 μg per i.p. injection, twice a day for 5 days) or PBS into Hes1-GFP mice for 3 days and examined changes in the percentage and number of Hes1-GFP+ cells in CD45−enriched MSCs using flow cytometry. Data show that the percentage and total number of Hes1-GFP+ and CD45−/Hes1-GFP+ cells were increased significantly, while the total number of GFP− cells decreased in TNF-injected mice (Fig. 4A). CD45−/Hes1-GFP+ cells from TNF-injected mice formed fewer CFU-ALP+ colonies compared to those from PBS-injected mice (Fig. 4B). To confirm Notch activation by TNF, we measured the expression levels of Hes1 in CD45−/Hes1-GFP+ cells and found a 3-fold increase in cells isolated from TNF-injected mice (Fig. 4C). To determine if Hes1-GFP cells could be used as indicators for Hes1 promoter activity under the condition of chronic TNF over-expression as seen in TNF-Tg mice, we generated Hes1-GFP/TNF-Tg double transgenic mice and compared their BM Hes1-GFP+ cells to cells from Hes1-GFP littermate mice. Similar to TNF-injected mice, the percentage and number of total Hes1-GFP+ and CD45−/Hes1-GFP+ cells (Fig. 4D) as well as the expression levels of Hes1 (Fig. 4E) were increased in Hes1-GFP/TNF-Tg mice. Consistent with the known role of TNF in OB inhibition and Hes1 activation, CD45−/Hes1-GFP+ cells from Hes1-GFP/TNF-Tg mice formed fewer CFU-ALP+ colonies (Fig. 4F) and theses colonies contained a higher number and percentage of GFP+ cells (Fig. 4G) compared to cells from Hes1-GFP mice.
Figure 4. TNF increases the number of MSCs with high Notch activation.
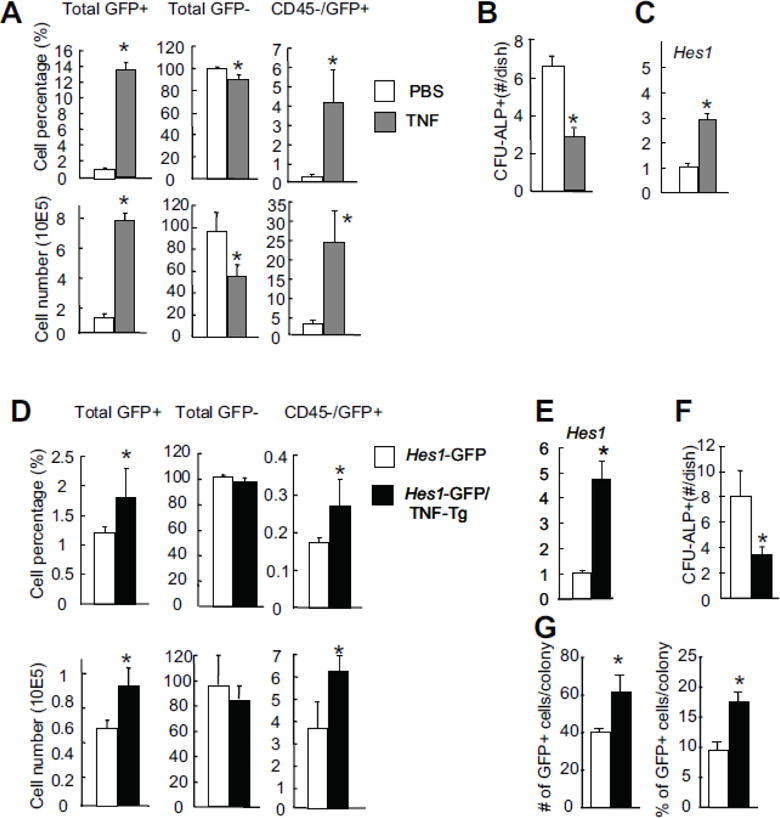
(A–C) Hes1-GFP mice were injected with TNF (0.5 μg/injection, ip, twice a day for 5 days) or PBS. The frequency of bone marrow CD45−/GFP+ MSCs (A), the number of CFU-ALP+ colonies (B), and their expression levels of Hes1 were determined by flow cytometry, CFU-ALP colony assays or qPCR. Values are mean ± SD of 4 mice. *p <0.05 vs. PBS-injected mice. (D–G) 6-month-old Hes1-GFP/TNF-Tg mice and Hes1-GFP littermate controls were used. The frequency of bone marrow CD45−/GFP+ MSCs (D), and their expression of Hes1 (E) were determined. Values are mean ± SD of 5 mice. (F) CD45−/GFP+ cells were sorted by FACS and cultured in CFU-ALP+ colony assays. CFU-ALP+ colony #/well were counted. Values are mean ± SD of 3 wells. (G) Bone marrow cells were cultured in CFU-ALP colony assays. The # and % of GFP+ cells/colony were assessed as in Figure 2. Values are mean ± SD of 3 wells. *p <0.05 vs. cells from Hes1-GFP mice.
Distribution of Hes1-GFP+ cells in the BM cavity of Hes1-GFP/TNF-Tg mice
We previously reported elevated Notch signaling in MSCs of TNF-Tg mice [15]. However, we do not know the location and distribution of Hes1 active cells nor their relationship with other cell types in the BM environment. Hes1-GFP/TNF-Tg mice allow us to study these questions. To understand whether Hes1-GFP+ cells are increased, where they localize, and what relationship they have to OBs and OCs during inflammatory bone loss, we analyzed 6-month-old Hes1-GFP/TNF-Tg mice as this is a stage at which TNF-Tg mice develop severe systemic bone loss [15]. Using a whole slide imager [21], we scanned H&E-stained paraffin sections under light microscopy and scanned unstained frozen sections of entire femurs from Hes1-GFP/TNF-Tg mice and Hes1-GFP litter mates under fluorescent microscopy. H&E-stained sections revealed bone erosion and osteopenia (Fig. 5Aa–b) in Hes1-GFP/TNF-Tg mice. Fluorescent microscopy revealed fewer randomly distributed Hes1-GFP+ cells in BM of Hes1-GFP mice (Fig. 5Ac) and significantly increased Hes1-GFP+ cells within the BM near the endosteal surfaces in Hes1-GFP/TNF-Tg mice (Fig. 5Ad, pink arrows). To determine if these Hes1-GFP+ cells are OBs, we performed immunofluorescent staining using an anti-osteocalcin Ab for OBs in femoral sections of Hes1-GFP/TNF-Tg mice. Hes1-GFP+ cells did not co-localize with osteocalcin+ OBs (Fig. 5B), but their number and GFP fluorescence intensity were increased (Fig. 5C). Furthermore, we noticed that some Hes1-GFP+ cells were localized near small blood vessels (Fig. 5Ad, white arrows). Because Notch signaling is activated during endothelial cell network formation [22], we asked if Hes1-GFP+ cells in our Hes1-GFP/TNF-Tg mice are endothelial cells. Immunofluorescent staining with anti-CD31 Ab indicated that many of the Hes1-GFP+ cells near blood vessels were also CD31+ (Fig. 5D).
Figure 5. Distribution of GFP+ cells in the bone marrow of Hes1-GFP/TNF-Tg mice.

Femoral bones from 6-month-old Hes1-GFP/TNF-Tg mice and Hes1-GFP littermate control mice were subjected to frozen sectioning. (A) Representative images of H&E-stained sections in the left panel at low power (x2) show normal trabecular and cortical bone structure of Hes1-GFP mice (a) and osteopenia (black stars) and bone erosion (black arrows) in sections from Hes1-GFP/TNF-Tg mice (b). Representative images of adjacent unstained frozen sections in the right panel show few GFP+ cells in the marrow cavity of Hes1-GFP mice (c) and a significantly increased GFP+ cells in the marrow cavity of Hes1-GFP/TNF-Tg mice (d). These GFP+ cells are localized near endosteum area (purple arrows) and small vessel like structures (white arrows). (B) Co-localization of GFP+ cells and osteocalcin+ cells was determined by immunofluorescence staining and demonstrated as an enlarged image of the red box in image. Quantification of GFP+ cells/section. Values are mean plus SD of 4 mice. (C) Hes1-GFP+ cell # and their GFP intensity on the endosteum area were assessed. Values are mean plus SD of 4 mice. (D) Co-localization of GFP+ cells and CD31+ cells was determined by immunofluorescence staining and demonstrated as an enlarged image of the yellow box. Quantification of GFP+/CD31+ cells/section. *p < 0. 05 vs data from Hes1-GFP mice.
Increased CD45−/Hes1-GFP+ MSCs in Hes1-GFP/TNF-Tg mice are mediated by PDGFRβ-mediated proliferation
To study mechanisms mediating increased CD45−/Hes1-GFP+ MSCs in Hes1-GFP/TNF-Tg mice, we examined proliferation or apoptosis of these cells by BrdU injection and flow cytometric analyses. Compared to cells from Hes1-GFP littermates, Hes1-GFP/TNF-Tg mice had a small, but significant increased percentage of BrdU+/CD45−/Hes1-GFP+ cells (Fig. 6A), while apoptotic cells remained unchanged (Fig. 6B). Notch signaling plays an essential role in maintaining MSC proliferation in WT mice [3]. Notch activation increases PDGFRβ expression in hemangioblasts [23] and smooth muscle cells [24]. PDGFRβ signaling is one of the key pathways to keep MSC self-renewal [25]. In our RNAseq data set, we found higher expression levels of PDGFRβ in purified CD45−/CD105+/Sca1+ MSCs isolated from TNF-Tg mice (RNAseq reads/kilobase per million: 83+29 vs. 24.5+14 in WT cells, p<0.05) [15]. Thus, we wanted to know if CD45−/Hes1-GFP+ cells from Hes1-GFP/TNF-Tg mice have increased PDGFRβ protein expression to explain increased proliferation. We found a significant increased percentage and mean fluorescence intensity of PDGFRβ in CD45−/Hes1-GFP+ cells from Hes1-GFP/TNF-Tg mice compared to those from Hes1-GFP littermates (Fig. 6C). To determine if increased proliferation of MSCs in Hes1-GFP/TNF-Tg mice is through PDGFRβ signaling, we cultured Hes1-GFP BM cells to form CFU-F mesenchymal colonies and treated them with TNF in the presence of the specific PDGFRβ signal inhibitor Su16f. TNF increased the number of BrdU+/Hes1-GFP+ cells and their GFP intensity. Su16f prevented TNF-increased BrdU+/Hes1-GFP+ cell numbers, but not GFP intensity (Fig. 6D), indicating that PDGFRβ signaling may mediate TNF-induced proliferation but not Notch activation. To study the involvement of Notch signal in this process, we treated C3H10T1/2 cells with TNF in the presence of Thapsigargin (Thap), a newly identified Notch signaling inhibitor [26]. Thap blocked TNF-induced expression of Hes1, PDGFRβ and Cyclin D1 (Fig. 6E). Thus, it is likely that TNF-induced proliferation is mediated by a PDGFRβ signal, which works downstream of Notch (Fig. 6F).
Figure 6. TNF-induced proliferation of Hes1-GFP+ MSCs is prevented by PDGFRβ inhibition.

6-month-old Hes1-GFP/TNF-Tg mice and Hes1-GFP littermate control mice were injected with BrdU and bone marrow cells were stained with anti-BrdU or Annexin V antibodies plus or minus Propidium iodide (PI). CD45−/GFP+ cells were gated and the % of BrdU+ (A) and AnnexinV+/PI− cells (B) for proliferation and apoptosis were assessed, respectively. (C) GFP+ cells expressing PDGFRβ were examined for the percentage and mean fluorescence intensity (MFI). Values are mean plus SD of 5 mice. *p < 0.05 vs data from Hes1-GFP mice. (D) Bone marrow cells from Hes1-GFP mice were cultured to form CFU-F colonies and incorporated with BrdU. Cells were treated with TNF (10 ng/ml), PDGFRβ inhibitor (su16f, 1mM), or TNF plus su16f for 24 hours. BrdU+ cells were identified by IHC with anti-BrdU antibody. The percentage of BrdU+ within GFP+ cells and their GFP intensity were measured. Values are mean plus SD of 3 wells. Experiments were repeated 2 times. *p < 0.05 vs. PBS, and #p < 0.05 vs. TNF. (E) C3H10T1/2 cells were treated with TNF and/or Thapsigargin (Thap) for 12 hours. Expression of Hes1, PDGFRβ and Cyclin D1 protein levels were examined by Western blot. Experiments were repeated 2 times. (F) A cartoon showing potential relationship among TNF, Hes1 (Notch), PDGFRβ, and cell proliferation.
DISCUSSION
The Notch signaling pathway plays important roles in controlling bone mass under normal and pathological conditions by regulating MSC pool and osteoblast differentiation [2] [3]. However, the distribution and dynamic change of Notch active cells in bone and bone marrow (BM) have not been well examined. Hes1-GFP mice have generated by inserting the 2.5-kb Hes1 promoter upstream of sequences encoding destabilized eGFP, in which GFP+ cells represent the cells carrying the Hes1-GFP transgene, while GFP fluorescence per cell reflect Hes1 promoter activity. Because Hes1 is one of targets of Notch signaling, Hes1-GFP mice have been used to visualize Notch activation in Hes1-expressing (Hes1-GFP+) cells in the central nerve system [27]. Brain Hes1-GFP+ cells have neural stem cell characteristics in ex vivo cultures and undergo asymmetric cell division to give rise to a neuronal daughter cell and a progenitor cell [18]. Thus, Hes1-GFP+ cells in Hes1-GFP mice can be used to as indicators for changes in Notch activation status of stem cells. In this study, we used BM cells and bone sections from Hes1-GFP and Hes1-GFP/TNF-Tg mice to assess which cells have active Hes1 within bone in normal bone remodeling and in inflammatory bone loss.
We demonstrated that Hes1-GFP mice have few Hes1-GFP+ cells in their BM. These cells have lower GFP fluorescence intensity, stain negatively for osteocalcin, and are located along the endosteum. GFP ex vivo tracking assays indicated that Hes1-GFP+ cells are rapidly increase in the number and GFP intensity when they are cultured in the growth medium during CFU-F colony expansion, which declines when CFU-F colonies differentiate into CFU-ALP+ colonies (Fig. 2). The degree of GFP increase is positively associated with the growth of CFU-F colonies. This is likely due to increased cell-to-cell contact, resulting in the amplification of Notch signaling. Our data indicate that in the normal homeostatic BM, basal Hes1 promoter activity is low. There is a relationship between Hes1 promoter activity, MSC proliferation and OB differentiation: Notch signal is active at the proliferation stage and turned off during the OB differentiation stage [3].
We found that Hes1-GFP/TNF-Tg mice have an increased number of Hes1-GFP+ cells in their BM and these cells have higher GFP intensity (Figs. 4–5). TNF increases BrdU incorporation in CD45−/Hes1-GFP+ cells. Thus, TNF likely increases both proliferation and Hes1 promoter activity of Hes1-GFP+ cells. Notch signaling promotes cell proliferation via various mechanisms. Notch regulates the expressions of cell cycle related proteins including cyclin D1 and CDK2 in T-cell lymphoblastic leukemia [28, 29], CDK4 in breast cancer cells [30], cyclin A in retinoblastoma [31], and cyclin E in embryonic stem cells [32]. In WT MSCs, Notch increases cyclin D and cyclin E levels [2]. Our data indicate that Notch inhibition blocks TNF-induced PDGFRβ and Cyclin D1 expression. PDGF-BB, the ligand of PDGFRβ, is one of key factors to promote MSC self-renewal [25]. Notch increases PDGFRβ expression in hemangioblasts [23] and smooth muscle cells [24], while de-activation of Notch by deleting RBPjκ in smooth muscle cells lost the expression of PDGFRβ [33]. Thus, it is possible that under chronic inflammation, TNF increases Notch activity in MSCs, leading to their proliferation by up-regulating PDGFRβ and PDGFRβ might be a downstream molecule of Notch in the process (Fig. 6F).
Some of GFP+ cells in the BM of Hes1-GFP/TNF-Tg mice localize to small vessels that express the endothelium marker, CD31. Specific knockout of RBPjκ in endothelial cells results in a decrease in cell proliferation and vessel growth in postnatal long bones, suggesting endothelial Notch activity promotes angiogenesis [34]. In addition, Notch signaling is activated in blood vessel endothelium under inflammatory conditions [35]. Our data of increased CD31+/Hes1-GFP+ endothelial cells in Hes1-GFP/TNF-Tg mice is consistent with these findings.
Hes1-GFP mice may provide a useful tool to monitor the dynamic changes of Notch activation in vivo or ex vivo. However several limitations exist with this mouse model. First, Hes1-GFP+ cells may not absolutely represent the endogenous Hes1 expressing cells. Although it was reported that the expression pattern of Hes1 mRNA is similar to that of GFP+ cells in Hes1-GFP mice by in situ hybridization, indicating that Hes1-GFP expression can mimic the endogenous Hes1 expression [18], we do not have a strong evidence to show the overlap of Hes1-GFP+ cells with endogenous Hes1 expressing cells. We found that Hes1-GFP+ cells expressed only 1 fold more of Hes1 mRNA than Hes1-GFP− cells under the basal condition, suggesting that the basal Hes1 promoter activity is not as high as we expected. Second, the literature reported that Hes1 can be activated by signals other than Notch, such as TGFβ [36], sonic hedgehog [37], and Wnt [38]. Therefore, it is necessary to exclude the other signals interfering with Notch to activate Hes1 expression. Finally, Hes1 is one of targets of Notch signaling and more accurate Notch reporter mouse models, such as Hes5-GFP [39] and TNR mice (a mouse line drives GFP expression under the control of repeated RBP-Jκ-response elements) [3], are already available. Crossing these mice with TNF-Tg mice could provide more comprehensive study of Notch activation under chronic inflammation.
In summary, our study demonstrated that GFP+ cells from BM of Hes1-GFP mice are heterogeneous and include MSCs, hematopoietic cells and endothelial cells. In combination with cell type specific markers such as CD45, these Hes1-GFP+ cells can be used as a readout for Notch activation status under normal and disease conditions, such as mice exposed to elevated levels of TNF. We found a rapid increase in the number of Hes1-GFP+ cells and GFP intensity during the expansion of CFU-F colonies. Hes1-GFP/TNF-Tg mice had higher numbers of CD45−/Hes1-GFP+ cells with a greater proportion being BrdU+, which was inhibited by a PDGFRβ signal inhibitor. Notch inhibition blocks TNF-mediated PDGFRβ expression and cell proliferation. Thus, Notch may mediate TNF-induced cell proliferation by affecting PDGFRβ.
Table 1.
| Name | F/R | Sequences | Accession Number | Tm(°C) | bP |
|---|---|---|---|---|---|
| Hes1 | F | GACCCAGATCAACGCCATGA | NM_008235 | 60 | 225 |
| R | TGGAAGCCGCCAAAAACGTT | ||||
| Hey1 | F | GCGCGGACGAGAATGGAAA | NM_010423 | 60 | 186 |
| R | TCAGGTGATCCACAGTCATCTG | ||||
| p52 | F | ATGGAGAGTTGCTAGAACCCA | NM_001177370 | 60 | 135 |
| R | CTGTTCCACGATCACCAGGTA | ||||
| RelB | F | GTTCCAGTGACCTCTCTTCCC | NM_009046 | 60 | 84 |
| R | CCAAAGCCGTTCTCCTTAATGTA | ||||
| GAPDH | F | GGTCGGTGTGAACGGATTTG | NM_008084 | 55 | 508 |
| R | ATGAGCCCTTGCACAATG |
HIGHLIGHTS.
Hes1-GFP mice may provide a useful tool to assess the Notch activation in bone.
The distribution and dynamic change of Hes1 expressing cells in normal and inflammatory bones were examined.
CD45−/Hes1+ cells have increased proliferation in chronic inflammation.
TNF increases the proliferation of Hes1-GFP+ cells through PDGFRβ signaling.
Acknowledgments
The authors thank Martin Chang and Ashish Thomas for technical assistance with the whole slide-scanner. Research was supported by grants from National Institute of Health PHS awards (AR48697, AR63650, and N13G-084 to LX, 1S10RR027340-01 to BFB, AR059733 and AR057022 to MJH, and AR061307 and AR054041 to EMS).
Footnotes
Publisher's Disclaimer: This is a PDF file of an unedited manuscript that has been accepted for publication. As a service to our customers we are providing this early version of the manuscript. The manuscript will undergo copyediting, typesetting, and review of the resulting proof before it is published in its final citable form. Please note that during the production process errors may be discovered which could affect the content, and all legal disclaimers that apply to the journal pertain.
Disclosure: The authors declare that no conflicts of interest exist.
Authors’ roles: Study design: HZ, WS, XL, BFB, MH and LX. Study conduct: HZ, WS, and XL. Data collection: HZ, WS, and XL. Data analysis: HZ, WS, and XL. Data interpretation: HZ, WS, XL, BFB, MH and LX. Drafting manuscript: HZ, WS and LX. Revising manuscript content: HZ, WS, BFB, MH and LX. Approving final version of manuscript: HZ, WS, XL, BFB, MH and LX. LX takes responsibility for the integrity of the data analysis.
References
- 1.Teodorczyk M, Schmidt MH. Notching on Cancer’s Door: Notch Signaling in Brain Tumors. Front Oncol. 2014;4:341. doi: 10.3389/fonc.2014.00341. [DOI] [PMC free article] [PubMed] [Google Scholar]
- 2.Engin F, et al. Dimorphic effects of Notch signaling in bone homeostasis. Nat Med. 2008;14(3):299–305. doi: 10.1038/nm1712. [DOI] [PMC free article] [PubMed] [Google Scholar]
- 3.Hilton MJ, et al. Notch signaling maintains bone marrow mesenchymal progenitors by suppressing osteoblast differentiation. Nat Med. 2008;14(3):306–14. doi: 10.1038/nm1716. [DOI] [PMC free article] [PubMed] [Google Scholar]
- 4.Zanotti S, et al. Notch inhibits osteoblast differentiation and causes osteopenia. Endocrinology. 2008;149(8):3890–9. doi: 10.1210/en.2008-0140. [DOI] [PMC free article] [PubMed] [Google Scholar]
- 5.Chen S, Lee BH, Bae Y. Notch signaling in skeletal stem cells. Calcif Tissue Int. 2014;94(1):68–77. doi: 10.1007/s00223-013-9773-z. [DOI] [PMC free article] [PubMed] [Google Scholar]
- 6.Dong Y, et al. RBPjkappa-dependent Notch signaling regulates mesenchymal progenitor cell proliferation and differentiation during skeletal development. Development. 2010;137(9):1461–71. doi: 10.1242/dev.042911. [DOI] [PMC free article] [PubMed] [Google Scholar]
- 7.Suzuki T, et al. Highly efficient ex vivo expansion of human hematopoietic stem cells using Delta1-Fc chimeric protein. Stem Cells. 2006;24(11):2456–65. doi: 10.1634/stemcells.2006-0258. [DOI] [PubMed] [Google Scholar]
- 8.Varnum-Finney B, et al. Pluripotent, cytokine-dependent, hematopoietic stem cells are immortalized by constitutive Notch1 signaling. Nat Med. 2000;6(11):1278–81. doi: 10.1038/81390. [DOI] [PubMed] [Google Scholar]
- 9.Kunisato A, et al. HES-1 preserves purified hematopoietic stem cells ex vivo and accumulates side population cells in vivo. Blood. 2003;101(5):1777–83. doi: 10.1182/blood-2002-07-2051. [DOI] [PubMed] [Google Scholar]
- 10.Duncan AW, et al. Integration of Notch and Wnt signaling in hematopoietic stem cell maintenance. Nat Immunol. 2005;6(3):314–22. doi: 10.1038/ni1164. [DOI] [PubMed] [Google Scholar]
- 11.Zhao B, et al. Interferon regulatory factor-8 regulates bone metabolism by suppressing osteoclastogenesis. Nat Med. 2009;15(9):1066–71. doi: 10.1038/nm.2007. [DOI] [PMC free article] [PubMed] [Google Scholar]
- 12.Fukushima H, et al. The association of Notch2 and NF-kappaB accelerates RANKL-induced osteoclastogenesis. Mol Cell Biol. 2008;28(20):6402–12. doi: 10.1128/MCB.00299-08. [DOI] [PMC free article] [PubMed] [Google Scholar]
- 13.Sethi N, et al. Tumor-derived JAGGED1 promotes osteolytic bone metastasis of breast cancer by engaging notch signaling in bone cells. Cancer Cell. 2011;19(2):192–205. doi: 10.1016/j.ccr.2010.12.022. [DOI] [PMC free article] [PubMed] [Google Scholar]
- 14.Li P, et al. Systemic tumor necrosis factor alpha mediates an increase in peripheral CD11bhigh osteoclast precursors in tumor necrosis factor alpha-transgenic mice. Arthritis Rheum. 2004;50(1):265–76. doi: 10.1002/art.11419. [DOI] [PubMed] [Google Scholar]
- 15.Zhang H, et al. NOTCH inhibits osteoblast formation in inflammatory arthritis via noncanonical NF-kappaB. J Clin Invest. 2014;124(7):3200–14. doi: 10.1172/JCI68901. [DOI] [PMC free article] [PubMed] [Google Scholar]
- 16.Wang C, et al. Transient gamma-secretase inhibition accelerates and enhances fracture repair likely via Notch signaling modulation. Bone. 2014;73C:77–89. doi: 10.1016/j.bone.2014.12.007. [DOI] [PMC free article] [PubMed] [Google Scholar]
- 17.Hiyama A, et al. Hypoxia activates the notch signaling pathway in cells of the intervertebral disc: implications in degenerative disc disease. Arthritis Rheum. 2011;63(5):1355–64. doi: 10.1002/art.30246. [DOI] [PMC free article] [PubMed] [Google Scholar]
- 18.Ohtsuka T, et al. Visualization of embryonic neural stem cells using Hes promoters in transgenic mice. Mol Cell Neurosci. 2006;31(1):109–22. doi: 10.1016/j.mcn.2005.09.006. [DOI] [PubMed] [Google Scholar]
- 19.Keffer J, et al. Transgenic mice expressing human tumour necrosis factor: a predictive genetic model of arthritis. EMBO J. 1991;10(13):4025–31. doi: 10.1002/j.1460-2075.1991.tb04978.x. [DOI] [PMC free article] [PubMed] [Google Scholar]
- 20.Darzynkiewick, Roederer, and Tanke. New Developments. (4th) 2004;75 Cytometry. [Google Scholar]
- 21.Shi J, et al. Distribution and alteration of lymphatic vessels in knee joints of normal and osteoarthritic mice. Arthritis Rheumatol. 2014;66(3):657–66. doi: 10.1002/art.38278. [DOI] [PMC free article] [PubMed] [Google Scholar]
- 22.Taylor KL, Henderson AM, Hughes CC. Notch activation during endothelial cell network formation in vitro targets the basic HLH transcription factor HESR-1 and downregulates VEGFR-2/KDR expression. Microvasc Res. 2002;64(3):372–83. doi: 10.1006/mvre.2002.2443. [DOI] [PubMed] [Google Scholar]
- 23.Chen VC, et al. Notch signaling respecifies the hemangioblast to a cardiac fate. Nat Biotechnol. 2008;26(10):1169–78. doi: 10.1038/nbt.1497. [DOI] [PMC free article] [PubMed] [Google Scholar]
- 24.Grieskamp T, et al. Notch signaling regulates smooth muscle differentiation of epicardium-derived cells. Circ Res. 2011;108(7):813–23. doi: 10.1161/CIRCRESAHA.110.228809. [DOI] [PubMed] [Google Scholar]
- 25.Gharibi B, Ghuman MS, Hughes FJ. Akt- and Erk-mediated regulation of proliferation and differentiation during PDGFRbeta-induced MSC self-renewal. J Cell Mol Med. 2012;16(11):2789–801. doi: 10.1111/j.1582-4934.2012.01602.x. [DOI] [PMC free article] [PubMed] [Google Scholar]
- 26.Roti G, et al. Complementary genomic screens identify SERCA as a therapeutic target in NOTCH1 mutated cancer. Cancer Cell. 2013;23(3):390–405. doi: 10.1016/j.ccr.2013.01.015. [DOI] [PMC free article] [PubMed] [Google Scholar]
- 27.Osathanon T, et al. Notch signalling inhibits the adipogenic differentiation of single-cell-derived mesenchymal stem cell clones isolated from human adipose tissue. Cell Biol Int. 2012;36(12):1161–70. doi: 10.1042/CBI20120288. [DOI] [PubMed] [Google Scholar]
- 28.Cohen B, et al. Cyclin D1 is a direct target of JAG1-mediated Notch signaling in breast cancer. Breast Cancer Res Treat. 2010;123(1):113–24. doi: 10.1007/s10549-009-0621-9. [DOI] [PubMed] [Google Scholar]
- 29.Guo D, et al. Notch-1 regulates Akt signaling pathway and the expression of cell cycle regulatory proteins cyclin D1, CDK2 and p21 in T-ALL cell lines. Leuk Res. 2009;33(5):678–85. doi: 10.1016/j.leukres.2008.10.026. [DOI] [PubMed] [Google Scholar]
- 30.Joshi I, et al. Notch signaling mediates G1/S cell-cycle progression in T cells via cyclin D3 and its dependent kinases. Blood. 2009;113(8):1689–98. doi: 10.1182/blood-2008-03-147967. [DOI] [PMC free article] [PubMed] [Google Scholar]
- 31.Baonza A, Freeman M. Control of cell proliferation in the Drosophila eye by Notch signaling. Dev Cell. 2005;8(4):529–39. doi: 10.1016/j.devcel.2005.01.019. [DOI] [PubMed] [Google Scholar]
- 32.Tetzlaff MT, et al. Defective cardiovascular development and elevated cyclin E and Notch proteins in mice lacking the Fbw7 F-box protein. Proc Natl Acad Sci U S A. 2004;101(10):3338–45. doi: 10.1073/pnas.0307875101. [DOI] [PMC free article] [PubMed] [Google Scholar]
- 33.Morimotoa M, Sagab Y, Kopana R. Notch signaling regulates epithelial Clara/cilia fate selection and mesenchymal arterial SMC determination during lung organogenesis. The 16th International Conference on the International Society of Differentiation. 2010;80(Supplement 1):S49. [Google Scholar]
- 34.Ramasamy SK, et al. Endothelial Notch activity promotes angiogenesis and osteogenesis in bone. Nature. 2014;507(7492):376–80. doi: 10.1038/nature13146. [DOI] [PMC free article] [PubMed] [Google Scholar]
- 35.Rizzo P, Miele L, Ferrari R. The Notch pathway: a crossroad between the life and death of the endothelium. Eur Heart J. 2013;34(32):2504–9. doi: 10.1093/eurheartj/ehs141. [DOI] [PubMed] [Google Scholar]
- 36.Xing Y, et al. Signaling via Alk5 controls the ontogeny of lung Clara cells. Development. 2010;137(5):825–33. doi: 10.1242/dev.040535. [DOI] [PMC free article] [PubMed] [Google Scholar]
- 37.Ingram WJ, et al. Sonic Hedgehog regulates Hes1 through a novel mechanism that is independent of canonical Notch pathway signalling. Oncogene. 2008;27(10):1489–500. doi: 10.1038/sj.onc.1210767. [DOI] [PubMed] [Google Scholar]
- 38.Aoyama K, et al. The interaction of the Wnt and Notch pathways modulates natural killer versus T cell differentiation. Stem Cells. 2007;25(10):2488–97. doi: 10.1634/stemcells.2007-0102. [DOI] [PubMed] [Google Scholar]
- 39.Basak O, Taylor V. Identification of self-replicating multipotent progenitors in the embryonic nervous system by high Notch activity and Hes5 expression. Eur J Neurosci. 2007;25(4):1006–22. doi: 10.1111/j.1460-9568.2007.05370.x. [DOI] [PubMed] [Google Scholar]