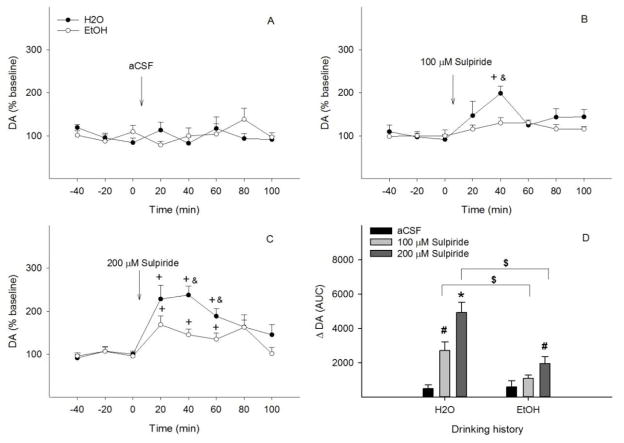
Figure 3.
Time-course effects of microinjection of aCSF (A), 100 μM (B) or 200 μM sulpiride (C) into the posterior ventral tegmental area on dopamine release in the nucleus accumbens shell of EtOH or water drinking rats (n=6–9/group). + p < 0.05, significantly greater than baseline; & p < 0.05, significantly greater than levels in the ‘EtOH’ group. Panel D shows dopamine change ( DA) expressed as area-under-the-curve (AUC) data for each group. * p < 0.05, significantly greater than aCSF and 100 /M sulpiride groups in water drinking condition; # p < 0.05, significantly greater than aCSF group in water or EtOH drinking condition; $ p < 0.05, significantly different between water and EtOH drinking conditions.

