

Abstract
Background
Ischemic cardiomyopathy (ICM) can provide the substrate for ventricular tachycardia (VT).
Objective
To map noninvasively with high resolution the electrophysiologic (EP) scar substrate, identify its relationship to reentry circuits during VT, and stratify VT risk in ICM patients.
Methods
Noninvasive high-resolution epicardial mapping with electrocardiographic imaging (ECGI) was performed in 32 ICM patients (17 with clinical VT, 15 without VT). Abnormal scar EP substrate was determined based on electrogram (EGM) amplitude (as percentage of maximal peak-to-peak voltage over the entire ventricular epicardium; total scar [TS] < 30%; dense scar [DS] < 15%), fractionation, and presence of late potentials (LPs). Scar burden was defined as the ratio of the scar size to the total epicardial surface area. The VT activation pattern was mapped and correlated with the EP substrate to identify components of the reentry circuit.
Results
Patients with VT had higher scar burden (TS: 51.0 ± 9.3% vs 36.5 ± 5.4%, P < 0.05; DS: 29.5 ± 7.3% vs 16.8 ± 6.8%, P < 0.05) with lower normalized unipolar EGM voltage (TS: 0.107 ± 0.027 vs 0.153 ± 0.031, P < 0.05; DS: 0.073 ± 0.023 vs 0.098 ± 0.026, P < 0.05), greater prevalence of fractionated EGMs (TS: 44.1 ± 10.6% vs 26.8 ± 6.3%, P < 0.05; DS: 50.8 ± 10.8% vs 30.9 ± 7.0%, P < 0.05), and LPs (TS: 26.8 ± 10.7% vs 15.8 ± 5.3, P < 0.05). VTs were mapped in eight patients; the reentry circuits were closely related to the EP substrate.
Conclusions
ECGI noninvasively identified scar EP substrate that underlies abnormal conduction in ICM patients. It identified regions within the scar that aligned with critical elements of the reentry circuit during VT. ECGI can potentially be used for VT risk stratification in ICM patients.
Keywords: arrhythmias, electrophysiology, myocardial infarction, mapping
Introduction
Scar-related ventricular arrhythmias are the most common cause of rhythm disorders and sudden cardiac death in patients who suffered myocardial infarction (MI). Healed infarcts can produce an inhomogeneous structure that supports an abnormal electrophysiologic (EP) substrate.1,2 This substrate is associated with slow discontinuous conduction and conduction block; it contains critical elements of reentry circuits that are crucial for the formation and maintenance of reentrant arrhythmias, in particular, ventricular tachycardia (VT).3–5
Catheter ablation guided by VT activation mapping has evolved to treat scar-related arrhythmias with up to 75% success rate after successful mapping procedures.6 However, nonsustained, noninducible, or hemodynamically unstable VTs cannot be mapped with this technique. Alternatively, EP substrate mapping during sinus rhythm (SR) identifies the scar EP substrate based on low voltage and the presence of fractionated electrograms (EGMs) and late potentials (LPs). At present, clinical catheter mapping relies on a roving-probe approach that records EGMs sequentially from many heartbeats to generate an electroanatomical map. Detailed invasive mapping with sufficiently high resolution is time consuming and involves substantial risk. While substrate mapping does not map the actual reentry circuit, sites of late activation during SR support a critical element of the reentrant circuit during VT and constitute a target for ablation.7,8
Scar-related reentry circuits may involve the endocardium, mid-myocardium, and epicardium. Importantly, the presence of epicardial VT circuits (in about 32% of patients with post-MI scars) is considered one of the reasons for failure of a subset of endocardial ablations.9 Consequently, epicardial mapping via subxyphoidal puncture has evolved as an essential procedure for mapping epicardial scar EP substrate and guiding epicardial ablation, especially in ischemic cardiomyopathy (ICM) patients with failed endocardial ablation. Epicardial mapping is associated with procedural complexity and risk of complications. In some cases, catheter access to the epicardium is limited by the presence of pericardial adherence. Noninvasive mapping of epicardial EP substrate and VT activation is therefore a highly desirable procedure. It could aid in deciding whether endocardial or epicardial approach should be used and provide important information for the preprocedural planning of epicardial ablation.
Our laboratory has demonstrated the ability of noninvasive electrocardiographic imaging (ECGI) to map the EP substrate and study mechanisms of arrhythmias in the intact human heart.10–15 Being noninvasive, ECGI reduces the procedural risk and can be repeated during the progressive remodeling of a scar. With its single-beat panoramic mapping capability, ECGI can map polymorphic and unstable VT. In this study, we apply ECGI during SR to map the epicardial EP substrate in ICM patients with high resolution. We also map the epicardial VT activation pattern (if present) and correlate it with the substrate map, to relate components of the reentry circuit to the scar. In addition, we compare the ECGI-mapped substrate in ICM patients with and without a history of VT, to determine whether substantial and consistent differences exist. This comparison serves to examine whether ECGI can potentially be used for noninvasive arrhythmic risk stratification in ICM patients.
Methods
Patient Population
All patients who participated in substrate mapping with ECGI had a history of MI (at least 6 months elapsed since the most recent MI) and systolic dysfunction with left ventricular ejection fraction (LVEF) ≤ 35%. For the substrate comparison protocol, the control group consisted of ICM patients with an implantable cardioverter defibrillator (ICD) inserted based on primary prevention criteria, and no history of clinical ventricular arrhythmias, syncope, or cardiac arrest for at least 48 months since ICD insertion. The case group patients experienced at least one episode of clinical VT post-MI. These patients may have an ICD inserted for the primary prevention of sudden death, but it was not required. All protocols were approved by the Institutional Review Boards at Washington University; written informed consent was obtained from all patients (Table I).
Table I.
Cumulative Patient Characteristics
| Characteristics | Case Group: VT Patients | Control Group: Non-VT Patients |
|---|---|---|
| N | 17 | 15 |
| Age (years) | 70 ± 10 | 68 ± 15 |
| Male | 16 (94%) | 13 (87%) |
| Left ventricular ejection fraction (%) | 24 ± 6 | 25 ± 5 |
| QRS duration (ms) | 135 ± 22 | 142 ± 25 |
| Mean time since myocardial infarction (months) | 90 ± 31 | 96 ± 21 |
| Infarct location | ||
| Anterior | 6 (35%) | 3 (20%) |
| Inferior | 9 (53%) | 11 (73%) |
| Apical | 10 (59%) | 8 (53%) |
| β-Blocker | 17 (100%) | 15 (100%) |
| ACE/ARB | 17 (100%) | 15 (100%) |
| Amiodaronea | 14 | 0 |
| Other antiarrhythmic drugsa | 6 | 0 |
Data are presented as mean ± standard deviation or number (percentage).
P < 0.05.
ACE = angiotensin-converting enzyme inhibitors; ARB = angiotensin receptor blockers; VT = ventricular tachycardia.
Data Acquisition and Analysis
The ECGI procedure was described previously10–15; a brief description of the procedure and a summary of the extensive ECGI validation studies, conducted over many years, are provided in sections 1 and 2 of the Supporting information. Clinical noninvasive cardiac imaging, including late gadolinium enhancement magnetic resonance imaging (LGE-MRI) (two patients) and myocardial perfusion imaging with single-photon emission computed tomography (SPECT; 30 patients), was available for comparing the ECGI-mapped EP substrate to the anatomical scar.
Characteristics of the abnormal EP substrate were determined from data recorded during SR. For risk stratification, the patients with history of VT were compared to those with no history of VT in terms of EP scar substrate properties mapped with ECGI during SR. This provided the basis of noninvasive risk stratification using ECGI. The EP substrate was defined based on normalized EGM magnitudes, fractionation, and the presence of LPs. EGM magnitude was normalized by the maximal magnitude of all EGMs reconstructed over the entire epicardium in a given patient. Based on the normalized magnitude, the substrate was classified as follows: total scar (TS) < 30% of maximal magnitude; dense scar (DS) < 15%; peripheral scar (PS) between 15% and 30%. Scar burden was defined based on the size of TS, DS, and PS as a percentage of total epicardial surface area. The degree of scar heterogeneity was quantified by EGM fractionation, expressed as the number of intrinsic, steep negative deflections per EGM. Each EGM reflected the electrical activity in cardiac tissue beneath and adjacent to the EGM location. For fractionated EGMs, deflections due to far-field activities were identified if the timing of the deflections matched the timing of deflection(s) in neighboring EGMs, remote EGMs, or both (Fig. S1). Far-field deflections were marked and excluded for fractionation analysis. The remaining deflections were considered local activations. The sharpest local activation with the maximal negative slope was used to create the global activation isochrone map. LPs were defined as local activations with magnitude above the ambient electrical noise level that occurred after the completion of global epicardial activation. The presence of a conducting channel within a scar EP substrate was inferred if a continuous region with higher voltage amplitude than its surroundings was observed. Activation time (AT) was determined by the maximal negative slope of the EGM during QRS. All ATs were referenced to the beginning of QRS in ECG lead II. Epicardial activation isochrone maps were created from ATs. Lines of conduction block were determined if adjacent ATs differed by more than 50 ms.
ECGI mapped ventricular arrhythmias from a single beat and did not require accumulating data from multiple identical beats. Each arrhythmia was characterized and analyzed based on the global activation isochrones, properties of local EGMs, and patterns of wavefront propagation and its relationship to the scar EP substrate. The VT data were not used for risk stratification, which was based on EP substrate characteristics mapped in SR.
Statistical Analysis
All continuous data are presented as mean ± standard deviation. Categorical data were analyzed by the χ2 test (or Fisher’s exact test). Continuous variables were analyzed by unpaired t-test. The Satterthwaite modified t-test was used for variables with unequal variances. The Mann-Whitney U test was used for variables with nonnormal distribution. All test values with P < 0.05 were considered statistically significant. Statistical analysis was performed using SPSS v19 (IBM Corp., Armonk, NY, USA). A table of statistical data is provided in section 4 of the Supporting information.
Results
Between March 2010 and March 2014, 32 ICM patients were enrolled in this study, including 15 patients with no history of clinical VT (control group) and 17 patients with spontaneous VT (case group). Patient characteristics are provided in Table I. Overall, the two groups had similar characteristics in terms of age, gender, LVEF, QRS duration, time since MI, and infarct distribution. All patients were treated with β-blockers and angiotensin-converting enzyme inhibitors/angiotensin receptor blockers. Only VT patients were treated with antiarrhythmic drugs (AADs).
Characteristics of Abnormal EP Substrate
Figure 1(A) shows a reconstructed epicardial unipolar EGM from within a scar (top) and its time derivative (dV/dt; bottom), which emphasizes fractionation. This EGM has low voltage and three deflections, reflecting three local activation events. The second deflection has the sharpest negative slope and was taken as the AT for constructing the global isochrone map. The third deflection occurred after the completion of global epicardial activation (the latest activation over both ventricles) and was classified as LP. Figure 1(B) shows an EGM from a location remote to the scar and its time derivative.
Figure 1.
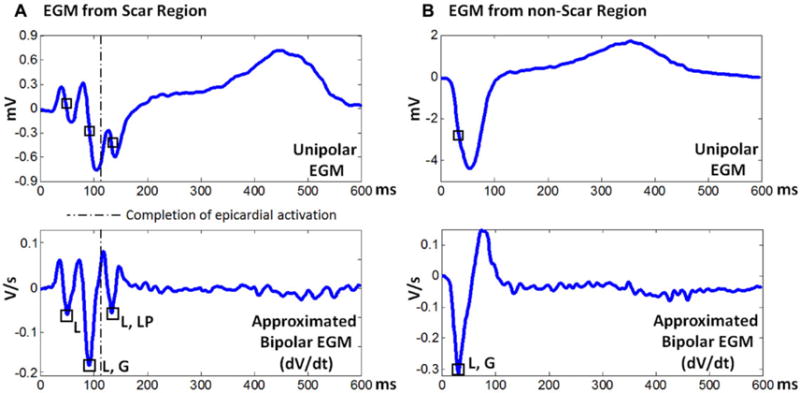
Representative electrograms (EGMs) from scar region (A) and from nonscar region (B). Each panel shows a reconstructed unipolar EGM (top) and the corresponding time derivatives (dV/dt; bottom), which emphasize fractionation. Squares indicate intrinsic sharp deflections, reflecting local activation. The dashed line indicates the time when global epicardial activation has been completed. G = global activation; L = local activation; LP = late potential. Note that the EGM from the scar region has low voltage and multiple deflections.
Figure 2 shows the EP substrate in a VT patient, mapped with ECGI during SR. SPECT images (Panel F) suggested the presence of a large, severe apical infarct. ECGI colocalized the abnormal EP substrate to this extensive apical infarct (Panel B). The only region with normal-voltage EGMs was the ventricular base. High-resolution voltage map identified several channels with preserved voltage (Panel C, light blue, green) that traversed the DS. Fractionated EGMs (Panel D) and LPs (Panel E) were present inside the electrical scar. The activation isochrone map (Panel A) showed delayed activation of the left ventricle as a result of the extensive infarct. Lines of block (black arrows) were mapped over the interventricular septum.
Figure 2.

The abnormal electrophysiologic substrate in a VT patient with a large apical infarct. (A) Activation isochrone map. (B) Global voltage map; magnitude of unipolar electrograms. (C) High-resolution scar voltage map with adjusted color scale. (D) Electrogram fractionation; number of intrinsic deflections per electrogram. (E) Presence of late potentials (red). Panels A–E display the heart in anterior (left) and inferior (right) views. (F) Single-photon emission computed tomography (SPECT) anatomical scar in apical view (left) and long-axis view (right). In panel A, epicardial breakthrough is indicated by an asterisk, isochrones are depicted with thin black lines, and black arrows point to conduction block along the septum. LA = left atrium; LV = left ventricle; RA = right atrium; RV = right ventricle; VT = ventricular tachycardia.
Figure 3 (same format as Fig. 2) shows the EP substrate in a non-VT patient with an inferior infarct. ECGI during SR colocalized the abnormal EP substrate to the inferior scar, with low EGM amplitudes, fractionation, and LPs. Data for all patients are provided in the Supporting information (Figs. S4–S35).
Figure 3.

The abnormal electrophysiologic substrate in a non-VT patient with an inferior infarct. Same format as Figure 2. VT = ventricular tachycardia.
Relationship between Ventricular Arrhythmias and EP Substrate
Figure 4 presents an anterior scar-related VT with a double-loop reentry pattern from patient #8 (substrate shown in Fig. S11). The cycle length (CL) of VT was 397 ms. Earliest epicardial activation was mapped in the anterior wall near the apex (red). The activation wavefront exited this region in two directions, forming a clockwise apical loop (white arrows) and a counterclockwise anterior loop (black arrows). The two wavefronts merged in the anterior right ventricle. From here, the merged wavefront slowly traversed the anterior scar (zigzag arrow) and reentered the region of earliest activation. The VT common pathway aligned with a region of relatively preserved voltage and presence of LPs within the EP scar substrate.
Figure 4.
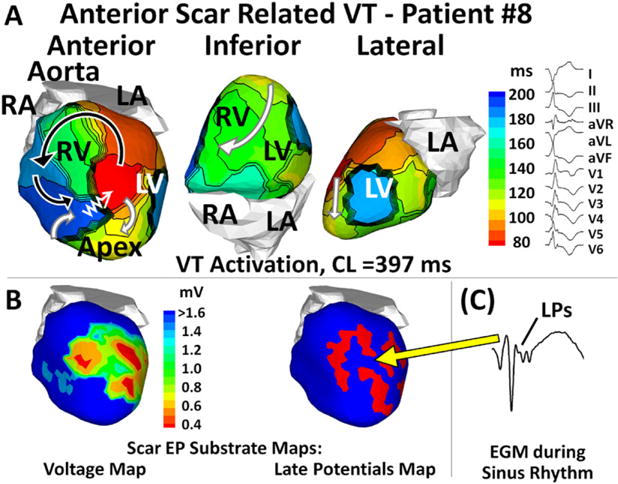
Anterior scar-related VT with a double-loop pattern. (A) VT activation maps in different views. (B) Scar EP substrate maps with relatively preserved voltage (green, left) and late potentials (LPs; red, right). (C) A fractionated EGM with LPs during sinus rhythm (the yellow arrow points to EGM location). In Panel A, zigzag arrows indicate very slow conduction across the scar border to the VT emergence site. Curved arrows indicate propagation of VT wavefront. CL = cycle length; EGM = electrogram; EP = electrophysiology; VT = ventricular tachycardia.
Figure 5 shows an apical scar-related VT (CL = 410 ms) with a single-loop reentry pattern from patient #3 (substrate shown in Fig. 2). Earliest epicardial activation was mapped in the anterior mid-wall near the septum (red). The activation wavefront exited the anterior wall at the beginning of the VT beat, then propagated in a clockwise pattern (white arrows), and reentered the anterior wall to complete one VT cycle (zigzag arrow). Animation of the global VT activation sequences is provided in the Supporting information (Movie 1 for patient #3 and Movie 2 for patient #8).
Figure 5.
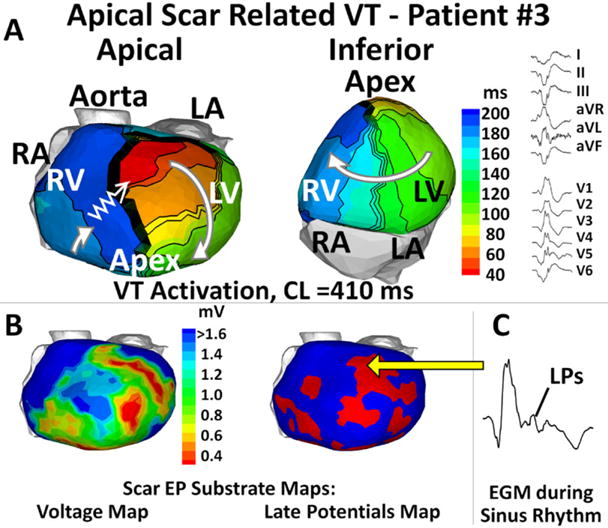
Apical scar-related ventricular tachycardia with a single reentrant loop. Same format as Figure 4.
In both cases, EGMs with low voltage, fractionation, and LPs were recorded during SR at and near the scar segment of the VT reentry circuit (right of bottom panels), reflecting heterogeneous scarring of myocardium. During VT, the crowed isochrones (zigzag arrows) and long delays captured in the activation movies indicated slow conduction through the scar.
Among 17 patients with clinical VT, eight developed ventricular arrhythmia during the ECGI procedure, including nonsustained VT in six patients and frequent premature ventricular contractions (PVCs) in two patients. The VT emergence site (ES) was localized to the DS in two patients, to the PS in five patients, and to a nonscar region in one patient. EGMs at or near the ES showed fractionation and LPs in all eight patients. Only one of the arrhythmias emerged from a region of latest SR activation.
Comparison of EP Substrate Properties between VT Patients and Non-VT Patients
Figure 6 summarizes the differences in the EP substrate between patients with and without VT. When controlled for total epicardial surface area, VT patients had greater proportion of TS (51.0 ± 9.3% vs 36.5 ± 5.4%) and DS (29.5 ± 7.3% vs 16.8 ± 6.8%) than non-VT patients (Panel A). The mean normalized unipolar voltage (Panel B) was significantly lower in VT patients than in non-VT patients within the TS (0.107 ± 0.027 vs 0.153 ± 0.031), the DS (0.073 ± 0.023 vs 0.098 ± 0.026), and the PS (0.158 ± 0.039 vs 0.206 ± 0.054). Fractionated EGMs were observed in every patient. VT patients had higher percentage of fractionated EGMs within the TS (44.1 ± 10.6% vs 26.8 ± 6.3%), the DS (50.8 ± 10.8% vs 30.9 ± 7.0%), and the PS (35.0 ± 13.7% vs 23.5 ± 9.0%), respectively (Panel C). LPs were observed in every patient also. VT patients had higher percentage of EGMs with LPs within the TS (26.8 ± 10.7% vs 15.8 ± 5.3) and the PS (31.8 ± 12.3% vs 17.1 ± 6.4%), respectively (Panel D). The mean value of latest AT did not reach statistical significance (Panel E). Continuous channels with relatively higher voltage (Panel F) were found in all VT patients and 10 non-VT patients. VT patients had more channels per patient (3.1 ± 1.2 vs 1.7 ± 1.2).
Figure 6.

Comparison of the electrophysiologic substrate properties between VT patients (case) and non-VT patients (control). (A) Scar burden (scar size as percentage of total epicardial surface area). (B) Mean normalized unipolar voltage. (C) Percentage of fractionated EGMs. (D) Prevalence of late potentials (LPs). (E) Timing of latest activation detected after completion of global epicardial activation. (F) Number of conducting channels per patient. P < 0.05 is marked with an asterisk. EGM = electrogram; VT = ventricular tachycardia
Global repolarization properties were compared between the groups. No significant differences were found (Table S1).
Discussion
Key findings of this study include: (1) with noninvasive ECGI, the epicardial EP substrate associated with MI was characterized by low-voltage and fractionated EGMs, the presence of LPs, and altered SR activation pattern; (2) by correlating substrate maps with VT activation maps, critical substrate that supported the VT could be identified; (3) repolarization abnormalities were not present in the substrate, indicating that the mechanistic basis for conduction block and VT was structure-based abnormal propagation through the scar substrate; (4) significant differences existed in the EP substrate between VT patients and non-VT patients: VT patients had greater epicardial scar burden, lower voltage in the scar, a higher prevalence of fractionated EGM and LPs, and more conducting channels. These observations explain to a certain extent the role of EP substrate in ventricular arrhythmia and the difference in VT incidence between the groups. Given these findings, the study constitutes a first step toward preprocedural guidance for scar-related VT ablation and noninvasive arrhythmia risk stratification in ICM patients.
Validation of ECGI-Reconstructed Scar EGMs and Removal of Far-Field Effects
In previous studies, ECGI was validated extensively by direct comparison to measured epicardial potentials and EGMs. A list of ECGI validation studies is provided in the Supporting information. In a human-shaped torso tank, with an isolated dog heart placed in the correct anatomical position, epicardial EGMs were reconstructed with high accuracy.10 Specific to this study, ECGI reconstructed accurately the scar EP substrate (its location, extent, and morphology) and low-voltage, fractionated EGMs within a 4-day-old infarct.11 Also, in the same experimental preparation, ECGI was able to map a double-loop epicardial reentry circuit during VT, identifying its central common pathway, lines of block, and regions of slow conduction.12 In post-MI patients, ECGI colocalized the abnormal epicardial EP substrate to the anatomical scar imaged by LGE-MRI or SPECT with a high degree of accuracy (sensitivity 89%, specificity 85%); it also approximated closely the extent and morphology of the epicardial scar13 and determined correctly VT sites of origin, as verified by invasive EP study.14 In Brugada syndrome patients, ECGI reconstructed fractionated EGMs only in the epicardial right ventricular outflow tract,15 consistent with invasive EP mapping.16
Substrate-based mapping and ablation studies have suggested that complete LP abolition is an effective strategy that yields good procedural outcomes.17,18 LPs identify excitable tissue that supports very slow, discontinuous conduction and possibly regions of block. Beyond ablation of the critical isthmus for VT, this approach requires ablation of all substrates that exhibit LPs to achieve scar homogenization. A difficulty with LP mapping is that far-field potentials due to depolarization of myocardial tissue remote from the recording electrode could be the source of some LPs. Because ECGI provides panoramic maps, it can identify far-field deflections in local scar EGMs by matching them with ATs in neighboring EGMs, remote EGMs, or both. This capability for direct detection and exclusion of far-field deflections prevented overestimation of EGM fractionation and improved the accuracy of analysis.
Scar-Related Arrhythmias
Arrhythmic events in eight patients were imaged and analyzed. Although ECGI could not provide very high-resolution maps of local conduction within the scar during VT, the ECGI-mapped VT reentry circuits aligned with the scar EP substrate in a region of relatively preserved voltage, EGM fractionation, and LPs during SR. These data are consistent with the findings from clinical studies: the isthmus of reentry circuits is confined to a region of viable myocardium surrounded by scar tissue, which constitutes the target for VT ablation.19 In seven of eight cases, the ES was located near regions with LPs and low-voltage fractionated EGMs within the scar. In one patient, PVCs were found to emerge from a location with a normal EGM magnitude, but with fractionation and LP deflections. It is possible that this patient had a mild endocardial scar near the PVC site of origin (not detectable by SPECT) and that the ECGI-reconstructed epicardial unipolar EGMs detected diastolic activities from intramural locations. Since the epicardium remained largely viable, the epicardial EGMs yielded normal magnitude but fractionation and LPs. It is noteworthy that the majority of sites critical to reentry exhibited conduction slowing during SR, but only one of them was found in a region of latest SR activation. This observation is consistent with invasive EP studies that suggested that regions with conduction delay during SR may be critical for VT maintenance, and that zones with the most delayed activation during SR may represent bystander sites irrelevant to the VT circuit.20 Additionally, part of the inexcitable DS possibly served as an inert obstacle determinant of the reentry circuit. As shown in Figures 4 and 5, the wavefront propagated around the DS with high curvature after exiting from the ES.
Risk Stratification for VT
The ICD has been prescribed for ICM patients based on low LVEF criteria. However, only about 20% of ICM patients with ICD receive appropriate shocks.21 In a recent study, high-density endocardial mapping collected detailed data from the DS, and was used to compare ICM patients with and without clinical VT.22 VT patients were found to have markedly larger low-voltage zones, higher density of fractionated EGM, and more conducting channels. In this study, using noninvasive ECGI, we compared the epicardial EP substrate between 17 ICM patients with clinical VT and 15 ICM patients without a history of VT after ICD insertion for at least 48 months. Despite the similar characteristics of the two groups, ECGI results revealed that the VT patients had a larger extent of TS and DS substrate and lower voltage in the scar area. Furthermore, the prevalence of EGMs with fractionation and LPs was greater in the VT patients. The results add support to previous findings correlating substrate to VT incidence, and emphasize the fact that the EP substrate for VT may or may not be present in patients with similar LVEF. Not only the extent of the scar, but also its structural components that underlie spatial properties of the EP substrate, are important determinants of VT incidence. The noninvasive nature of ECGI and its demonstrated ability in this study to map the EP substrate of a post-MI scar suggest that it could become a much needed tool for arrhythmic risk stratification and determination of ICD indication in ICM patients. This possibility and potential of ECGI require examination in a large prospective clinical trial.
Limitations
ECGI reconstructs potential maps and unipolar EGMs on the epicardial surface. These provide information not only on the epicardial EP substrate; they reflect properties of the substrate in the myocardial depth as well.10 A previous study demonstrated high correlation of ECGI with MRI and SPECT images of transmural scars.13 Activation isochrone mapping with ECGI is limited to the epicardium. The earliest epicardial activation site during intramural VT (the ES) may not identify precisely the location of an endocardial circuit. However, ECGI was shown to differentiate between epicardial and endocardial initiation sites14 and to provide sufficient detail for determination of an intramural (septal) VT reentry circuit from analysis of epicardial potentials, EGMs, and isochrones.23 A recent study predicted scar transmurality and the presence of LPs in the epicardium based on the extent and density of an endocardial scar, indicating a possible requirement for an epicardial ablation procedure.17 A combined endocardial–epicardial ablation strategy is associated with fewer read-missions for VT and repeat ablations compared to endocardial ablation alone.24
AAD in VT patients could not be altered in this retrospective study. AAD exposure could have potentially affected the EGM amplitude and fractionation. However, success in substrate-based ablation in VT patients on AAD suggests that the differences between VT and non-VT ICM patients are likely due to the nature of the scar EP substrate, rather than artifacts caused by AAD.
The number of patients (32) is relatively small in this study. The analysis was conducted without blinding. Different from clinical randomized trials, the purpose of this study was to characterize the EP scar substrate noninvasively and to relate it to reentry circuits during VT. Additionally, we examined the possibility of using ECGI for VT risk stratification post-MI by characterizing the EP substrate during SR. The reconstructed maps and statistics were processed with automated algorithms, independent of the clinical anatomical scar imaging and patients’ history. This is a pilot study for future ECGI studies with larger patient populations, in which the issues of blinding and small cohort will be addressed.
Conclusions
EP mapping with ECGI can provide high-resolution panoramic maps of epicardial scar EP substrate, which complement endocardial substrate mapping. It also correlates scar-related arrhythmia activation patterns with the scar EP substrate. This study identifies key epicardial EP properties that may account for the difference in VT incidence between VT and non-VT patients with ICM. With larger-scale studies, ECGI has the potential to become a noninvasive clinical tool for preprocedural guidance of substrate-based ablation and for identification of ICM patients at high risk of arrhythmias who require preventative measures such as ICD.
Supplementary Material
Figure S1. Panel (A) shows a unipolar EGM reconstructed in the scar region. It is of low voltage and includes three deflections (squares). The timing of the second deflection matches the activation time of a remote EGM (Panel B, about 2 cm away). Therefore, it was classified as far-field potential and was excluded from fractionation analysis.
Figure S2. Temporal fiducial points on electrograms.
Figure S3. The noninvasive ECGI procedure.
Figure S4. Patient #1: VT patient; inferior myocardial infarction.
Figure S5. Patient #2: VT patient; inferior myocardial infarction.
Figure S6. Patient #3: VT patient; apical myocardial infarction.
Figure S7. Patient #4: VT patient; apical myocardial infarction.
Figure S8. Patient #5: VT patient; apical myocardial infarction.
Figure S9. Patient #6: VT patient; inferior myocardial infarction.
Figure S10. Patient #7: VT patient; inferior and inferolateral myocardial infarction.
Figure S11. Patient #8: VT patient; anterior myocardial infarction.
Figure S12. Patient #9: VT patient; inferior and inferolateral myocardial infarction.
Figure S13. Patient #10: VT patient; inferior and apical myocardial infarction.
Figure S14. Patient #11: VT patient; anterior and apical myocardial infarction.
Figure S15. Patient #12: VT patient; anterior and apical myocardial infarction.
Figure S16. Patient #13: VT patient; anterior, lateral, and inferior myocardial infarction.
Figure S17. Patient #14: VT patient; anterior myocardial infarction.
Figure S18. Patient #15: VT patient; lateral, inferior, and apical myocardial infarction.
Figure S19. Patient #16: VT patient; anterior, and apical myocardial infarction.
Figure S20. Patient #17: VT patient; inferior, and apical myocardial infarction.
Figure S21. Patient #18: Non-VT patient; inferior myocardial infarction.
Figure S22. Patient #19: Non-VT patient; apical, inferior, and inferolateral myocardial infarction.
Figure S23. Patient #20: Non-VT patient; apical and inferior myocardial infarction.
Figure S24. Patient #21: Non-VT patient; inferior myocardial infarction.
Figure S25. Patient #22: Non-VT patient; inferior myocardial infarction.
Figure S26. Patient #23: Non-VT patient; apical and inferior myocardial infarction.
Figure S27. Patient #24: Non-VT patient; apical and inferior myocardial infarction.
Figure S28. Patient #25: Non-VT patient; apical myocardial infarction.
Figure S29. Patient #26: Non-VT patient; inferior myocardial infarction.
Figure S30. Patient #27: Non-VT patient; inferior myocardial infarction.
Figure S31. Patient #28: Non-VT patient; apical myocardial infarction.
Figure S32. Patient #29: Non-VT patient; inferior myocardial infarction.
Figure S33. Patient #30: Non-VT patient; anterior, apical, and inferior myocardial infarction.
Figure S34. Patient #31: Non-VT patient; anterior and apical myocardial infarction.
Figure S35. Patient #32: Non-VT patient; anterior and apical myocardial infarction.
Table S1. Comparison between VT Patients and Non-VT Patients.
Movie 1. The activation sequence during VT for patient #3.
Movie 2. The activation sequence during VT for patient #8.
Acknowledgments
This study was supported by NIH–National Heart, Lung, and Blood Institute grants R01-HL-033343 and R01-HL-049054 (to Dr. Rudy) and by Washington University Institute of Clinical and Translational Sciences grant UL1-TR000448 from the National Center for Advancing Translational Sciences of the NIH. Dr. Rudy is the Fred Saigh Distinguished Professor at Washington University.
Footnotes
Disclosures: Dr. Zhang: none. Dr. Cooper received consultant fees and speaker honoraria from Boston Scientific, St. Jude Medical, Medtronic, and Biotronik. Dr. Desouza received a research award from the American Heart Association. Dr. Cuculich received research support from the National Institutes of Health and March of Dimes. Dr. Woodard received research support from the National Institutes of Health, March of Dimes, Bayer, Astellas, Guerbet, and Biotronik. She also received consultant fees from Medtronic and Biotronik. Dr. Smith: none. Dr. Rudy co-chairs the scientific advisory board, holds equity in and receives royalties from CardioInsight Technologies. CardioInsight Technologies does not support any research conducted in Dr. Rudy’s laboratory.
Supporting Information
Additional Supporting Information may be found in the online version of this article at the publisher’s website:
References
- 1.Janse MJ, Wit AL. Electrophysiological mechanisms of ventricular arrhythmias resulting from myocardial ischemia and infarction. Physiol Rev. 1989;69:1049–1169. doi: 10.1152/physrev.1989.69.4.1049. [DOI] [PubMed] [Google Scholar]
- 2.Ursell PC, Gardner PI, Albala A, Fenoglio J, Wit AL. Structural and electrophysiological changes in the epicardial border zone of canine myocardial infarcts during infarct healing. Circ Res. 1985;56:436–451. doi: 10.1161/01.res.56.3.436. [DOI] [PubMed] [Google Scholar]
- 3.Kléber AG, Rudy Y. Basic mechanisms of cardiac impulse propagation and associated arrhythmias. Physiol Rev. 2004;84:431–488. doi: 10.1152/physrev.00025.2003. [DOI] [PubMed] [Google Scholar]
- 4.Dillon SM, Allessie MA, Ursell PC, Wit AL. Influences of anisotropic tissue structure on reentrant circuits in the epicardial border zone of subacute canine infarcts. Circ Res. 1988;63:182–206. doi: 10.1161/01.res.63.1.182. [DOI] [PubMed] [Google Scholar]
- 5.de Bakker J, van Capelle F, Janse MJ, Tasseron S, Vermeulen JT, de Jonge N, Lahpor JR. Slow conduction in the infarcted human heart. ‘Zigzag’ course of activation. Circulation. 1993;88:915–926. doi: 10.1161/01.cir.88.3.915. [DOI] [PubMed] [Google Scholar]
- 6.Gonska B-D, Cao K, Schaumann A, Dorszewski A, von zur Mühlen F, Kreuzer H. Catheter ablation of ventricular tachycardia in 136 patients with coronary artery disease: results and long-term followup. J Am Coll Cardiol. 1994;24:1506–1514. doi: 10.1016/0735-1097(94)90147-3. [DOI] [PubMed] [Google Scholar]
- 7.Zei PC, Stevenson WG. Epicardial catheter mapping and ablation of ventricular tachycardia. Heart Rhythm. 2006;3:360–363. doi: 10.1016/j.hrthm.2005.10.022. [DOI] [PubMed] [Google Scholar]
- 8.Oza S, Wilber DJ. Substrate-based endocardial ablation of postinfarction ventricular tachycardia. Heart Rhythm. 2006;3:607–609. doi: 10.1016/j.hrthm.2005.11.018. [DOI] [PubMed] [Google Scholar]
- 9.Sosa E, Scanavacca M. Epicardial mapping and ablation techniques to control ventricular tachycardia. J Cardiovasc Electrophysiol. 2005;16:449–452. doi: 10.1046/j.1540-8167.2005.40710.x. [DOI] [PubMed] [Google Scholar]
- 10.Oster HS, Taccardi B, Lux RL, Ershler PR, Rudy Y. Electrocardiographic imaging—Noninvasive characterization of intramural myocardial activation from inverse-reconstructed epicardial potentials and electrograms. Circulation. 1998;97:1496–1507. doi: 10.1161/01.cir.97.15.1496. [DOI] [PubMed] [Google Scholar]
- 11.Burnes JE, Taccardi B, MacLeod RS, Rudy Y. Noninvasive ECG imaging of electrophysiologically abnormal substrates in infarcted hearts: A model study. Circulation. 2000;101:533–540. doi: 10.1161/01.cir.101.5.533. [DOI] [PubMed] [Google Scholar]
- 12.Burnes JE, Taccardi B, Rudy Y. A noninvasive imaging modality for cardiac arrhythmias. Circulation. 2000;102:2152–2158. doi: 10.1161/01.cir.102.17.2152. [DOI] [PMC free article] [PubMed] [Google Scholar]
- 13.Cuculich PS, Zhang J, Wang Y, Desouza KA, Vijayakumar R, Woodard PK, Rudy Y. The electrophysiological cardiac ventricular substrate in patients after myocardial infarction: Noninvasive characterization with electrocardiographic imaging. J Am Coll Cardiol. 2011;58:1893–1902. doi: 10.1016/j.jacc.2011.07.029. [DOI] [PMC free article] [PubMed] [Google Scholar]
- 14.Wang Y, Cuculich PS, Zhang J, Desouza KA, Vijayakumar R, Chen J, Faddis MN, et al. Noninvasive electroanatomic mapping of human ventricular arrhythmias with electrocardiographic imaging. Sci Transl Med. 2011;3:98ra84. doi: 10.1126/scitranslmed.3002152. [DOI] [PMC free article] [PubMed] [Google Scholar]
- 15.Zhang J, Sacher F, Hoffmayer K, O’Hara T, Strom M, Cuculich P, Silva J, et al. Cardiac electrophysiologic substrate underlying the ECG phenotype and electrogram abnormalities in Brugada syndrome patients. Circulation. 2015;131:1950–1959. doi: 10.1161/CIRCULATIONAHA.114.013698. [DOI] [PMC free article] [PubMed] [Google Scholar]
- 16.Nademanee K, Veerakul G, Chandanamattha P, Chaothawee L, Ariyachaipanich A, Jirasirirojanakorn K, Likittanasombat K, et al. Prevention of ventricular fibrillation episodes in Brugada syndrome by catheter ablation over the anterior right ventricular outflow tract epicardium. Circulation. 2011;123:1270–1279. doi: 10.1161/CIRCULATIONAHA.110.972612. [DOI] [PubMed] [Google Scholar]
- 17.Tsiachris D, Silberbauer J, Maccabelli G, Oloriz T, Baratto F, Mizuno H, Bisceglia C, et al. Electroanatomical voltage and morphology characteristics in post-infarction patients undergoing ventricular tachycardia ablation: A pragmatic approach favoring late potentials abolition. Circ Arrhythm Electrophysiol. 2015;8:863–873. doi: 10.1161/CIRCEP.114.002551. [DOI] [PubMed] [Google Scholar]
- 18.Jais P, Maury P, Khairy P, Sacher F, Nault I, Komatsu Y, Hocini M, et al. Elimination of local abnormal ventricular activities: A new end point for substrate modification in patients with scar-related ventricular tachycardia. Circulation. 2012;125:2184–2196. doi: 10.1161/CIRCULATIONAHA.111.043216. [DOI] [PubMed] [Google Scholar]
- 19.Harada T, Stevenson WG, Kocovic DZ, Friedman PL. Catheter ablation of ventricular tachycardia after myocardial infarction: Relation of endocardial sinus rhythm late potentials to the reentry circuit. J Am Coll Cardiol. 1997;30:1015–1023. doi: 10.1016/s0735-1097(97)00257-x. [DOI] [PubMed] [Google Scholar]
- 20.Irie T, Yu R, Bradfield JS, Vaseghi M, Buch EF, Ajijola O, Macias C, et al. Relationship between sinus rhythm late activation zones and critical sites for scar-related ventricular tachycardia: A systematic analysis of isochronal late activation mapping. Circ Arrhythm Electrophysiol. 2015;8:390–399. doi: 10.1161/CIRCEP.114.002637. [DOI] [PMC free article] [PubMed] [Google Scholar]
- 21.Moss AJ, Zareba W, Hall WJ, Klein H, Wilber DJ, Cannom DS, Daubert JP, et al. Prophylactic implantation of a defibrillator in patients with myocardial infarction and reduced ejection fraction. N Engl J Med. 2002;346:877–883. doi: 10.1056/NEJMoa013474. [DOI] [PubMed] [Google Scholar]
- 22.Haqqani HM, Kalman JM, Roberts-Thomson KC, Balasubramaniam RN, Rosso R, Snowdon RL, Sparks PB, et al. Fundamental differences in electrophysiologic and electroanatomic substrate between ischemic cardiomyopathy patients with and without clinical ventricular tachycardia. J Am Coll Cardiol. 2009;54:166–173. doi: 10.1016/j.jacc.2009.04.024. [DOI] [PubMed] [Google Scholar]
- 23.Burnes JE, Taccardi B, Ershler PR, Rudy Y. Noninvasive electrocardiogram imaging of substrate and intramural ventricular tachycardia in infarcted hearts. J Am Coll Cardiol. 2001;38:2071–2078. doi: 10.1016/s0735-1097(01)01653-9. [DOI] [PMC free article] [PubMed] [Google Scholar]
- 24.Izquierdo M, Sanchez-Gomez JM, Loma-Osorio AFd, Martínez A, Bellver A, Pelaez A, Núñez J, et al. Endo-epicardial versus only-endocardial ablation as a first line strategy for the treatment of ventricular tachycardia in patients with ischemic heart disease. Circ Arrhythm Electrophysiol. 2015;8:882–889. doi: 10.1161/CIRCEP.115.002827. [DOI] [PubMed] [Google Scholar]
Associated Data
This section collects any data citations, data availability statements, or supplementary materials included in this article.
Supplementary Materials
Figure S1. Panel (A) shows a unipolar EGM reconstructed in the scar region. It is of low voltage and includes three deflections (squares). The timing of the second deflection matches the activation time of a remote EGM (Panel B, about 2 cm away). Therefore, it was classified as far-field potential and was excluded from fractionation analysis.
Figure S2. Temporal fiducial points on electrograms.
Figure S3. The noninvasive ECGI procedure.
Figure S4. Patient #1: VT patient; inferior myocardial infarction.
Figure S5. Patient #2: VT patient; inferior myocardial infarction.
Figure S6. Patient #3: VT patient; apical myocardial infarction.
Figure S7. Patient #4: VT patient; apical myocardial infarction.
Figure S8. Patient #5: VT patient; apical myocardial infarction.
Figure S9. Patient #6: VT patient; inferior myocardial infarction.
Figure S10. Patient #7: VT patient; inferior and inferolateral myocardial infarction.
Figure S11. Patient #8: VT patient; anterior myocardial infarction.
Figure S12. Patient #9: VT patient; inferior and inferolateral myocardial infarction.
Figure S13. Patient #10: VT patient; inferior and apical myocardial infarction.
Figure S14. Patient #11: VT patient; anterior and apical myocardial infarction.
Figure S15. Patient #12: VT patient; anterior and apical myocardial infarction.
Figure S16. Patient #13: VT patient; anterior, lateral, and inferior myocardial infarction.
Figure S17. Patient #14: VT patient; anterior myocardial infarction.
Figure S18. Patient #15: VT patient; lateral, inferior, and apical myocardial infarction.
Figure S19. Patient #16: VT patient; anterior, and apical myocardial infarction.
Figure S20. Patient #17: VT patient; inferior, and apical myocardial infarction.
Figure S21. Patient #18: Non-VT patient; inferior myocardial infarction.
Figure S22. Patient #19: Non-VT patient; apical, inferior, and inferolateral myocardial infarction.
Figure S23. Patient #20: Non-VT patient; apical and inferior myocardial infarction.
Figure S24. Patient #21: Non-VT patient; inferior myocardial infarction.
Figure S25. Patient #22: Non-VT patient; inferior myocardial infarction.
Figure S26. Patient #23: Non-VT patient; apical and inferior myocardial infarction.
Figure S27. Patient #24: Non-VT patient; apical and inferior myocardial infarction.
Figure S28. Patient #25: Non-VT patient; apical myocardial infarction.
Figure S29. Patient #26: Non-VT patient; inferior myocardial infarction.
Figure S30. Patient #27: Non-VT patient; inferior myocardial infarction.
Figure S31. Patient #28: Non-VT patient; apical myocardial infarction.
Figure S32. Patient #29: Non-VT patient; inferior myocardial infarction.
Figure S33. Patient #30: Non-VT patient; anterior, apical, and inferior myocardial infarction.
Figure S34. Patient #31: Non-VT patient; anterior and apical myocardial infarction.
Figure S35. Patient #32: Non-VT patient; anterior and apical myocardial infarction.
Table S1. Comparison between VT Patients and Non-VT Patients.
Movie 1. The activation sequence during VT for patient #3.
Movie 2. The activation sequence during VT for patient #8.