Abstract
Bioelectrical impedance analysis (BIA) is a noninvasive and commonly used method for the assessment of body composition including body water. We designed a small, portable and wireless multi-frequency impedance spectrometer based on the 12 bit impedance network analyzer AD5933 and a precision wide-band constant current source for tetrapolar whole body impedance measurements. The impedance spectrometer communicates via Bluetooth with mobile devices (smart phone or tablet computer) that provide user interface for patient management and data visualization. The export of patient measurement results into a clinical research database facilitates the aggregation of bioelectrical impedance analysis and biolectrical impedance vector analysis (BIVA) data across multiple subjects and/or studies. The performance of the spectrometer was evaluated using a passive tissue equivalent circuit model as well as a comparison of body composition changes assessed with bioelectrical impedance and dual-energy X-ray absorptiometry (DXA) in healthy volunteers. Our results show an absolute error of 1% for resistance and 5% for reactance measurements in the frequency range of 3kHz to 150kHz. A linear regression of BIA and DXA fat mass estimations showed a strong correlation (r2=0.985) between measures with a maximum absolute error of 6.5%. The simplicity of BIA measurements, a cost effective design and the simple visual representation of impedance data enables patients to compare and determine body composition during the time course of a specific treatment plan in a clinical or home environment.
1 Introduction
Over the past decade advances in sensors and mobile device technologies offer high quality signals, advanced computing, compact form factors and wireless networking capabilities at low cost, facilitating monitoring of physiological signals for diagnostics and therapeutic interventions.
Undernutrition is a prevalent syndrome generally in elderly and children especially in developing countries [1]. Although undernutrition can be assessed using anthropometric measures, such as changes in weight or body mass index, waist circumferences, waist-to-hip ratio, mid-arm circumference, or skin fold thickness, they are often difficult to interpret in clinical practice due to a lack of reference data for specific populations or ethnic groups. Anthropometric measurements are simple and inexpensive procedures but a large variety of reliability among studies was found [2].
Anthropometric measurements are commonly used as proxy measures for body composition assessment in clinical practice. In recent decades, computer tomography, magnetic resonance imaging, and dual-energy X-ray absorptiometry (DXA) have been developed as new clinical standards to assess body composition [3]. While DXA has increasingly been used as a reference standard to estimate body composition [3, 4], these methods require costly clinical environments, well trained medical personnel and are not applicable for frequent ambulatory monitoring of children or elderly in their natural living environment.
Bioelectrical impedance analysis (BIA) is a noninvasive, safe, inexpensive and portable technique for rapid assessment of body composition and body water that requires minimal patient collaboration. A detailed review of the technology has been published recently by Lukaski et al.[5].
BIA measures the voltage and phase angle of a signal generated by injecting a small sinusoidal electrical current at a single or multiple frequencies into the body, typically from hand-to-foot and computes the complex impedance values, with the real part of the impedance representing resistance (R) and imaginary part the reactance (Xc). It is well known that the volume of a homogeneous conductor with uniform cross-section can be computed based on its length, specific conductance and resistance. Although the human body is not an object with uniform cross-sectional area or constant conductivity, semi-empirical relationships between impedance, height and body mass have been established [6]. These predictive equations are often obtained from linear regression analysis using cross-validated DXA and body composition data obtained from specific populations in which they are valid [7]. Using this approach Kyle et al. derived a set of equations to estimate the fat-free mass (FFM) from BIA measurements with a correlation of r=0.986 compared to DXA in 343 healthy subjects aged 20–94 [8].
Multi-frequency analysis is used to determine extracellular (ECW) and intracellular water (ICW) based on a simple model of a purely capacitive membrane separating a resistive intra- and extracellular space. Therefore ECW can be estimated from the impedance at low frequency and total body water (TBW) from the real component of the impedance at high frequency where the capacitive effect of the cell membrane can be neglected [9]. ICW can be calculated from the difference between TBW and ECW.
In contrast to BIA, bioelectrical impedance vector analysis (BIVA) does not require any assumption about body geometry, electrical tissue models or regression analysis [10]. In the BIVA representation body composition is described as a vector with resistance (R) as the abscissa, and reactance (Xc) as the ordinate, normalized by the subjects height (H). The individual BIVA vectors are quite often displayed with the bivariate ellipsoidal 95th, 75th and 50th percentile confidence intervals (tolerance ellipse) of a normal healthy reference population in a two dimensional coordinate system with abscissa R/H (Ω/m) and ordinate Xc/H (Ω/m). Bosy-Westphal et al. published reference BIVA standards of vector distributions according to sex, BMI and age in large populations of white children, adolescents and adults [11].
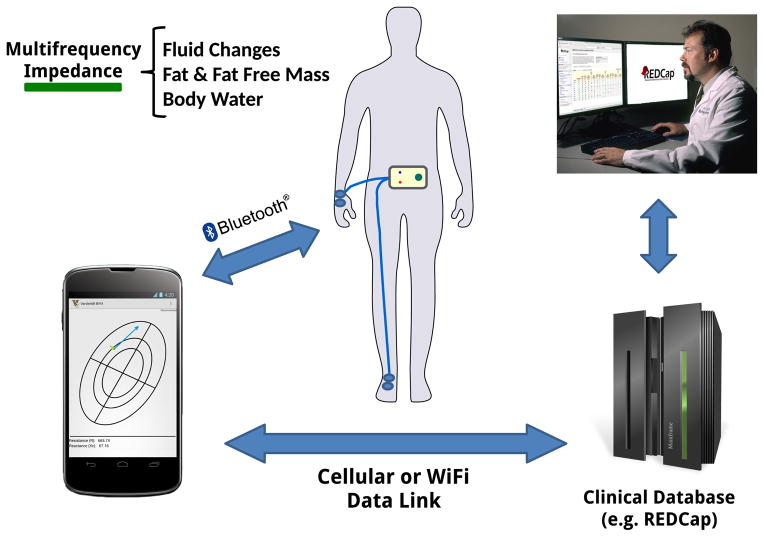
With the introduction of smart phones, new mobile applications are developed to aid in health management and offer guidance for a better healthy living. Professional caretakers are using smart phones frequently in making decisions to improve the outcomes of clinical care [12]. The integration with smart mobile devices offer ubiquitous network access that provides a path for data synchronization with a centralized database and facilitates immediate feedback from health care providers for longitudinal monitoring, guidance and intervention in a clinical or home environment (Fig. 1).
Figure 1.
Concept of smart multi-frequency impedance spectrometer tethered to a smart phone and data transfer to a data server to facilitate immediate feedback from health care provider or aggregation of impedance measurements across multiple studies in a clinical database.
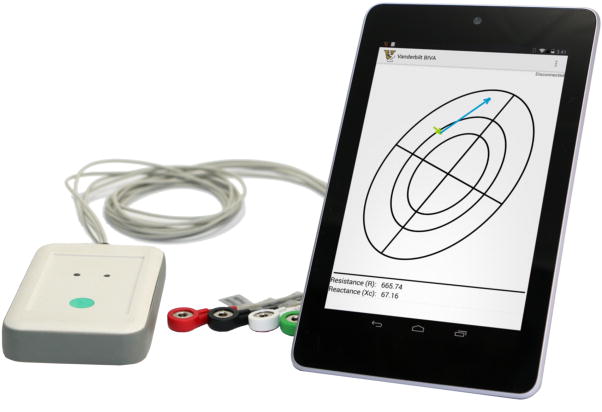
To achieve a wider use of BIA/BIVA applications we developed a portable, low cost, battery operated and rugged multi-frequency impedance spectrometer. The spectrometer is tethered wirelessly to a smart phone or tablet computer and runs BIA and BIVA graphical applications to promote the use of BIA technology by patients and health care providers with limited training (Fig. 2).
Figure 2.
Wireless multi-frequency impedance spectrometer (left) used for bioelectrical impedance vector analysis (BIVA) in a rugged dust and water protected (IP 54) enclosure and snap on lead wires for easy and robust electrode attachment. Mobile application running on Nexus 7 tablet computer (right) that displays multiple BIVA measurements and allows for tracking of patient progress, patient management and data export.
2 Hardware
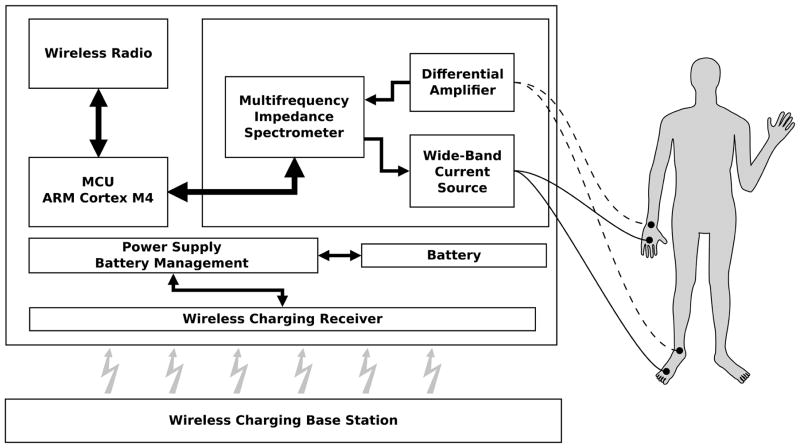
The platform consists of an ARM cortex-M4 microprocessor (STM32F415, STMicroelectronics). The cortex-M4 was selected since it offers a good balance between power consumption and computational power. Further, the integration of a floating point unit and limited DSP instruction set creates a powerful controller for bioelectrical impedance measurements and signal processing (Fig. 3).
Figure 3.
Simplified block diagram of wireless multi-frequency impedance spectrometer and standard BIA electrode placement on hand/wrist and foot/ankle.
The hardware is placed in a dust- and water-protected (IP54) enclosure (OKW Enclosures Inc., USA) to ensure proper device functionality in harsh environments (Fig. 2). The integration of wireless charging provides patient safety while maintaining low circuit complexity and improved ruggedness of the spectrometer due to the galvanic discontent between the charging device and mains. The only wires leading into the enclosure are the patient lead wires which can be sealed hermetically.
Communication to the mobile device is established via a Bluethooth v2.1 connection and allows for the setting of measurement parameters, like excitation amplitude, start and stop frequency and frequency increment. Upon completion of the measurement sequence the recorded impedance for each frequency is transferred to the mobile device. At all times it is ensured that the measurement parameters are within functional and safe limits by the spectrometer firmware.
2.1 Analog Front-End
The analog front-end is built around a high precision digital impedance network analyzer AD5933 from Analog Devices. The AD5933 is a fully integrated impedance analyzer with a build in frequency generator that allows for the determination of an impedance over a wide range of selectable frequencies. A 12-bit analog to digital converter (ADC) samples the input signal at a rate of 1MSPS and an integrated DSP applies a discrete Fourier transformation (DFT) to the digitized input signal and returns real and imaginary components. These features combined with the ease of programming via I2C bus makes the AD5933 an excellent component for a smart bioelectrical impedance analyzer.
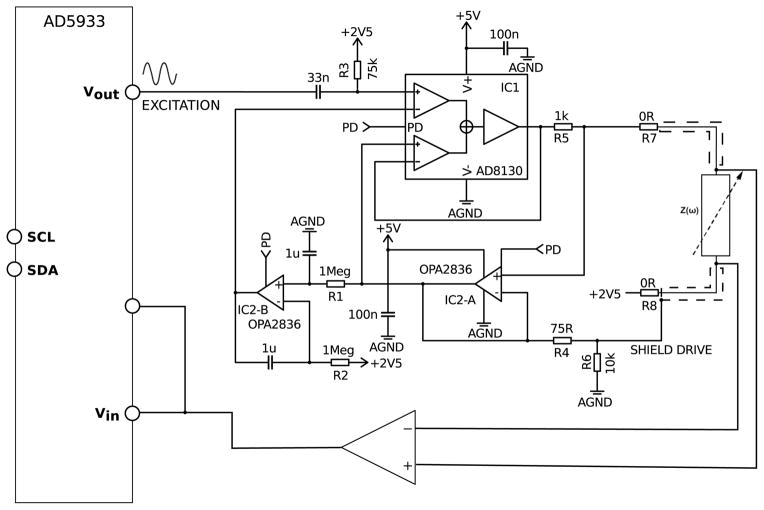
A precision wide-band constant current source was designed to overcome output impedance limitations and to allow for precise tetrapolar impedance measurements. The complete circuit diagram is shown in Fig. 4. Most instrumentation amplifier based constant current sources provide relatively high output impedance and high common mode rejection ratio (CMRR) at lower frequencies. However bandwidth, slew rate and CMRR limitations make them an inadequate choice for precision high frequency constant current sources. The differential receiver amplifier AD8130 from Analog Devices offers high CMRR (80dB @ 2MHz) at high frequencies and has been successfully used for bioelectrical impedance measurements [13, 14].
Figure 4.
Analog front-end of the bioelectrical impedance spectrometer including precision wide-band constant current source using the differential receiver amplifier AD8130 that allows for tetrapolar impedance measurements, high output impedance and high CMRR. The front-end can be disabled when not in use through a power down signal (PD) to reduce the overall power consumption of the spectrometer.
This amplifier has a comparatively high input bias current of maximal ±3.5μA. This poses a problem since it affects the output current for small excitation signals and prevents accurate impedance measurements. However this can be overcome by adding a unity gain amplifier (Fig. 4, IC2-A, OPA2836) into the feedback path. Furthermore to allow for single supply operation of the current source as well as for purely capacitive or ac coupled loads a dc stabilization loop (Fig. 4, IC2-B, OPA2836) was introduced. The cut-off frequency of the dc stabilization loop was chosen small enough (below 0.5Hz) to have a negligible effect on bioelectrical impedance measurements.
To achieve a fully bipolar current source the output can be ac coupled by replacing resistors R7 and R8 with suitable coupling capacitors. The maximum possible output current with this design is limited by the maximum output voltage swing of IC1 and current sense resistor R5 to 1.7mARMS.
3 Software
The mobile application was developed using Android operating system (Google & Open Handset Alliance, Ice Cream Sandwich, API level 14) and provides management of patient record, archiving of data, impedance spectrometer device controls and visualization of BIA/BIVA measurements.
Patient record and anthropomorphic data for each visit are saved in conjunction which each BIVA measurement in a relational database. Hence, the health care provider and patient can track the patient’s performance over a prolonged period for early diagnosis or adjustments to treatment plans.
BIVA measurements are displayed in confidence ellipses that are specific for a certain reference populations which are based on the work of Picolli et. al. [15, 16], (Fig. 2).
An export into a Research Electronic Data Capture (REDcap) [17] database allows for the aggregation of measurements across multiple devices and studies and allows for monitoring larger patient groups at multiple locations or the creation of new reference population data sets.
An integrated software update mechanism ensures that devices run the most recent mobile application such that the hardware does not need to be recalled and the operator benefits from new features, such as updated reference population database or different protocols and algorithms to determine body composition.
4 Hardware Validation
4.1 Hardware Performance Evaluation
To evaluate the performance of the bioelectrical impedance spectrometer we used a tissue equivalent model with 2 resistors representing the extra- and intracellular space and 1 capacitor representing the cell membrane [9]. The resistor and capacitor values were determined by fitting whole body impedance values at different frequencies to the equivalent circuit model. The impedance data for the model corresponds to a healthy 20–35 year old male adult. The model values obtained are a resistance R1=549Ω (extracellular) in parallel with a series combination of capacitance C=2.2nF and a resistance R2=1098Ω (intracellular). All utilized resistors had tolerances of 0.1% and 1% for the capacitor. Prior the performance evaluation the spectrometer output was calibrated in the frequency range of 1kHz to 300kHz with 1kHz increments using a 500Ω, 0.01% calibration resistor.
Measurements from the multi-frequency impedance spectrometer were validated using the tissue equivalent model at 22 different frequencies between 1kHz and 300kHz. The upper frequency limit was chosen higher than the recommended maximum of AD5933 (100kHz) to fully evaluate the limitations of this impedance spectrometer. A measurement consists of data obtained at 22 frequencies and after each measurement the lead wires were repositioned to account for capacitive coupling between leads. Based on 20 measurements we computed mean, percentage error and standard deviation. Furthermore, during each measurement we fitted impedance values in the frequency range between 3kHz and 150kHz to a circular impedance locus using a least mean square estimator and determined the Cole parameters,, α and τ [18, 19]. Using these Cole parameters, impedance values and errors were determined for each measurement over an extended frequency range from 1kHz to 3MHz.
4.2 Body Composition
We conducted a study where 9 healthy volunteers with median age 53 (lower-upper quartile: 36.8 – 70.3) years underwent DXA. DXA, impedance measurements, weight and height were taken the same day. Body height was measured within 0.5cm using a calibrated wall-mounted stadiometer (Perspective Enterprises, Portage, MI). Body weight was measured within 0.1kg using a calibrated beam platform scale (Detecto-Medic, Detecto Scales, Inc, Northbrook, IL) with participants wearing light clothing and no shoes. The scans were completed with a whole body DXA (Lunar Prodigy; GE Medical Systems, Madison, WI, USA) in supine position and body composition (fat and fat-free mass) was calculated using manufacturer provided software. Directly after the DXA scan without any change in position whole body impedance was measured. Based on the impedance values at 50kHz the subjects fat free mass (FFM)(1) and fat mass (FM)(2) was estimated using an empirical prediction algorithm proposed by Kyle et al. [8]. The measurements were performed using Ag/AgCl gel electrodes (3M, Red Dot Monitoring Electrode) and standard tetrapolar electrode placement on the back of the patient’s hand and foot [20]. The sensing electrodes were placed at the levels of the prominent bones on the dorsal face of the wrist and ankle. The current injecting electrodes were placed 5 cm distal from the sensing electrodes. The preparation and cleaning of the skin with alcohol, the use of pre-gelled electrodes, and standard placement at well defined anatomical points minimizes the error introduced by variances in electrode position and electrode-skin interface impedance [20–22].
| (1) |
| (2) |
To characterize the relationship between impedance based and DXA fat mass estimates, we used a simple linear regression model, means and differences.
4.3 Body Water Changes
Body water is important for cell and circulatory body functions, it’s maintenance and control is critical in renal failure patients, heart failure patients and patients with hypertension. Salt and volume regulation are closely related and are affected by salt intake and water consumption [23]. Impedance techniques could be used to monitor body water retention during diuresis or low salt diets.
To determine changes in the ECW and ICW during different amounts of daily sodium intake, we obtained data from one healthy female (39 years, 163cm height, 71kg weight) on a low (LS, 10 mE Na+ per day), normal (60 mE Na+ per day), and high sodium diet (300 mE Na+ per day). After 6 days on each diet, impedance measurements were taken at the same anatomical position of left wrist and left ankle in supine position in the morning after an overnight fast.
TBW and ECW at 100kHz and 5kHz were calculated based on the semi empirical formulas obtained by Deurenberg et al. through regression analysis [24](3,4).
| (3) |
| (4) |
These formulas are based on the fact that the injected current at lower frequencies is unable to couple effectively across the capacitive cell membrane. This has the implication that body impedance measured at low frequency is mostly affected by the extracellular water. For higher frequencies the cell membrane couples more efficiently and intracellular currents lead to a larger contribution of the intracellular resistance. Hence, the body impedance at high frequencies is dominated by a parallel configuration of intra- and extracellular resistance [25, 26]. This concludes that impedance measurements at different frequencies can be used as a proxy for total body, intra- and extracellular water.
All applicable institutional and governmental regulations concerning the ethical use of human volunteers were followed during these studies, in accordance with the ethical principles of the Helsinki-II Declaration. All participants signed an informed consent document approved by the Vanderbilt University Institutional Review Board.
5 Results
5.1 Hardware Performance Evaluation
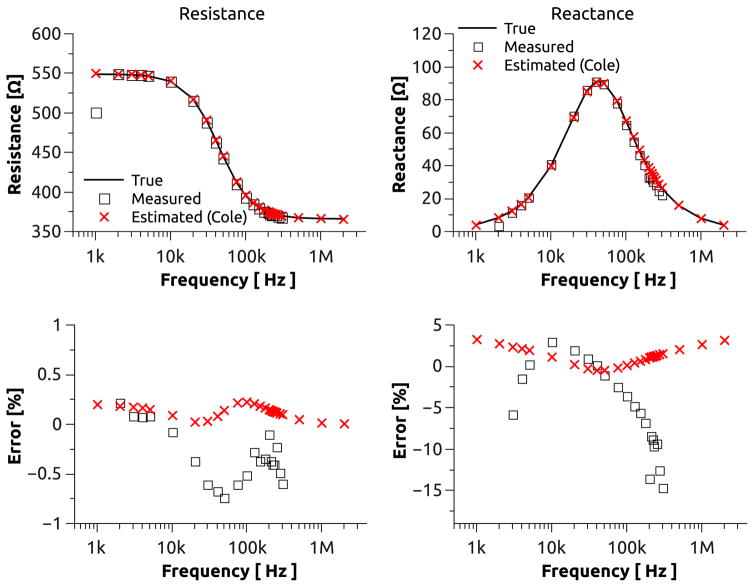
The mean resistance and reactance values at different frequencies obtained from our tissue equivalent model are plotted in Fig. 5. Resistance measurements show a nearly constant error of less than ±1% across the frequency range from 3kHz to 300kHz. Further, the resistance exhibits a standard deviation of 0.01% for frequencies between 3kHz and 175kHz and approaches 0.017% at high frequencies. The reactance measurements exhibit a slightly larger error of ±5% in the frequency range between 4kHz and 150kHz which significantly increases at low and high frequencies and has a maximum of −15% at 300kHz. The standard deviation of the reactance closely follows those of the resistance measurements up to a frequency of 100kHz but increases nearly 10 fold toward both ends of the spectrum. The impedance spectrometer did not produce reliable impedance measurements for frequencies of 1kHz and 2kHz.
Figure 5.
BIA measurements with a tissue equivalent circuit model measured at multiple frequencies (square) compared to impedance estimations based on the Cole model (cross) using BIA measurements between 3kHz and 150kHz. Absolute resistance and reactance over frequency (top). Absolute error of measurement with respect to true resistance (bottom-left) and true reactance (bottom-right). Values for 1kHz and 2kHz partially omitted due to significant measurement error.
The resistance values derived from the Cole estimation exhibit a maximum error and standard deviation of ±0.2% and 0.06%, respectively, over the extended frequency range from 1kHz to 3MHz. For the reactance estimation, the error (standard deviation) exhibits a minimum of 0.4% (0.08%) at 50kHz but increases to a maximum of 3.5% (1%) at 1kHz and 3MHz.
5.2 Body Composition
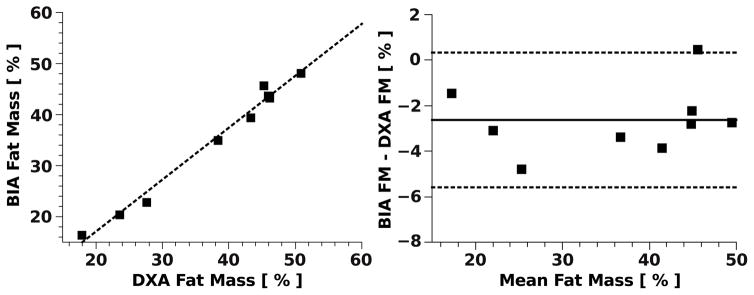
We compared body FM estimation using BIA and DXA. The results indicate that there is a strong correlation (r2=0.985) between the measures (Fig. 6). The null hypothesis of the slope equal zero was rejected with a p-value of less than 0.0001. The largest deviation of the FM from the reference standard was 4.8% which corresponds to an absolute error of 6.5% with respect to the subjects total body weight. Further for the majority of the measurements (8 out of 9) the BIA estimation showed a tendency to underestimate FM compared to DXA measurement in this subject group with a mean (median) bias of 2.62% (2.79%).
Figure 6.
Comparison of body fat mass estimation in 9 subjects via bioelectrical impedance spectrometer (BIA) and dual-energy X-ray absorptiometry (DXA) (left). Bland-Altman plot (right) with mean difference (solid line) and 95% limit of agreement (dashed lines).
5.3 Body Water Changes
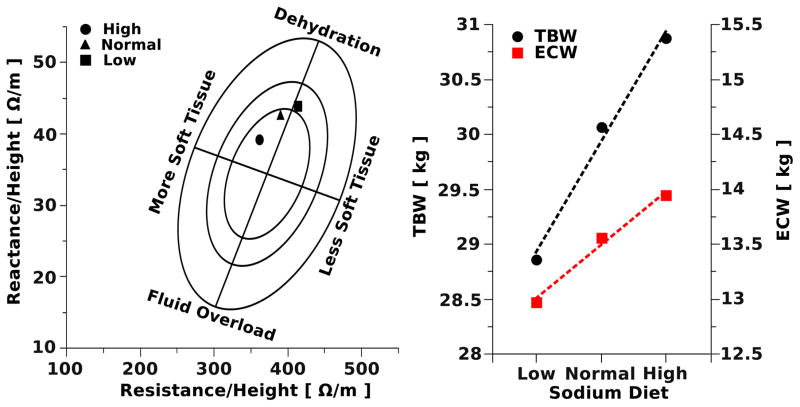
Fig. 7 shows changes of impedance and reactance (Fig. 7-left) and estimation of TBW and ECW using multi-frequency impedance (Fig. 7-right) during low, normal, and high sodium diet in a healthy subject. The results demonstrate that increasing sodium load causes impedance and reactance changes towards the direction of more hydration in the BIVA graphical representation. Further the estimates of ECW and TBW increased with increasing sodium load as expected.
Figure 7.
BIVA with RXc graph of a female subject fed diets with low, normal and high sodium content (left). The population specific bivariate tolerance intervals are displayed as tolerance ellipses (95%, 75% and 50%). The reference population used for the tolerance ellipses was based on healthy Caucasian females (n=372, age 16–84yr) [27]. Estimation of TBW and ECW of the same subject (right) determined by using multiple frequencies, 100kHz for TBW and 5kHz for ECW. Estimation based on BIA equations reported by Deurenberg et al. [24]
6 Discussion
Utilizing an integrated programmable impedance network analyzer allows for a simple and low cost circuit design to measure the impedance over a range of frequencies particularly suited for BIA assessments. The multi-frequency impedance spectrometer shows a significant higher error at low frequencies. This is an expected behavior of the AD5933 since the integrated circuit is driven with a 16MHz system clock, which results in a 1MSPS sampling rate. Therefore, the period of an input signal at low frequencies is not fully captured by the 1024 point DFT and spectral leakage becomes a significant source of errors. If necessary the lower frequency limit can be reduced by scaling the system clock frequency. However, this will directly impact the sampling frequency of the ADC and therefore significantly limits it’s measurable frequency range and use for BIA applications.
The AD5933’s internal low pass filtering (fc~100kHz), before analog to digital conversion, restricts the upper frequency limit of this impedance spectrometer [28]. Therefore, it is expected that the measurement error will increase above 100kHz due to the reduced sensitivity. Our measurements have shown that accuracy for resistance measurements stay below ±1% for a frequency range of 3kHz–300kHz and ±5% (3kHz to 150kHz) for reactance measurements. Hence, the suitable frequency range for this impedance spectrometer with respect to BIA/BIVA application is 3kHz to 150kHz. Measurements outside this range raised some controversy about the effectiveness of impedance measurements to determine body composition due to limited reproducibility [6, 29] and effects of electrode mismatches at these frequencies [30].
These hardware limitations can be overcome by utilizing a least mean square approximation of multiple impedance measurements at different frequencies to a tissue equivalent circuit model. Using this estimation the error for the resistance and reactance determinations could be reduced to less than 0.2% and 4% respectively at high and low frequencies over an extended frequency range from 1kHz to 3MHz. The algorithm is sufficiently simple to be implemented directly on the microcontroller for real-time estimation of and.
There is an extensive body of literature showing that anthropometric measures do not provide accurate information about body fat in all populations, especially in children, elderly and athletes [31–33]. Although, we did not validate the device in children and athletes, we have shown that our impedance spectrometer estimates FM in healthy humans adults, median age 53 years, with a regression coefficient of r2=0.985 and 6.5% maximum error compared to DXA measurements.
We also showed that our device can be used to track body water changes during different dietary interventions. The BIVA graphical presentation allows for a simple tracking of body water content and/or body water composition in patients at the clinical or home setting. Utilizing a tissue equivalent model and least mean square approximation, we demonstrated an extension of our measurement range, which we hypothesize will lead to a more accurate determination of TBW, and ECW.
It has been shown that BIA can be a valuable tool for determining a subject’s body composition within specific patient groups [1, 34, 35]. Some studies demonstrated that BIA has limitations for assessing body composition [36] due to utilizing compartmental models and regression analysis derived for specific patient populations, which can’t be generalized [35]. In contrast, our device can be customized for various patient groups and populations leading to a more accurate estimation of body composition. The main advantage of our current solution, compared to other BIA/BIVA devices commercially available, is cost effectiveness, ruggedness and integration into a centralized data management infrastructure. The tight integration of software with hardware allows for “on-the-fly” customization. Therefore, we can implement new and group-specific algorithms for determining body composition or tracking of nutritional status and body water for each individual patient not only in the clinical setting but also at home. The implementation of server data link can provide an immediate feedback to the patients and/or health care provider.
7 Conclusion
The presented smart multi-frequency bioelectrical impedance spectrometer for BIA and BIVA applications is able to track nutritional and hydration status in healthy subjects and patients. The simplicity of BIA/BIVA measurements and the simple visual representation of impedance data enables patients to compare and determine body composition during the time course of a specific treatment plan. Hence, patients may be actively engaged in their health and take responsibility leading to a higher adherence to the treatment plan, early diagnosis and be proactive for their health.
Acknowledgments
The authors would like to thank Satish R. Raj, Emily Garland, Bonnie Black, Suzanna Lonce and Regina N. Tyree for their assistance and support of the clinical DXA and sodium studies.
Footnotes
FINANCIAL DISCLOSURE
Research reported in this publication was in part supported by the Bill & Melinda Gates Foundation Grand Challenges Explorations Grant Nr. OPP1070008 and National Institutes of Health under Award Number 2P01HL056693-16, R01HL102387 and UL1TR000445.
References
- 1.Camina Martín MA, de Mateo Silleras B, Redondo del Río MP. Body composition analysis in older adults with dementia. Anthropometry and bioelectrical impedance analysis: a critical review. Eur J Clin Nutr. 2014 Nov;68(11):1228–1233. doi: 10.1038/ejcn.2014.168. [DOI] [PubMed] [Google Scholar]
- 2.Ulijaszek SJ, Kerr DA. Anthropometric measurement error and the assessment of nutritional status. Br J Nutr. 1999 Sep;82(03):165–177. doi: 10.1017/s0007114599001348. [DOI] [PubMed] [Google Scholar]
- 3.Andreoli A, Scalzo G, Masala S, Tarantino U, Guglielmi G. Body composition assessment by dual-energy X-ray absorptiometry (DXA) Radiol med. 2009 Mar;114(2):286–300. doi: 10.1007/s11547-009-0369-7. [DOI] [PubMed] [Google Scholar]
- 4.Pietrobelli A, Wang Z, Formica C, Heymsfield SB. Dual-energy X-ray absorptiometry: fat estimation errors due to variation in soft tissue hydration. Am J Physiol - Endocrinol Metab. 1998 May;274(5):E808–E816. doi: 10.1152/ajpendo.1998.274.5.E808. [DOI] [PubMed] [Google Scholar]
- 5.Lukaski HC. Evolution of bioimpedance: a circuitous journey from estimation of physiological function to assessment of body composition and a return to clinical research. Eur J Clin Nutr. 2013 Jan;67(S1):S2–S9. doi: 10.1038/ejcn.2012.149. [DOI] [PubMed] [Google Scholar]
- 6.Kyle UG, Bosaeus I, De Lorenzo AD, Deurenberg P, Elia M, Gómez JM, Heitmann BL, Kent-Smith L, Melchior JC, Pirlich M, Scharfetter H, Schols AM, Pichard C. Bioelectrical impedance analysis—part I: review of principles and methods. Clinical Nutrition. 2004 Oct;23(5):1226–1243. doi: 10.1016/j.clnu.2004.06.004. [DOI] [PubMed] [Google Scholar]
- 7.Brownbill RA, Ilich JZ. Measuring body composition in overweight individuals by dual energy x-ray absorptiometry. BMC Med Imaging. 2005 Mar;5(1):1. doi: 10.1186/1471-2342-5-1. [DOI] [PMC free article] [PubMed] [Google Scholar]
- 8.Kyle UG, Genton L, Karsegard L, Slosman DO, Pichard C. Single prediction equation for bioelectrical impedance analysis in adults aged 20–94 years. Nutrition. 2001 Mar;17(3):248–253. doi: 10.1016/s0899-9007(00)00553-0. [DOI] [PubMed] [Google Scholar]
- 9.Cole KS. Membranes, Ions, and Impulses: A Chapter of Classical Biophysics. University of California Press; 1968. [Google Scholar]
- 10.Piccoli A, Rossi B, Pillon L, Bucciante G. A new method for monitoring body fluid variation by bioimpedance analysis: The RXc graph. Kidney Int. 1994 Aug;46(2):534–539. doi: 10.1038/ki.1994.305. [DOI] [PubMed] [Google Scholar]
- 11.Bosy-Westphal A, Danielzik S, Dörhöfer RP, Piccoli A, Müller MJ. Patterns of bioelectrical impedance vector distribution by body mass index and age: implications for body-composition analysis. Am J Clin Nutr. 2005 Jul;82(1):60–68. doi: 10.1093/ajcn.82.1.60. [DOI] [PubMed] [Google Scholar]
- 12.Divall P, Camosso-Stefinovic J, Baker R. The use of personal digital assistants in clinical decision making by health care professionals: A systematic review. Health Informatics Journal. 2013 Mar;19(1):16–28. doi: 10.1177/1460458212446761. [DOI] [PubMed] [Google Scholar]
- 13.Ar-Rawi AH, Moghavvemi M, Wan-Ibrahim WMA. Wide Band Frequency Fixed Current Source for BIT and BIA. In: Dössel O, Schlegel WC, editors. ser. IFMBE Proceedings; World Congress on Medical Physics and Biomedical Engineering; September 7 – 12, 2009; Munich, Germany. Berlin Heidelberg: Springer; Jan, 2009. pp. 522–524. [Google Scholar]
- 14.Pliquett U, Barthel A. Interfacing the AD5933 for bio-impedance measurements with front ends providing galvanostatic or potentiostatic excitation. J Phys: Conf Ser. 2012 Dec;407(1):012019. [Google Scholar]
- 15.Piccoli A, Piazza P, Noventa D, Pillon L, Zaccaria M. A new method for monitoring hydration at high altitude by bioimpedance analysis. Med Sci Sports Exerc. 1996 Dec;28(12):1517–1522. doi: 10.1097/00005768-199612000-00012. [DOI] [PubMed] [Google Scholar]
- 16.Piccoli A, Pillon L, Dumler F. Impedance vector distribution by sex, race, body mass index, and age in the United States: standard reference intervals as bivariate Z scores. Nutrition. 2002 Feb;18(2):153–167. doi: 10.1016/s0899-9007(01)00665-7. [DOI] [PubMed] [Google Scholar]
- 17.Harris PA, Taylor R, Thielke R, Payne J, Gonzalez N, Conde JG. Research electronic data capture (REDCap)—A metadata-driven methodology and workflow process for providing translational research informatics support. Journal of Biomedical Informatics. 2009 Apr;42(2):377–381. doi: 10.1016/j.jbi.2008.08.010. [DOI] [PMC free article] [PubMed] [Google Scholar]
- 18.Cole KS. Electric impedance of suspensions of spheres. The Journal of General Physiology. 1928 Sep;12(1):29–36. doi: 10.1085/jgp.12.1.29. [DOI] [PMC free article] [PubMed] [Google Scholar]
- 19.Cornish BH, Thomas BJ, Ward LC. Improved prediction of extracellular and total body water using impedance loci generated by multiple frequency bioelectrical impedance analysis. Physics in Medicine and Biology. 1993 Mar;38(3):337. doi: 10.1088/0031-9155/38/3/001. [DOI] [PubMed] [Google Scholar]
- 20.Gartner A, Maire B, Delpeuch F, Sarda P, Dupuy RP, Rieu D. Importance of electrode position in bioelectrical impedance analysis. The American Journal of Clinical Nutrition. 1992 Dec;56(6):1067–1068. doi: 10.1093/ajcn/56.6.1067. [DOI] [PubMed] [Google Scholar]
- 21.Thomas BJBS, Cornish BHMS, Ward LC. Bioelectrical impedance analysis for measurement of body fluid volumes: A review. Journal of Clinical Engineering. 1992 Nov;17(6) doi: 10.1097/00004669-199211000-00016. [DOI] [PubMed] [Google Scholar]
- 22.Searle A, Kirkup L. A direct comparison of wet, dry and insulating bioelectric recording electrodes. Physiological Measurement. 2000 May;21(2):271. doi: 10.1088/0967-3334/21/2/307. [DOI] [PubMed] [Google Scholar]
- 23.Guyton AC, Hall JE. Guyton and Hall Textbook of Medical Physiology. Elsevier Health Sciences; Jul, 2010. [Google Scholar]
- 24.Deurenberg P, Tagliabue A, Schouten FJM. Multi-frequency impedance for the prediction of extracellular water and total body water. Br J Nutr. 1995;73(03):349–358. doi: 10.1079/bjn19950038. [DOI] [PubMed] [Google Scholar]
- 25.Hoffer EC, Meador CK, Simpson DC. Correlation of whole-body impedance with total body water volume. J Appl Physiol. 1969 Oct;27(4):531–534. doi: 10.1152/jappl.1969.27.4.531. [DOI] [PubMed] [Google Scholar]
- 26.Thomasset A. Bio-electric properties of tissues. Estimation by measurement of impedance of extracellular ionic strength and intracellular ionic strength in the clinic. Lyon Med. 1963 Jun;209:1325–1350. [PubMed] [Google Scholar]
- 27.Piccoli A, Nigrelli S, Caberlotto A, Bottazzo S, Rossi B, Pillon L, Maggiore Q. Bivariate normal values of the bioelectrical impedance vector in adult and elderly populations. Am J Clin Nutr. 1995 Feb;61(2):269–270. doi: 10.1093/ajcn/61.2.269. [DOI] [PubMed] [Google Scholar]
- 28.AD5933 Evaluation Board User Guide. Feb, 2012. Analog Devices. [Google Scholar]
- 29.Stroud DB, Cornish BH, Thomas BJ, Ward LC. The use of Cole-Cole plots to compare two multi-frequency bioimpedance instruments. Clinical Nutrition. 1995 Oct;14(5):307–311. doi: 10.1016/s0261-5614(95)80069-7. [DOI] [PubMed] [Google Scholar]
- 30.Buendía R, Bogónez-Franco P, Nescolarde L, Seoane F. Influence of electrode mismatch on Cole parameter estimation from Total Right Side Electrical Bioimpedance Spectroscopy measurements. Medical Engineering & Physics. 2012 Sep;34(7):1024–1028. doi: 10.1016/j.medengphy.2012.05.011. [DOI] [PubMed] [Google Scholar]
- 31.Prentice AM, Jebb SA. Beyond body mass index. Obesity Reviews. 2001 Aug;2(3):141–147. doi: 10.1046/j.1467-789x.2001.00031.x. [DOI] [PubMed] [Google Scholar]
- 32.Van den Broeck J, Wit JM. Anthropometry and body composition in children. Hormone Research in Paediatrics. 1997;48(Suppl 1):33–42. doi: 10.1159/000191265. [DOI] [PubMed] [Google Scholar]
- 33.Gallagher D, Visser M, Sepúlveda D, Pierson RN, Harris T, Heymsfield SB. How useful is body mass index for comparison of body fatness across age, sex, and ethnic groups? American Journal of Epidemiology. 1996 Feb;143(3):228–239. doi: 10.1093/oxfordjournals.aje.a008733. [DOI] [PubMed] [Google Scholar]
- 34.Buffa R, Saragat B, Cabras S, Rinaldi AC, Marini E. Accuracy of Specific BIVA for the Assessment of Body Composition in the United States Population. PLoS ONE. 2013 Mar;8(3):e58533. doi: 10.1371/journal.pone.0058533. [DOI] [PMC free article] [PubMed] [Google Scholar]
- 35.Mialich MS, Sicchieri JMF, Junior AAJ. Analysis of Body Composition: A Critical Review of the Use of Bioelectrical Impedance Analysis. Int J Clin Nutr. 2014;2(1):1–10. [Google Scholar]
- 36.Ritz P, Sallé A, Audran M, Rohmer V. Comparison of different methods to assess body composition of weight loss in obese and diabetic patients. Diabetes Research and Clinical Practice. 2007 Sep;77(3):405–411. doi: 10.1016/j.diabres.2007.01.007. [DOI] [PubMed] [Google Scholar]


