

ABSTRACT
The long‐term goal of this research is to understand how retinal ganglion cells that express the photopigment melanopsin, also known as OPN4, contribute to vision in humans and other primates. Here we report the results of anatomical studies using our polyclonal antibody specifically against human melanopsin that confirm and extend previous descriptions of melanopsin cells in primates. In macaque and human retina, two distinct populations of melanopsin cells were identified based on dendritic stratification in either the inner or the outer portion of the inner plexiform layer (IPL). Variation in dendritic field size and cell density with eccentricity was confirmed, and dendritic spines, a new feature of melanopsin cells, were described. The spines were the sites of input from DB6 diffuse bipolar cell axon terminals to the inner stratifying type of melanopsin cells. The outer stratifying melanopsin type received inputs from DB6 bipolar cells via a sparse outer axonal arbor. Outer stratifying melanopsin cells also received inputs from axon terminals of dopaminergic amacrine cells. On the outer stratifying melanopsin cells, ribbon synapses from bipolar cells and conventional synapses from amacrine cells were identified in electron microscopic immunolabeling experiments. Both inner and outer stratifying melanopsin cell types were retrogradely labeled following tracer injection in the lateral geniculate nucleus (LGN). In addition, a method for targeting melanopsin cells for intracellular injection using their intrinsic fluorescence was developed. This technique was used to demonstrate that melanopsin cells were tracer coupled to amacrine cells and would be applicable to electrophysiological experiments in the future. J. Comp. Neurol. 524:2845–2872, 2016. © 2016 The Authors The Journal of Comparative Neurology Published by Wiley Periodicals, Inc.
Keywords: primate retina, intrinsically photosensitive ganglion cell, dopamine, bipolar cell, amacrine cell, RRID:AB_397181
Retinal ganglion cells that express the photopigment melanopsin and generate responses to light without requiring any synaptic input from other retinal neurons were first described from rodent retinas (Provencio et al., 2000; Berson et al., 2002). The responses mediated by the photopigment were relatively insensitive to light and had slow kinetics, beginning after a long delay and outlasting the stimulus. These intrinsically photosensitive ganglion cells project to the hypothalamus, where they provide the visual input to synchronize the master circadian clock in the brain with the daily changes in illumination. These ganglion cells also project to the pretectum, where they provide input to the neurons that control the diameter of the pupil, and to other nuclei in the brainstem (Hattar et al., 2002). Initially, most of the research on intrinsically photosensitive ganglion cells dealt with their roles in visual functions that do not require formation of images. More recent studies indicate that melanopsin ganglion cells also project to targets within the retina and contribute to conscious perception of light in humans and to image formation in other mammals (Do and Yau, 2010; Lucas, 2013).
Primate retinal ganglion cells expressing melanopsin were first identified by using in situ hybridization with a probe derived from human melanopsin. Labeled somas were observed in both the inner nuclear layer (INL) and the ganglion cell layer (GCL) of the macaque retina. Given the large size and sparse distribution of the somas, the authors proposed that the retinal ganglion cells projected to the suprachiasmatic nucleus of the hypothalamus (Provencio et al., 2000). The morphology of the melanopsin ganglion cells in humans was first described, and pituitary adenylate cyclase‐activating polypeptide (PACAP), the neuropeptide known to be present in retinal ganglion cells projecting to the hypothalamus, was colocalized in their somas (Hannibal et al., 2004). A retrograde labeling study in macaques indicated that the melanopsin cells also project to the LGN as well as to the pretectum (Dacey et al., 2005). This finding in macaque was confirmed and extended to include other image‐ and nonimage‐forming visual targets such as the suprachiasmatic nucleus (SCN) and the superior colliculus (SC) in a study of PACAP‐immunoreactive retinal projections (Hannibal et al., 2014). In both humans and macaques, there were two types of melanopsin ganglion cells, those with dendrites primarily in the outermost stratum of the inner plexiform layer (IPL) and those with dendrites primarily in the innermost stratum (Hannibal et al., 2004, 2014; Dacey et al., 2005). In macaque, both types of melanopsin cells depolarized and fired action potentials in response to increments of light stimuli under photopic conditions (Dacey et al., 2005). The inner stratifying type also had ON responses like those to dim stimuli, indicating that they received input from rods. At higher light intensities, the polarity of their responses depended on the wavelength of the stimulus. The inner stratifying melanopsin cells were inhibited by short‐wavelength stimuli and excited by long‐ and middle‐wavelength stimuli, findings suggesting that they contributed to color perception. There was also a slow, sustained component of the responses to bright light mediated by melanopsin (Dacey et al., 2005). The anatomical descriptions of human and macaque melanopsin cells were subsequently confirmed (Dkhissi‐Benyahya et al., 2006; La Morgia et al., 2010; Neumann et al., 2011).
Some of the synaptic inputs to melanopsin ganglion cells of primates have been described by using light microscopic, immunolabeling techniques. In marmosets, melanopsin cells received inputs from both bipolar cells and amacrine cells (Jusuf et al., 2007). DB6 diffuse bipolar cells, which are presumed to have ON responses to light in their receptive field centers based on their morphology, provided input to inner stratifying melanopsin cells via their axon terminals. The axons of DB6 bipolar cells also made synapses en passant with the dendrites of outer stratifying melanopsin cells (Grunert et al., 2011). In human retinas, there were extensive interactions between dopaminergic processes and processes labeled with antibodies to melanopsin. These were all interpreted as synapses from the dopaminergic amacrine cells onto melanopsin ganglion cell dendrites (Vugler et al., 2007). However, a recent study of mouse and macaque retina suggests that melanopsin ganglion cells transmit information in the opposite direction. The axons of a subset of melanopsin cells had collaterals that terminated in both the inner and the outer IPL, suggesting that melanopsin cells are presynaptic at their terminals (Joo et al., 2013).
Several questions about melanopsin cells in primates remain unresolved, however. The synapses from amacrine cells and bipolar cells onto melanopsin cells in primates have been observed via light microscopy, but their ultrastructure has not been described. In other mammals, there appears to be a third type of melanopsin ganglion cell whose dendrites branch in two different strata of the IPL (Schmidt and Kofuji, 2011), but it is uncertain whether this type exists in primates. In mouse retina, melanopsin cells play a role in pattern vision (Ecker et al., 2010), and the same may be true in primates. Therefore, it is important to know the spatial distribution of their melanopsin cells. It is not clear how many melanopsin cells of each type cover a given retinal area, and the previous estimates of the spatial density of the melanopsin ganglion cells in primate retinas vary widely (Hannibal et al., 2004; La Morgia et al., 2010). These questions are addressed in the experiments described here.
MATERIALS AND METHODS
Animals
Eleven retinas from 10 macaque monkeys (four Macaca fascicularis, six Macaca nemestrina) aged 1.5–18 years were obtained from the Tissue Distribution Program of the National Primate Research Center at the University of Washington. Eyes were removed with the animals under deep barbiturate anesthesia just prior to euthanasia. Experimental procedures were approved by the Institutional Animal Care and Use Committee at the University of Washington. A retina from a 60‐year‐old human was collected 8 hours postmortem and provided by the Alabama Eye Bank through the Age‐Related Maculopathy Histopathology Laboratory.
Melanopsin antibody
The melanopsin antibody was previously described by Dacey et al. (2005). Here we give a more complete description of its construction and characterization. Nineteen amino acid residues, MNPPSGPRVPPSPTQEPSC, from the N‐terminus of the conceptually translated human melanopsin protein (NCBI accession No. AAF24978) were synthesized (Princeton BioMolecules, Langhorne, PA) with an additional lysine residue at the amino end for crosslinking. The purified peptide was crosslinked to thyroglobulin using glutaraldehyde, followed by dialysis in phosphate‐buffered saline (PBS). The peptide conjugate was used to immunize rabbits (Covance, Denver, PA), and the resulting antisera were purified with peptide bovine serum albumin (BSA)‐packed affinity columns (see Table 1).
Table 1.
Primary Antibodies Used in This Study
| Antibody | Host | Antigen | Source | Catalog No. | Dilution |
|---|---|---|---|---|---|
| Melanopsin (OPN4) | Rabbit | N‐terminal peptide of human melanopsin protein (MNPPSGPRVPPSPTQEPSC) | Dr. King‐Wai Yau, Johns Hopkins University School of Medicine, Baltimore, MD | N/A | 1:100 |
| CD15 | Mouse | U‐937 histiocytic cell line | BD Biosciences, San Diego, CA | 559045, RRID:AB_397181 | 1:50 |
| TH | Sheep | Native rat tyrosine hydroxylase, purified from pheochromocytoma | Pel Freez, Rogers, AR | P60101‐0 | 1:50 |
DNA construct
The pcDNA4/TO‐OPN4‐1D4 inducible expression construct was generated by ligation of a PCR fragment amplified from MGC Human OPN4 cDNA (accession No. BC029291; GE Healthcare). As a positive control, the 1D4 tag (T‐E‐T‐S‐Q‐V‐A‐P‐A) was fused with the C‐terminal of melanopsin. The construct was verified by DNA sequencing.
Cell culture and transfection
T‐Rex inducible cells were maintained in Dulbecco's modified Eagle's medium (DMEM; Gibco, Grand Island, NY) supplemented with 10% fetal bovine serum (Lonza, Walkersville, MD), 0.26 mg/ml glutamine, 54 ng/ml penicillin, and 36 µg/ml streptomycin. Transfections were carried out with Lipofectamine 3000 (Life Technology, Grand Island, NY) according to manufacturer's instructions with 5 µl of reagent per 1 µg DNA. Twenty‐four hours after transfection, cells were induced by 1 μg/ml tetracycline for another 24 hours.
Immunoblotting
After tetracycline induction, total proteins were extracted by buffer A (1% Triton X‐100, pH 7.4 PBS) and subjected to standard BCA concentration measurement. Ninety micrograms of total proteins (control and transfected) was resolved on a SDS/12.5% polyacrylamide gel and transferred onto a nitrocellulose membrane. The Rho1D4 monoclonal antibody (1:50 dilution, a gift from Robert Molday, University of British Columbia), melanopsin polyclonal antibody (1:500 dilution), and a polyclonal antibody against tubulin (1:1,000 dilution, No. 28408; Rockland Immunochemicals, Limerick, PA) were used for immunoblotting.
Characterization of melanopsin antibody in T‐Rex cells
T‐Rex cells were grown on glass coverslips coated with 0.1% gelatin, transfected, and induced as described above. For fluorescent staining, cells were fixed for 10 minutes at room temperature in 4% paraformaldehyde in PBS and incubated with 1D4 antibody (1:100 dilution) or the anti‐melanopsin antibody (1:500 dilution), followed by fluorescein isothiocyanate‐conjugated goat anti‐mouse IgG or anti‐rabbit IgG, respectively.
To provide a positive control for the melanopsin antibody characterization, we placed a 1D4 (T‐E‐T‐S‐Q‐V‐A‐P‐A) fusion tag in the C‐terminal of melanopsin and expressed it in the T‐Rex inducible expression system. Total proteins extracted from control and transfected cells were subjected to immunoblotting (Fig. 1A–C). The melanopsin antibody labeled monomers (54 kDa) and oligomers (over 150 kDa) as well as unknown degradation bands (less than 37 kDa) of the fusion protein, similar to that found for 1D4 (Fig. 1A,B). A nonspecific, albeit minor, band of approximately 40 kDa was also detected with the melanopsin antibody in both control and transfected samples (Fig. 1B). T‐Rex cells expressing 1D4‐tagged melanopsin fusion protein were also subjected to immunohistochemistry with 1D4 antisera and melanopsin antibody (Fig. 1D–G). Colocalization of the two signals can be seen in the merged picture (Fig. 1G).
Figure 1.
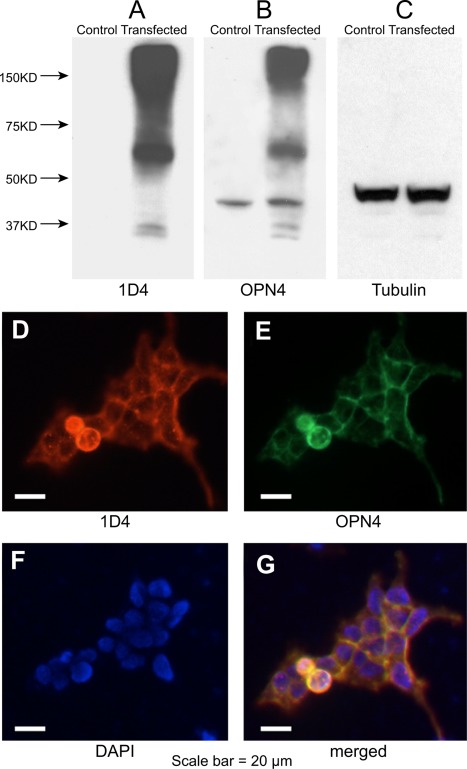
Immunocharacterization of the melanopsin antibody. Top: total proteins extracted from transfected T‐Rex cells probed with anti‐1D4 (A), antimelanopsin (B), and antitubulin (C) antibodies. Bands were detected by chemiluminescence corresponding to the expected sizes of 1D4‐tagged melanopsin fusion protein monomers (54 kDa) and oligomers (over 150 kDa). Bottom: transfected T‐Rex cells expressing 1D4‐tagged melanopsin fusion proteins were immunolabeled with anti‐1D4 (D) and antimelanopsin (E) antibodies. F: DAPI staining. G: Merged image indicates colocalization. Scale bars = 20 µm.
Other antibodies
The host, antigen, manufacturer's information, and dilution used for each antibody are provided in Table 1. The tyrosine hydroxylase polyclonal antibody recognized a single band at 60 kDa on Western blots of rat caudate lysate (Pel Freez product data sheet). The antibody reproduced the pattern of labeling of cells with wide, sparsely branched dendritic trees and long axon‐like processes that has been previously described for primate retina (Dacey, 1990). The CD15 monoclonal antibody recognized a human myelomonocytic antigen lacto‐N‐fucopentose III (BD Pharmigen product data sheet). The antibody reproduced the pattern of labeling described previously for macaque retina; that is, it labeled bipolar cells with relatively large axon terminals close to the ganglion cell layer (Chan et al., 2001). The alpha‐tubulin loading control antibody (No. 600‐401‐880; Rockland Immunochemicals) was prepared from whole rabbit serum produced by repeated immunizations with a synthetic peptide corresponding to amino acids 427–441 of the human protein (Cowan et al., 1983). This polyclonal antibody recognized a single band at 50 kDa on Western blotting in most cell lysates or extracts (Rockland Immunochemicals product data sheet). Rho 1D4 monoclonal antibody was raised in mice using bleached bovine outer segment membranes as the immunogen. It recognized the nine amino acids at the carboxyl terminal of bovine rhodopsin, TETSQVAPA. Its specificity has been tested by polyacrylamide gel electrophoresis and Western blotting, solid‐phase immunoassay, and affinity chromatography (Molday and MacKenzie, 1983). It has been widely used as an epitope tag to detect expressed proteins in Western blots from cell extracts (Molday and Molday, 2014).
Immunohistochemistry
Adult human and macaque monkey retinas were dissected free of the vitreous, retinal pigment epithelium (RPE), and choroid and fixed flat in 4% paraformaldehyde for 2 hours as described elsewhere (Dacey et al., 2005). Retinas were then washed in 0.1 M phosphate buffer (pH 7.4). Whole retinas were blocked in 0.1% Triton X‐100 (Sigma‐Aldrich, St Louis, MO) and 0.5% BSA in PBS for 3 hours. The melanopsin antibody was added at 1:100 and the retina incubated for 1–4 days at 4 ºC. After washing, retinas were incubated in either biotinylated goat anti‐rabbit IgG (BA‐1000; Vector, Burlingame, CA) at 1:100 in 0.1% Triton X‐100 and PBS or in Alexa Fluor 488 goat anti‐rabbit IgG (A‐11034; Molecular Probes, Eugene, OR) at 1:100 in PBS for 1–2 days at 4 ºC. Retinas treated with biotinylated antibody were further incubated in 0.1% Triton X‐100 containing the avidin‐biotin‐horseradish peroxidase (HRP) complex (ABC Elite kit, Vector) for 1–2 days at 4 ºC, rinsed in phosphate buffer, and processed for HRP histochemistry by incubation in diaminobenzidine (DAB; 0.1% in 0.01 M phosphate buffer, pH 7.4) for 5–10 minutes, followed by addition of H2O2 (0.003%) and further incubation for 3–6 minutes. Where the DAB reaction was light, the reaction product was intensified with 0.02% nitroblue tetrazolium (NBT; N‐5514; Sigma) in 0.1 M Tris buffer (pH 8.2; Vaney, 1992). Retinas were mounted on slides with the polyvinyl alcohol‐based mountant Fluoromount‐G (catalog No.17984‐25; Electron Microscopy Sciences, Hatfield, PA), coverslipped, and stored refrigerated. Frozen vertical sections (25 µm) were reacted with the same protocol except that primary antibody incubation was for 10–12 hours, secondary antibody incubation for 7–8 hours, and avidin‐biotin‐HRP incubation for 4–5 hours. Fluorescent‐labeled sections were counterstained with the nuclear dye propidium iodide.
Double‐labeling experiments were performed with antimelanopsin with antityrosine hydroxylase (TH) or anti‐CD15. The TH and melanopsin double labeling was done sequentially. The retina was first incubated in sheep anti‐TH (P60101‐0; Pel Freez, Rogers, AR) at 1:50 in 0.1% Triton X‐100/PBS for 2–3 days at 4 ºC without BSA blocking, rinsed, and incubated in Alexa Fluor 594 donkey anti‐sheep IgG (A‐11016; Molecular Probes) at 1:800 for ∼6 hours at room temperature. After an overnight rinse, the retina was incubated in antimelanopsin primary and secondary antibody solutions as described above, with an Alexa Fluor 488‐labeled secondary antibody. CD15 and melanopsin double labeling was done concurrently. Mouse anti‐CD15 (catalog No. 559045, RRID:AB_397181; BD Biosciences, San Diego, CA) was used at a concentration of 1:50 and rhodamine goat anti‐mouse IgG (115‐025‐020; Jackson Immunoresearch, West Grove, PA) at a concentration of 1:50, using the protocol for antimelanopsin and Alexa Fluor 488‐labeled secondary antibody described above.
Images of peroxidase‐labeled cells were obtained with PictureFrame (SourceForge.net, San Jose, CA) software and a digital camera (Optronics, Goleta, CA) mounted on an Olympus (Center Valley, PA) BX60 microscope. Images of fluorescence‐labeled cells were obtained with a Zeiss (Thornwood, NY) LSM Pascal confocal microscope. Stacks of confocal images were taken with a Plan‐Apochromat × 63 oil immersion objective at step sizes of 0.2 µm, 0.5 µm, or 1.0 µm. Images were adjusted for contrast and brightness in PhotoShop (Adobe Systems, San Jose, CA).
Cell counts and measurements
Macaque melanopsin‐immunostained cells in one retina were counted by taking sequential overlapping confocal images of Alexa Fluor 488‐labeled cells on a Zeiss LSM Pascal confocal microscope with a Plan‐Neofluar × 10 objective. The overlapping images were spliced together in PhotoShop to reconstruct the entire retina. A grid was placed over the image of the reconstructed retina, centered on the fovea, and a small dot was placed over each fluorescent cell. The cells in each square millimeter of the grid were counted and the total numbers of labeled cells in the retina mapped. Human melanopsin‐immunostained cells were similarly counted in one HRP‐labeled retina from brightfield images.
The topography and spatial density of macaque cells was determined by cell counts taken for 1‐mm2 sample areas at eccentricities from ∼2‐18 mm from the fovea in five HRP‐labeled retinas (76 samples, 605 total cells). The topography of the human cells was analyzed similarly in one peroxidase‐labeled retina from cell counts taken at eccentricities from ∼2‐19 mm from the fovea (37 samples, 279 total cells). Human cell sample area sizes ranged from 0.6 to 0.8 mm2 and were used to calculate cell density for a 1‐mm2 area. For both macaque and human retinas, cell samples were taken where immunolabeling appeared complete as judged by the uniformity of the dendritic plexus.
Measurements of soma size, dendritic field size, and dendritic length were made from high‐magnification camera lucida tracings of individual cells, using a Wacom (Vancouver, WA) graphics tablet and ImageJ (National Institutes of Health, Bethesda, MD). Dendritic fields were measured as the area of a convex polygon drawn around the perimeter of the dendritic tree. Effective dendritic field diameter was taken as that of a circle having the same area. The area of synaptic contacts for melanopsin and DB6 cells was measured from print enlargements of confocal images with a Wacom graphics tablet and ImageJ software. Contact diameter was taken as that of a circle having the same area.
Electron microscopy
Eyes from a Macaca mulatta were hemisected, and the posterior halves were fixed and labeled as described previously (Marshak et al., 1990). The first fixative was 4% paraformaldehyde with 0.5% glutaraldehyde in 0.1 M sodium phosphate buffer (PB; pH 7.4) for 2 hours at 37 ºC, and the second was 4% paraformaldehyde in 0.1 M PB (pH 10) overnight at 4 ºC. After fixation, the vitreous humor was removed, and the retina was isolated. The tissue was incubated in 1% sodium borohydride in PBS for 1 hour. The tissue was rinsed in PBS several times over a period of a few hours after this and all succeeding steps. Unless otherwise noted, PBS was used as the diluent for all other reagents. The tissue was then treated for 10 minutes each with both an ascending and a descending series of ethanol solutions (10%, 25%, and 40%). The tissue was incubated with purified rabbit IgG against melanopsin, diluted 1:1,000 for 10 days at 4 ºC. The tissue was then incubated with biotinylated goat anti‐rabbit IgG (Vector) at 1:100 for 2 days at 4 ºC and avidin‐biotin peroxidase complex (Vector, Standard Kit) overnight at 4 ºC. The tissue was reacted with 0.025 mg/ml diaminobenzidine, 0.1 M imidazole, and 0.0025% hydrogen peroxide for 45 minutes. It was then treated with 1% osmium tetroxide in sodium phosphate buffer for 1 hour, dehydrated with methanol, and embedded in epon. The retina was sectioned at 60 μm for light microscopy with a Microm (Heidelberg, Germany) sliding microtome, and those sections with the most extensive labeling were re‐embedded on epon blanks. Ultrathin sections approximately 100 nm thick were cut on a Reichert‐Jung (Buffalo, NY) Ultracut E ultramicrotome and stained with uranyl acetate (2% in 50% methanol, 60 minutes) and lead citrate (0.2% aqueous, 1 minute). These were examined in a JEOL (Peabody, MA) 100 CX electron microscope with a goniometer stage. Labeled ganglion cell processes were surveyed at ×10,000 to determine where they made or received synapses, and the sections were tilted to align the synaptic membranes. Synapses were imaged at ×33,000 using an Advanced Microscopy Techniques (Woburn, MA) digital camera system.
Intracellular tracer injection
The in vitro retina preparation and intracellular injection procedure have been described previously (Dacey and Lee, 1994). Eyes were removed from deeply anesthetized animals, and the retina, choroid, and RPE was dissected free of the vitreous and sclera in oxygenated Ames' medium (Sigma‐Aldrich). The retina‐RPE‐choroid was placed flat, vitreal surface upward, in a superfusion chamber mounted on the stage of a light microscope. Autofluorescent granules were visualized with a blue filter block (Nikon B‐2E/C filter, catalog No. 96107; excitation 490 nm; barrier 515 nm). Targeted cells were intracellularly filled with 2–3% Neurobiotin (Vector) and 1–2% pyranine (Molecular Probes) in 1.0 M potassium acetate using high‐impedance (300–450 MΩ) glass micropipettes. After an experiment, retinas were dissected free of the RPE and choroid, fixed for 2 hours in 4% paraformaldehyde, and rinsed overnight in phosphate buffer (0.1 M, pH 7.4).. Retinas were incubated in 0.1% Triton X‐100 (pH 7.4) containing the avidin‐biotin‐HRP complex (Elite kit; Vector) for 8 hours, rinsed in phosphate buffer overnight, and processed for HRP histochemistry with DAB as the chromogen as described above.
Retrograde labeling
Retrograde labeling of retinal ganglion cells following tracer injection into central visual target areas (LGN, 14 animals; pretectum, eight animals; superior colliculus, seven animals) in adult macaque monkeys has been described elsewhere (Dacey et al., 2003, 2005). In brief, anesthetized animals were prepared for recording in an aseptic surgery, and the position of the target area was determined stereotaxically and evaluated by mapping extracellular responses to flashes of light. Injections of 0.5 ml of 10% biotinylated dextran‐conjugated tetramethylrhodamine 3,000 MW (microruby, No. D‐7162; Molecular Probes) in sterile saline were made in each targeted area. After a 4–7‐day recovery, animals were deeply anesthetized, the eyes were removed, and the animals were perfused through the heart with 800 ml warm (37 ºC) normal saline followed by 4 liters cold (4 ºC) 4% paraformaldehyde. Retinas were prepared for the in vitro experiment as described above. Rhodamine‐labeled cells in the retina were visualized in vitro with a green filter block (excitation filter 545 nm, barrier filter 590 nm). The fluorescent label, initially confined to small bright spots in the soma and proximal dendrites, diffused throughout the dendritic tree after brief light exposure (photofilling), thereby labeling the entire cell. After the in vitro experiment, retinas were fixed and processed for HRP immunoreactivity as described above.
Golgi technique
Golgi‐impregnated macaque retinas were provided courtesy of R.W. Rodieck. The technique has been described previously (Rodieck, 1989). In brief, monkey retinas were obtained from the Tissue Distribution Program of the Regional Primate Center at The University of Washington. After enucleation, the retinas were isolated and fixed for 1 hour in 1% glutaraldehyde and 2% paraformaldehyde in PB. Fixed retinas were sandwiched between filter paper and glass slides, immersed in a solution of 4% potassium dichromate and 1% glutaraldehyde, and placed in the dark for ∼6 days. The sandwich was then rinsed in distilled water, immersed in a 1% solution of silver nitrate, and left in the dark for ∼3 days, after which the retina was removed from the sandwich, dehydrated through alcohols into propylene oxide, and then embedded in epon.
RESULTS
Identification and topographical distribution
Melanopsin expression in macaque and human ganglion cells was studied in whole‐mount retina and vertical sections labeled with the polyclonal antibody to human melanopsin. Ganglion cells with very large, sparsely branched dendritic trees were labeled in both macaque and human retinas (Fig. 2A,E). In one macaque retina, a cell count of ∼3,000 was determined from overlapping confocal images of melanopsin cells (Fig. 2B; see Materials and Methods). The cells were very sparsely distributed; they made up only 0.2% of the 1.5 million ganglion cells in macaque retina (Perry and Cowey, 1985). The melanopsin cells showed a shallow density gradient ranging from 20–25 cells/mm2 in the parafovea to five cells/mm2 over much of the retinal periphery (Fig. 2C). A patch of the melanopsin cell mosaic located ∼5 mm from the fovea is shown in Figure 2D.
Figure 2.
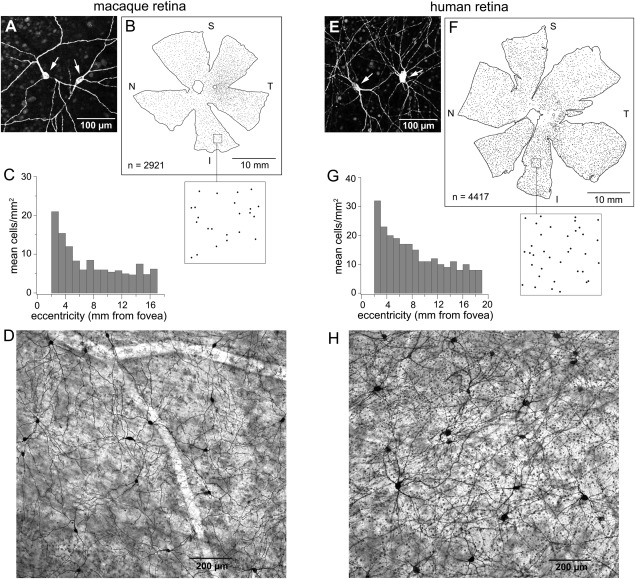
Melanopsin antibody labels a population of ganglion cells with a low spatial density and the same morphology in both human and macaque retinas. A–D: Macaque retina. A: Confocal image of Alexa Fluor labeled melanopsin immunoreactive cells. Arrows indicate somas. B: Tracing of a macaque monkey retina. Each dot represents a melanopsin cell. The total cell count was 2,921, with the highest density being in central retina (previously published by Dacey et al., 2005, Fig. 1C). A 4‐mm2 area indicated by the box is shown enlarged in the inset below. N, S, T, and I refer to nasal, superior, temporal, and inferior retina, respectively. C: Mean cell density plotted as a function of eccentricity. Cell density decreases with eccentricity, from 20–25 cells/mm2 in central retina to five or six cells/mm2 in the far periphery, becoming rather flat by ∼6 mm from the fovea. Cell counts were made in sample areas at a range of eccentricities in five retinas (see Materials and Methods; data previously published by Dacey et al., 2005; Fig. 1G). D: Photomicrograph of a patch of melanopsin cells in an HRP‐stained retina located 5 mm from the fovea. E–H: Human retina. E: Confocal image of Alexa Flour‐labeled melanopsin cells (arrows indicate somas). F: Tracing of a human retina. Each dot represents a melanopsin cell. Total cell count was 4,417. An enlarged view of the 4‐mm2 area indicated by the box is shown in the inset. G: Mean cell density is plotted as a function of eccentricity. Cell density decreases from 30–35 cells/mm2 in central retina to 8 to 10 cells/mm2 in the far periphery. H: Photomicrograph of a patch of melanopsin cells at 7 mm from the fovea. Scale bars = 100 µm in A,E; 10 µm in B,F; 200 µm in D,H.
The results in human retina parallel those in macaque. A cell count of ∼4,400 was determined for one human retina labeled with antibody to melanopsin (Fig. 2F; see Materials and Methods). The cell count is probably somewhat higher than 4,400 because some areas of the human retina were incompletely labeled, particularly the central retina. The higher number of human melanopsin cells compared with macaque cells was only partially explained by the larger area of the human retina; the melanopsin cells also had a higher spatial density in humans. As in macaques, the human melanopsin cells showed a shallow density gradient, with a range of 30–35 cells/mm2 in central retina tapering off to 8 to 10 cells/mm2 in the periphery (Fig. 2G). This is a slightly higher cell density than in macaques, yet it still represents a very sparse cell population. Melanopsin cells make up only 0.4% of the 1.07 million ganglion cells in the human retina (Curcio and Allen, 1990). Figure 2H shows a patch of the melanopsin mosaic in human retina located ∼7 mm from the fovea.
Dendritic morphology and stratification
The melanopsin cells had large somas and very long, sparsely branched dendrites. Tracings of four inner stratifying macaque melanopsin cells are shown in Figure 3 along with retrogradely‐labeled midget, parasol, and small bistratified cells from the same eccentricities for comparison. The cells in Figure 3A are located 1–2.5 mm from the fovea, and the cells in Figure 3B are located in peripheral retina 7–11 mm from the fovea. Near the fovea, the dendritic trees of melanopsin cells are seven to eight times larger than those of parasol and small bistratified cells. In the periphery, the dendritic trees of melanopsin cells are four to five times larger than those of parasol and small bistratified cells.
Figure 3.
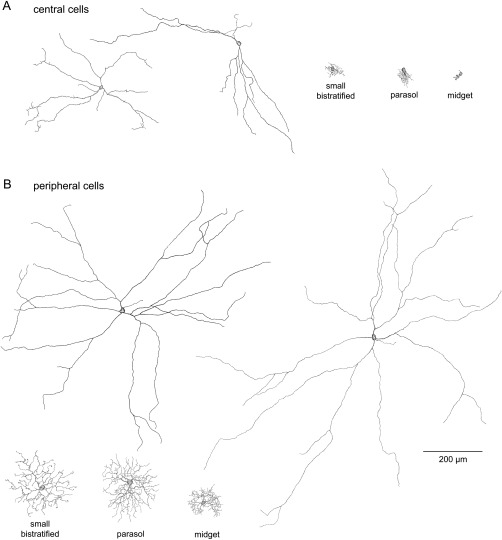
Tracings of immunolabeled macaque melanopsin cells and midget, parasol, and small bistratified ganglion cells retrogradely labeled from retrograde tracer injections into the LGN. A: Two parafoveal melanopsin cells located at 1.4 mm (left cell; dendritic field diameter 390 µm) and 0.8 mm (right cell; dendritic field diameter 447 µm) from the fovea (tracings were previously published by Dacey et al., 2005; Fig. 1E). Small bistratified dendritic field diameter 57 µm; eccentricity 2.0 mm. Parasol cell dendritic field diameter 55 µm; eccentricity 1.7 mm. Midget cell dendritic field diameter 20 µm; eccentricity 2.4 mm. B: Two peripheral melanopsin cells located at 6.8 mm (left cell; dendritic field diameter 867 µm) and 11.2 mm (right cell; dendritic field diameter 1,066 µm) from the fovea. Small bistratified cell dendritic field diameter 219 µm; eccentricity 8.2 mm. Parasol cell dendritic field diameter 213 µm; eccentricity 8.7 mm. Midget cell dendritic field diameter 118 µm; eccentricity 8.8 mm (parasol and midget cell tracings were previously published by Dacey et al., 2005; Fig. 1D). Scale bar = 200 µm.
The dendrites of melanopsin cells in macaque and human retina were localized to two strata at the extreme inner and outer borders of the IPL (Fig. 4). Individual melanopsin cells are primarily monostratified, but some cells send a few terminal dendrites to the opposite stratum (asterisk in Fig. 4A). A schematic representation of melanopsin cell stratification in macaque is shown in Figure 4C (see also Table 2). In macaques, 54% of all melanopsin cell somas are located in the GCL. These include all of the inner stratifying melanopsin cells, 39% of the total, and a subset of the outer stratifying melanopsin cells, 15% of the total. The remaining 46% of the melanopsin somas are located in the INL, and their dendrites ramify solely or principally in the outer plexus. A whole‐mount view of neighboring inner and outer macaque cells is shown in Figure 4D. A quantitative analysis of macaque melanopsin cell stratification was made from measurements of the length of the entire dendritic plexus found in an area of 1.5 mm2 in peripheral retina (Fig. 4E). Dendrites arising from principally inner stratifying cells make up 99% of the inner plexus and dendrites from principally outer stratifying cells 1% of this plexus (Fig. 4E, left). Dendrites arising from principally outer stratifying cells make up 89% of the outer plexus and dendrites from principally inner stratifying cells 11% of the outer plexus (Fig. 4E, middle). A small percentage of dendrites crossed the IPL to ramify in the opposite stratum; ∼8% of inner cell dendrites and ∼2% of outer cell dendrites. The inner and outer dendritic plexus are shown superimposed in the right panel of Figure 4E.
Figure 4.
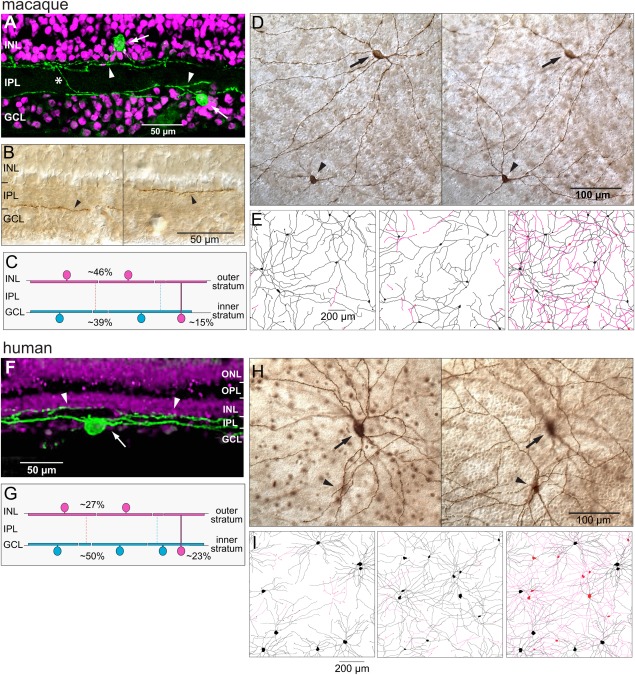
Melanopsin cell dendrites were localized to two strata of the IPL. A–E: Macaque retina. A: Reconstruction of the dendritic arbors of two melanopsin‐labeled cells (green; arrows indicate somas) from confocal images of five consecutive vertical sections (25 µm thick) located ∼2 mm from the fovea. Propidium iodide counterstaining (magenta) shows the nuclear layers. Dendrites form two strata at the extreme borders of the IPL (arrowheads). The outer stratifying cell soma is located in the INL. The inner stratifying cell contributes a dendrite to the outer stratum (asterisk; previously published by Dacey et al. 2005; Fig. 1H). B: Photomicrographs of melanopsin cell dendrites in vertical sections. Labeled dendrites mark the inner (arrowhead, left) and outer (arrowhead, right) borders of the IPL. C: Schematic representation of melanopsin cell stratification. Approximately 39% of the cells are primarily or exclusively inner stratified (blue); ∼61% are primarily or exclusively outer stratified (magenta). Approximately 46% of the somas are displaced to the INL (see also Table 2). D: Photomicrographs of melanopsin cells in whole‐mount retina. Focus in the left panel is on the GCL/IPL border on an inner cell soma and dendrites (arrow). Focus in the right panel has shifted to the IPL/INL border on the dendrites of an outer cell (arrowhead). E: Tracings of the dendritic plexus of melanopsin cells in a 1.5‐mm2 area located ∼10 mm from the fovea. Left panel: Somas and dendrites of seven inner cells (black). Several inner dendrites (magenta) arise from partially bistratified outer cells. Middle panel: Somas and dendrites of eight outer cells (black). Several outer dendrites (magenta) arise from partially bistratified inner cells. Somas of six cells are displaced to the INL. Right panel: Inner (black) and outer (magenta) cell dendrites are shown together. F–I: Human retina. F: Stacked confocal image of a vertical section (50 µm) of human retina showing an inner stratifying melanopsin‐labeled cell (green; arrow indicates soma) and the dendrites of an outer stratifying cell (arrowheads). Magenta counterstaining shows the nuclear layers. G: Schematic representation of melanopsin cell stratification in human retina. Approximately 50% of the cells are solely or predominantly inner stratified (blue), and ∼50% are solely or predominantly outer stratified (magenta), with ∼27% of the somas displaced to the INL (see also Table 2). H: Photomicrographs of melanopsin cells in whole‐mount retina. Focus in the left panel is on the GCL/IPL border on an inner cell soma and dendrites (arrow). Focus in the right panel has shifted to the IPL/INL border on the displaced soma and dendrites of an outer cell (arrowhead). I: Tracings of melanopsin cells in a 1.0‐mm2 area located 7 mm from the fovea. Left panel: Somas and dendrites of eight inner cells (black). Several inner cell dendrites arise from partially bistratified outer cells (magenta). Middle panel: Somas and dendrites of 11 outer cells (black). Several outer dendrites arise from partially bistratified inner cells (magenta). Somas of nine cells are displaced to the INL. Right panel: Inner (black) and outer (magenta) cells are shown together. ONL, outer nuclear layer; OPL, outer plexiform layer; INL, inner nuclear layer; IPL, inner plexiform layer; GCL, ganglion cell layer. Scale bars = 50 µm in A,B,F; 100 µm in D,H; 200 µm in E,I.
Table 2.
Dendritic Stratification and Soma Placement
| Macaque1 | Human2 | |
|---|---|---|
| Total number of cells | 605 | 279 |
| Total number displaced | 281 | 76 |
| Percentage displaced | 46 | 27 |
| Inner cell total | 234 | 139 |
| Inner cell percentage | 39 | 50 |
| Inner cells displaced | 0 | 0 |
| Outer cell total | 371 | 140 |
| Outer cell percentage | 61 | 50 |
| Outer cells displaced | 281 | 76 |
| Percentage displaced | 76 | 54 |
The distribution of melanopsin somas and dendrites in the human retina was similar and summarized in Figure 4G (see also Table 2). There were equal numbers of inner and outer stratifying melanopsin cells. Approximately half of the outer cells (27% of total cells) have somas in the INL. As in macaque retina, all of the inner melanopsin somas were located in the GCL. Neighboring inner and outer human cells in whole‐mount retina are shown in Figure 4H. A quantitative analysis of human melanopsin cell stratification was made for a 1‐mm2 area of the mid‐peripheral retina (Fig. 4I). Dendrites arising from principally inner stratifying cells make up 91% of the inner plexus and dendrites from principally outer stratifying cells only 9% of the plexus (Fig. 4I, left). Dendrites of principally outer stratifying cells make up 88% of the outer plexus, with 12% of the plexus arising from principally inner stratifying cells (Fig. 4I, middle). As in macaque, a relatively small percentage of dendrites crossed the IPL to ramify in the opposite stratum, ∼15% of inner cell dendrites and ∼7% of outer cell dendrites. The inner and outer dendritic plexus are shown superimposed in the right panel of Figure 4I.
One example of a melanopsin cell dendrite extending into the outer plexiform layer (OPL) was seen in a vertical section of macaque retina (not shown). An outer stratifying cell with its soma in the INL sent one dendrite to the OPL, where it ran along the INL/OPL border for a short distance.
Dendritic field and soma size
Dendritic field and soma size were measured for a total of 276 macaque and 128 human melanopsin cells (Fig. 5). In both macaque and human retina, dendritic field size increased with increasing distance from the fovea (Fig. 5A,D). In the macaque retina, inner stratifying cell dendritic fields (mean ± SD 761 ± 216 µm) were somewhat larger than those of outer stratifying cells (mean ± SD 718 ± 220 µm). However, based on an independent, two sample t‐test with equal variance, the difference was not significant. In the human retina, the reverse was true; dendritic fields of outer cells (mean ± SD 690 ± 148 µm) were somewhat larger than those of inner cells (mean ± SD 646 ± 151 µm), but the difference was not significant. Both inner and outer stratifying cells had larger dendritic fields in the macaque than in the human retina. The soma size did not change with eccentricity in either species (Fig. 5B,E), and inner stratifying cell somas were significantly larger than outer stratifying cell somas in both species (P < 0.001 for both). The human melanopsin cell somas, however, were larger than those in the macaque. Mean soma diameter was 23 µm (SD = 3 µm) for human inner stratifying cells and 19 µm (SD = 3 µm) for human outer stratifying cells. In the macaque, the mean soma diameter was 16 µm (SD = 2 µm) for inner stratifying cells and 14 µm (SD = 2 µm) for outer stratifying cells. The extent of dendritic branching was quantified by counting the terminal points (branch points) of the dendrites. In both macaque and human, inner cells were significantly more highly branched than outer stratifying cells (P < 0.001 for both; Fig. 5C,F). Both inner and outer human melanopsin cells, however, were more highly branched than their macaque counterparts. The mean number of branch points for human inner cells was 27 (SD = 7) and 18 (SD = 5) for outer cells. In the macaque, the mean number of branch points for inner cells was 15 (SD = 5) and 12 (SD = 5) for outer cells. Although the number of branch points for the macaque melanopsin cells varied little with eccentricity, the human cells showed an increase in branch points with increasing distance from the fovea. The similarities and differences between macaque and human melanopsin cells are illustrated in the cell tracings of Figure 6.
Figure 5.
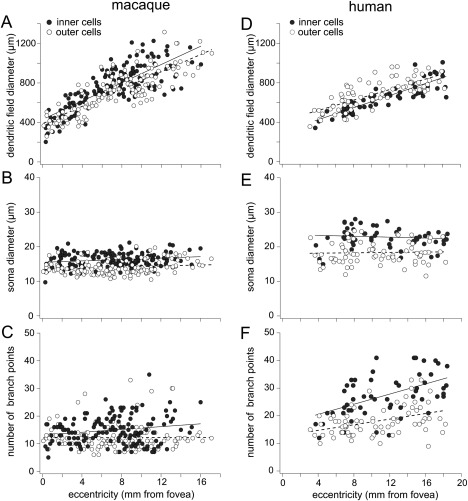
Scatterplots of dendritic field diameter, soma diameter, and number of branch points as a function of eccentricity for macaque and human melanopsin cells. Macaque data include melanopsin cells retrogradely labeled from tracer injections into central visual target areas (see Materials and Methods; inner cells, n = 43; outer cells, n = 36). Human cell data are from one melanopsin immunolabeled retina. A–C: Macaque. A: Dendritic field diameter for both inner (solid circles, n = 145) and outer (open circles, n = 131) melanopsin cells increases with increasing distance from the fovea. Inner cell dendritic fields (mean ± SD 761 ± 216 µm) are somewhat larger than outer cells (mean ± SD 718 ± 220 µm; plot includes data previously published by Dacey et al., 2005; Fig. 1F). B: Soma size does not vary with eccentricity. Inner cell somas (mean ± SD 16 ± 2 µm) are somewhat larger than outer cells (mean ± SD 14 ± 2 µm). C: The number of dendritic branch points changes little with eccentricity. Inner cell dendrites are somewhat more highly branched (mean ± SD 15 ± 5) than outer cells (mean ± SD 12 ± 5). D,E: Human. D: Dendritic field diameter of inner (solid circles, n = 56) and outer (open circles, n = 72) cells increases with increasing distance from the fovea. Outer cell dendritic fields (mean ± SD 690 ± 148 µm) are somewhat larger than inner cells (mean ± SD 646 ± 151 µm). E: Soma size does not vary with eccentricity. Inner cell somas (mean ± SD 23 ± 3) are larger than outer cell somas (mean ± SD 19 ± 3 µm). F: The number of dendritic branch points increases with increasing distance from the fovea. Inner cell dendrites are more highly branched (mean ± SD 27 ± 7) than outer cells (mean ± SD 18 ± 5). Solid lines in the plots are fits to the inner cell data; dashed lines are fits to the outer cell data. Scale bar = 200 µm.
Figure 6.
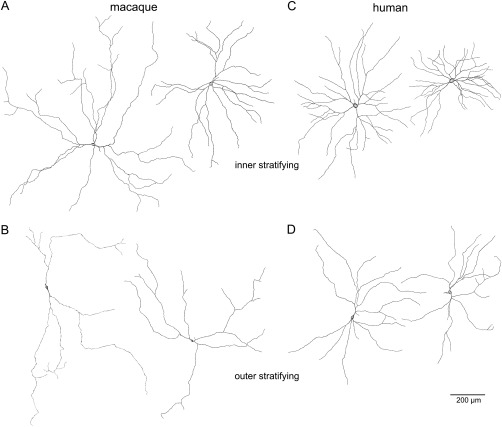
Tracings of melanopsin cells in macaque and human retina. A: Two inner stratifying macaque melanopsin cells. Left cell: Dendritic field diameter 692 µm; soma diameter 18 µm; eccentricity 5 mm. Right cell: Dendritic field diameter 1122 µm; soma diameter 18 µm; eccentricity 10.1 mm. B: Two outer stratifying macaque melanopsin cells. Both have somas in the INL. Left cell: Dendritic field diameter 868 µm; soma diameter 13 µm; eccentricity 10.5 mm. Right cell: Dendritic field diameter 938 µm; soma diameter 13 µm; eccentricity 10.7 mm. C: Two inner stratifying human melanopsin cells. Left cell: Dendritic field diameter 535 µm; soma diameter 25 µm; eccentricity 7.2 mm. Right cell: Dendritic field diameter 743 µm; soma diameter 24 µm; eccentricity 12.7 mm. D: Two outer stratifying macaque melanopsin cells; both have somas displaced to the INL. Left cell: Dendritic field diameter 665 µm; soma diameter 16 µm; eccentricity 6.7 mm. Right cell: Dendritic field diameter 764 µm; soma diameter 16 µm; eccentricity 13 mm. Scale bar = 200 µm.
The data in the scatterplots for macaque cells (Fig. 5A–C) include melanopsin cells retrogradely labeled from tracer injections in the LGN, pretectum, and SC (see Materials and Methods). Both inner and outer stratifying melanopsin cells were consistently labeled from all three visual targets, including the LGN. Among the cells plotted in Figure 5A–C, 26 were retrogradely labeled from the LGN, including 12 inner cells and 14 outer cells.
Coverage
Dendritic overlap for macaque and human melanopsin cells was estimated by calculating the coverage factor, the mean dendritic field area multiplied by the mean cell density. Cell densities and coverage factors are plotted in Figure 7. In the macaque, coverage remains fairly constant from central to peripheral retina, 2–17 mm, with a mean coverage factor of 1.5 (SD = 0.4) for inner cells and 2.0 (SD = 0.6) for outer cells. In human retina, dendritic overlap was very similar to that of the macaque. The mean coverage factor for human inner cells was 1.8 (SD = 0.4); human outer cell mean coverage was 2.3 (SD = 0.4). The similarity between the two species suggests that the smaller dendritic field size of human melanopsin cells (Fig. 5D) was offset by a higher spatial density (Fig. 7C). In other words, every point in both macaque and human retina is sampled by the dendrites of approximately two melanopsin cells ramifying in the inner stratum and approximately two melanopsin cells ramifying in the outer stratum.
Figure 7.
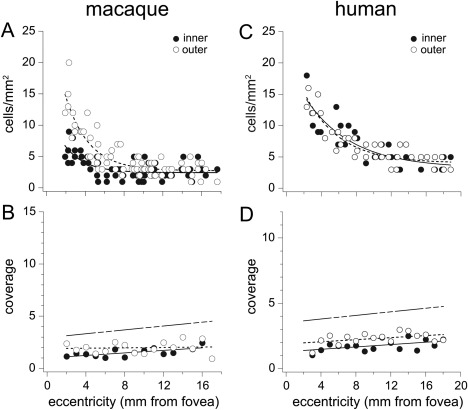
Scatterplots of macaque and human melanopsin cell density and dendritic coverage. A: Macaque cell density plotted as a function of eccentricity for inner (solid circles; mean ± SD 3 ± 1.6 cells/mm2) and outer (open circles; mean ± SD 5 ± 3.5 cells/mm2) cells, determined as described for Figure 2C. B: Macaque melanopsin cell coverage as a function of eccentricity. Inner cell mean coverage factor ± SD 1.5 ± 0.4; outer cell mean coverage factor ± SD 2.0 ± 0.6). Solid lines in the plots are fits to the inner cell data; dashed lines are fits to the outer cell data. Coverage for the total population (mean ± SD 3.8 ± 1.0) is represented by the broken line. C: Human cell density for inner (solid circles; mean ± SD 7 ± 3.5) and outer (open circles; mean ± SD 7 ± 3.3) cells, determined as described for Figure 2G. D: Human cell coverage is similar to that of macaque. Inner cell mean coverage factor ± SD 1.8 ± 0.4; outer cell mean coverage factor ± SD 2.3 ± 0.4). Coverage for the total population (mean ± SD 4.2 ± 0.6) is represented by the broken line.
Spatial regularity and dendritic independence
The morphological distinction between inner stratifying and outer stratifying melanopsin cells was studied further by analyzing the spatial regularity of the mosaic of melanopsin cell somas in macaque retina, and the results are illustrated in Figure 8. Spatial regularity was determined by measuring the distance between each cell and its nearest neighbor in 16 1‐mm2 samples of melanopsin cells at 4–5 mm eccentricity, and the regularity index, the mean nearest neighbor distance divided by 1 SD, was calculated. An index value of 1.0 denotes a random array; higher values indicate increasing spatial regularity in the cell mosaic. When considered as one population, the regularity index of melanopsin cells was 2.4. When spatial regularity was analyzed for inner and outer cells separately, the regularity index increased to 2.8 for inner cells (n = 59) and 2.9 for outer cells (n = 112), indicating that melanopsin cells form more regular mosaics when considered as separate inner and outer cell populations. For comparison with the melanopsin cells, we analyzed the spatial regularity of macaque parasol cells, which form physiologically and morphologically distinct inner and outer cell populations. Cell distances were measured in a 1‐mm2 sample area of HRP‐stained parasol cells retrogradely labeled following tracer injection into the LGN. When inner and outer parasol cells were analyzed together, the regularity index was 2.6 (Fig. 7D; n = 187). Analyzed as separate populations, the regularity index for the inner parasol cells increased to 6.2 (Fig. 7E; n = 102) and the index for outer parasol cells increased to 5.1 (Fig. 7F; n = 85). The higher degree of regularity in parasol inner and outer cell populations compared with giant inner and outer cells may reflect the higher parasol cell density (less noise) compared with giant cells.
Figure 8.
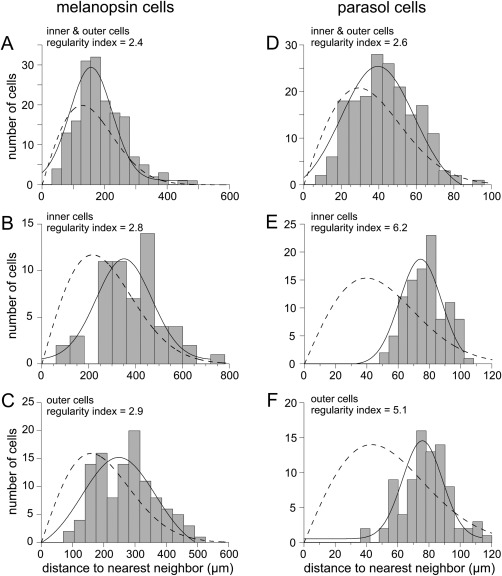
Spatial regularity of the macaque melanopsin cell mosaic. Nearest neighbor distances are plotted as histograms and fit with a Gaussian function (solid lines); dashed lines are predictions from probability theory for the cell density of the sample and a random distribution (Wässle and Riemann, 1978). A: Macaque inner and outer melanopsin cells plotted together (n = 171; mean density 9.8 cells/mm2). The regularity index (mean distance divided by 1 SD) was 2.4. B: Inner melanopsin cell distances plotted alone; regularity has increased to 2.8 (n = 59; mean density 3.4 cells/mm2). C: Outer melanopsin cells plotted alone; regularity index = 2.9 (n = 112; density 6.3 cells/mm2). D–F: Spatial regularity of macaque parasol cells in a 1‐mm2 sample area is shown for comparison. D: Plot of cell distances for inner and outer parasol cells together; regularity index = 2.6 (n = 187). E: Plot of inner cell distances only; regularity index = 6.2 (n = 102). F: Plot of outer cells only; regularity index = 5.1 (n = 85).
The inner and outer melanopsin cell dendritic networks were also spatially independent in macaque retina. The dendrites of a single population tend to interdigitate with those of their neighbors when their dendritic fields overlap. However, when dendrites from two distinct populations overlap, there is little if any interdigitation. Thus, the extent to which dendrites cross over one another provides a measure of the spatial independence of the dendritic networks. We evaluated the effect of changing the orientation of overlapping dendritic networks for the area of macaque retina shown in Figure 4E (shown again in Fig. 9). For a normal orientation, there were 142 dendritic intersections. Five different random rotations were performed, with a mean number of dendritic intersections of 141 (SD = 3.2; range 136–145). The extent of overlap in inner and outer cell dendritic networks was the same as for a random placement, suggesting strongly that the two populations were spatially independent.
Figure 9.
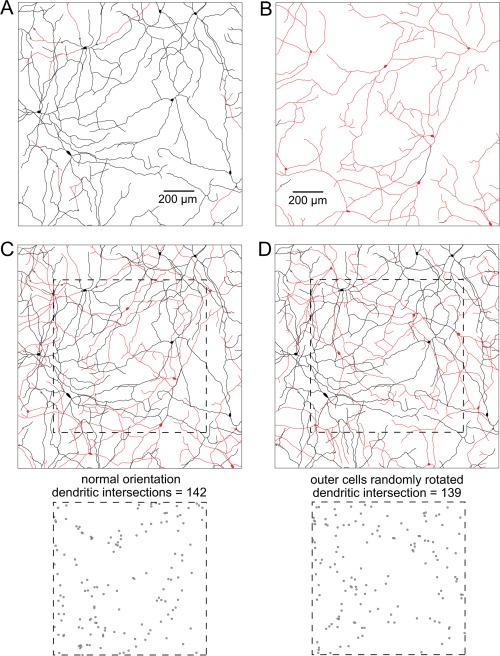
Spatial independence of the inner and outer melanopsin cell dendritic networks in macaque retina. A: Tracings of the dendrites of principally inner stratified cells (black) in the same 1.5‐mm2 area shown in Figure 3E. A few dendrites cross over to stratify in the outer IPL (red). B: The dendrites of principally outer stratified cells (red); a few dendrites cross over to the inner IPL (black). C: Cells in A and B shown superimposed in their normal orientation. Points where dendrites cross one another (dendritic intersections) for the area within the dashed square are shown below. For a normal orientation, dendritic intersections = 142. D: Outer cells were randomly rotated and the dendritic intersections counted (bottom; dendritic intersections = 139). Scale bars = 200 µm.
Electron microscopy
The synaptic contacts of outer stratifying melanopsin cells were studied in peripheral macaque retina; inner stratifying cells were not labeled under these conditions. All of the labeled processes were in the outer half of the IPL (Fig. 10). In many sections, a labeled soma was present in the INL along with a large primary dendrite running parallel to the plane of section in the uppermost stratum of the IPL just below the INL. Because melanopsin is a membrane protein, dendritic plasma membranes were typically lined with dense label, which might have obscured postsynaptic densities. Therefore, synapses were identified by the presence of presynaptic specializations. The interior of the dendrites was also labeled, albeit less densely. The label on smaller dendrites was less evenly distributed, occasionally seeming to fade away, making it difficult to determine which processes were definitely labeled. Larger dendrites were clearly labeled and easy to identify and were, therefore, the primary focus of study.
Figure 10.
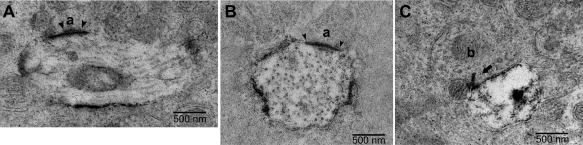
Synaptic contacts in the outer IPL in EM sections of melanopsin‐labeled macaque retina. A: A labeled dendrite cut in longitudinal section receives a synapse from an amacrine cell (a). The amacrine cell is relatively electron lucent and displays clear presynaptic specialization (arrowheads). B: A labeled dendrite cut in cross‐section receives a synapse from an amacrine cell (a). Because of the dense labeling of the ganglion cell membrane, synapses were detected based on presynaptic specializations (arrowheads). C: A labeled ganglion cell dendrite cut in cross‐section receives a synapse from a cone bipolar cell axon (b) at a ribbon synapse (arrow). The other member of the dyad is an amacrine cell process. Scale bars = 500 µm.
Labeled dendrites were not common; there were rarely more than two or three large profiles in a single section. All of the synapses in the sample were inputs from unlabeled cells to the melanopsin cells. A few synapses were from axons of cone bipolar cells, and the rest were from processes of amacrine cells. Synapses from amacrine cells were seen on both large and small labeled dendrites (Fig. 10A,B). Typically, the presynaptic bipolar cell axons made dyad synapses with the labeled dendrite and an amacrine cell process (Fig. 10C). Another presynaptic bipolar cell axon found on a large, densely labeled dendrite made two ribbon synapses with the labeled process and did not appear to synapse with any other processes (not shown).
Contacts with dopaminergic amacrine cells
The large, sparsely branched dendritic tree and axons of the dopaminergic amacrine cells stratify at the outermost border of the IPL in macaque retina (Dacey, 1990). To test whether the amacrine cell synapses seen in the electron microscope could originate from dopaminergic amacrine cells, macaque whole‐mount retina was labeled with antibodies against melanopsin and TH. The entire dendritic tree of one outer stratified melanopsin cell was reconstructed from stacked confocal images, and its contacts with dopaminergic amacrine cells were analyzed (Fig. 11). Axons of dopaminergic cells appear to envelop the melanopsin cell's dendrites (insets to Fig. 11A; see also Fig. 11B,C). The extent of apposition of melanopsin cell dendrites and dopaminergic amacrine cell axons was quantified by measuring the length of melanopsin cell dendrites in close contact with dopaminergic processes in seven sample areas totaling ∼17% of the dendritic tree. Approximately 52% of the length of the melanopsin cell's dendrites (SD = 15.7%; range 28.0–76.9%) contacted dopaminergic axons. Dopaminergic axons also contacted the melanopsin cell's soma (Fig. 11D–F). All somas of outer stratifying melanopsin cells examined appeared to have contacts with dopaminergic cell axons, although there was some variability in the extent of the contacts.
Figure 11.
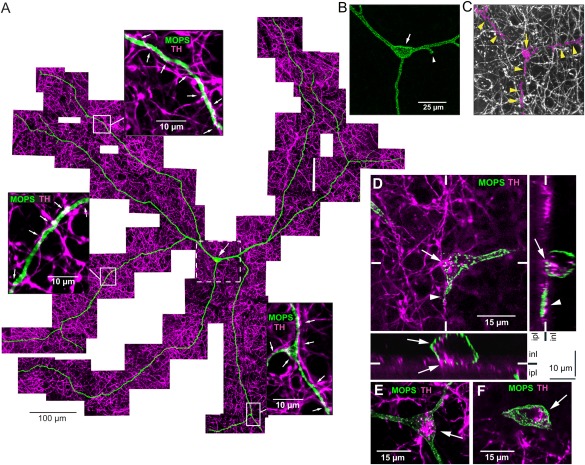
Double labeling with antibody to tyrosine hydroxylase revealed extensive apposition of outer melanopsin cell dendrites with dopaminergic amacrine cell axons. A: Reconstruction of the dendritic tree of an outer melanopsin cell (MOPS, green; arrow indicates soma) and dopaminergic amacrine cell processes (TH, magenta) from stacked confocal images. Insets are enlargements of the boxed areas. Melanopsin cell dendrites are heavily enveloped by the dopaminergic axons (arrows in insets). B: Enlarged view of the area within the dashed box in A, showing only the melanopsin label (green) in the melanopsin cell (arrow indicates soma; arrowhead indicates axon). C: Same area as in B but with only the plexus of dopaminergic processes shown (white); the dopaminergic axon terminals in close contact with the melanopsin cell are highlighted in magenta and nearly outline the melanopsin cell dendrites (arrowheads). The melanopsin cell soma also appears to receive contacts from dopaminergic axon terminals (arrow). D: Confocal image of a melanopsin cell (green; same cell as in A) and dopaminergic amacrine cell processes (magenta). Focus is at the IPL/INL border. Arrow indicates dopaminergic axon terminals contacting the melanopsin cell soma. Arrowhead indicates an axon running along a melanopsin cell dendrite. Right panel: Optical vertical section taken at the location of the vertical white lines in the whole mount image; arrow and arrowhead indicate the same points as shown in the whole‐mount view. Lower panel: Optical section at the point of the horizontal white lines in the whole‐mount image; arrows indicate contacts extending along the soma. E,F: Stacked confocal images (5 µm) of two other melanopsin cells with dopaminergic axon terminals contacting the somas (arrows). Scale bars = 100 µm in A; 25 µm in B; 15 µm in D–F; 10 µm in insets.
Contacts with DB6 cone bipolar cells
The dendrites of inner melanopsin cells stratify at the innermost border of the IPL, where axon terminals of DB6 cone bipolar cells are known to stratify. To determine whether there were any contacts between the two cell types, whole‐mount macaque retina was labeled with melanopsin antibody and the DB6 cone bipolar cell marker CD15. The two cell types costratified and made numerous contacts (Fig. 12). The entire dendritic tree of one inner cell was reconstructed from stacked confocal images (Fig. 12A). All of its dendrites were close to the GCL/IPL border, with the exception of one short dendrite that terminated in the outer IPL (Fig. 12B). The inner melanopsin cell was contacted by DB6 cells at discrete points along its dendritic tree (insets to Fig. 11A); the diameter of the contacts was 1.5 ± 0.5 µm (mean ± SD, n = 11). This cell had 169 such contact points, accounting for ∼7% of its total dendritic length. The melanopsin cell contacted DB6 cell axon terminals via small dendritic swellings and short, spine‐like projections (Fig. 12B,C). The axons of rod bipolar cells also terminate in the innermost stratum of the IPL (Boycott and Dowling, 1969). In double‐labeling experiments with melanopsin antibody and the rod bipolar cell marker protein kinase Cα (PKCα), there were no apparent contacts between inner melanopsin cells and rod bipolar cells (not shown).
Figure 12.
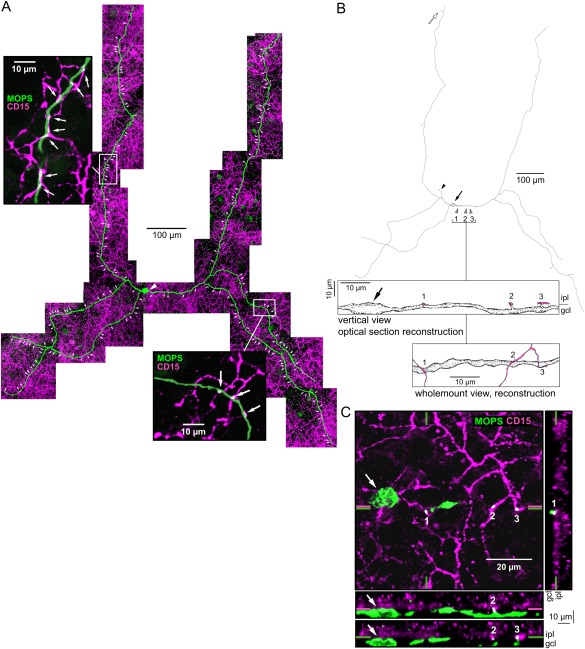
Double labeling for melanopsin and the DB6 cone bipolar cell marker CD15 revealed that the two cell types costratify and make numerous contacts. A: Reconstruction of an inner melanopsin cell (MOPS, green; arrowhead indicates soma) and DB6 bipolar cell axon terminals (CD15, magenta) from stacked confocal images. The melanopsin cell makes numerous contacts with DB6 bipolar cell axon terminals (arrows). Insets show enlarged views of the boxed areas, with DB6 bipolar cell contacts indicated by arrows. B: Tracing of the cell shown in A (solid arrow indicates soma; solid arrowhead indicates axon). The melanopsin cell stratified close to the GCL/IPL border with the exception of one short dendrite that terminated in the outer IPL (open arrow). Points marked 1, 2, and 3 (open arrowheads) indicate contacts shown enlarged in the boxes below the tracing. Upper box: Vertical view of the melanopsin cell soma (arrow) and dendrite traced from confocal optical sections. The melanopsin cell contacts DB6 bipolar cell axon terminals (shown in magenta) at a small dendritic swelling (1) and through two spine‐like projections (2, 3). Lower box: The same contacts (1–3) are shown in a flat view traced from whole‐mount confocal images. Magenta processes are DB6 bipolar cell axons. C: Confocal image of the same melanopsin cell shown in A with the focus near the GCL/IPL border on the soma (arrow) and the DB6 bipolar cell contacts (1–3) shown in B. Right panel: Optical vertical section taken at the location of the green vertical lines in the whole‐mount image, showing contact 1. Lower panels: Optical vertical sections taken at the locations of the magenta and green horizontal lines in the whole mount image, showing contacts 2 and 3. Scale bars = 100 µm in A,B; 20 µm in C; 10 µm in insets.
DB6 cone bipolar cells have bistratified axonal arbors, with the outer arbor much sparser than the inner arbor, consisting of only one or several short processes that stratify at the outermost border of the IPL where the dendrites of outer melanopsin cells stratify. The small outer axonal arbor is not readily apparent in all preparations, and it is unclear whether this is due to the quality of staining in various preparations or a result of not all DB6 bipolar cells exhibiting an outer axonal arbor. DB6 outer axonal processes are apparent in the tracings and photomicrographs of Golgi‐impregnated whole‐mount retina shown in Figure 13A–F and in vertical sections of macaque retina immunoreacted for the cell marker CD15 (Fig. 13A–H). The confocal image in Figure 13I shows a vertical section from macaque retina double labeled for melanopsin (green) and CD15 (magenta). The dendrite of an outer melanopsin cell (arrowheads) costratifies with the outer axonal process of a DB6 bipolar cell (arrow), indicating that the DB6 bipolar cell provides synaptic input to both inner and outer melanopsin cells.
Figure 13.
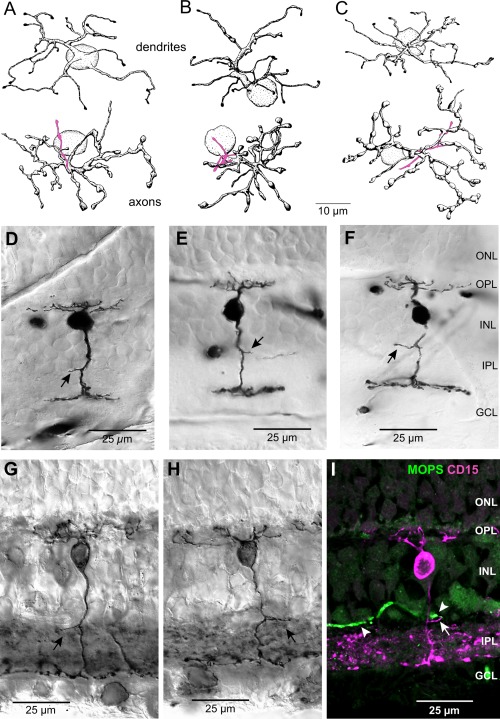
DB6 cone bipolar cells are bistratified, and their outer axonal processes costratify with the dendrites of the outer melanopsin cells. A–C: Tracings of three DB6 bipolar cells with bistratified axonal arbors from Golgi stained whole mount macaque retina. Dendritic arbors are shown at top and axonal arbors are shown below, with the short axonal processes that stratify near the outer border of the IPL shown in magenta. D–F: Micrographs of three DB6 bipolar cells in vertical sections from Golgi‐stained retina, showing the bistratified axonal arbors in the IPL. Arrows indicate short processes that stratify at the outer border of the IPL. The cell in F is the same as that shown in C. G,H: Two bipolar cells labeled with the DB6 bipolar cell marker CD15 in vertical sections of macaque retina. Arrows indicate the outer axonal processes. I: Confocal image from a vertical section of macaque retina labeled with antibodies to melanopsin (MOPS, green) and CD15 (magenta). The dendrite of an outer melanopsin cell (arrowheads) costratifies with the outer axonal process of a DB6 bipolar cell (arrow). Taken with the results illustrated in Figure 12, this finding suggests that DB6 bipolar cells provide synaptic input to both inner and outer melanopsin cells. Scale bars = 10 µm in A–C; 25 µm in D–I.
Dendritic spines
The dendrites of inner melanopsin cells often exhibited small spine‐like projections as shown in Figure 14. The presence of spines on the dendrites of inner melanopsin cells, however, was not always readily apparent. This may in part be due to variability in the quality of the immunostaining. The tracings and confocal images of Figure 12B,C offer another explanation. Inner melanopsin cell dendrites typically stratify very close to the GCL/IPL border and sometimes course through the GCL itself for some distance. The spines shown in Figure 12B,C projected vertically from the dendrite into the IPL to contact the axons of DB6 cells and would typically be difficult to see in whole‐mount retina. The photomicrographs in Figure 14 were taken in whole‐mount retina at high magnification from two inner melanopsin cells and show many spine‐like projections. The spines were very short, ranging in length from 3 to 6 µm. Some of the spines project horizontally in nearly the same plane as the dendrite (arrows). Others appear to project vertically into the IPL (arrowheads). It is likely that some if not all of the spines contact DB6 cone bipolar cells. Outer cell dendrites, however, were relatively smooth, and, although they had a few spine‐like projections, they did not exhibit the many small spines seen on the dendrites of inner cells.
Figure 14.
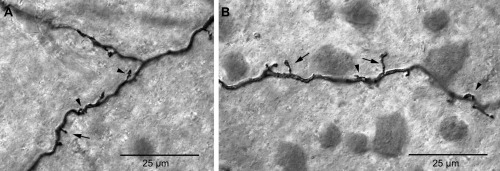
Spines of inner melanopsin cell dendrites. A,B: Dendrites of two melanopsin cells showing short spines 3–6 µm in length. Some spines project horizontally in nearly same plane of focus as the dendrites (arrows), although others project vertically from the dendrite into the IPL (arrowheads). Scale bars = 25 µm.
Intrinsic fluorescence
In whole‐mount in vitro preparations of macaque retina, a low‐density population of ganglion cells exhibits an intrinsic granular fluorescence visible in the cell body (Fig. 15A–C). When intracellularly filled with Neurobiotin and processed for HRP histochemistry, these cells exhibit the same soma and dendritic morphology and stratification as the melanopsin cell. One such cell is shown in the photomicrograph and tracing of Figure 15D,E. The cell was sparsely branched and had a very large dendritic tree (dendritic field diameter 893 µm) and soma (diameter 15 µm). The dendrites were stratified at the GCL/IPL border, with the exception of one short branch that crossed over to terminate in the outer IPL (Fig. 15E, open arrowhead). Intrinsic fluorescence in melanopsin cells made it possible to target these cells selectively in the unlabeled in vitro retina for physiological recording and intracellular tracer injection (Dacey et al., 2005).
Figure 15.
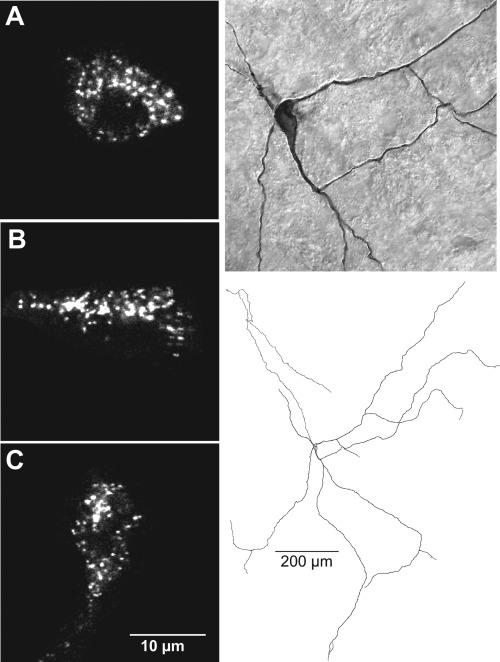
Intrinsic granular fluorescence in macaque melanopsin cells. A–C: Confocal images of intrinsic fluorescence in the somas of three large ganglion cells in whole‐mount retina. D: Photomicrograph of a melanopsin ganglion cell (arrow indicates soma) located 11.5 mm from the fovea. It was targeted in vitro by its intrinsic fluorescence and filled with Neurobiotin. E: Tracing of the complete dendritic tree of the cell shown in D. The arrow indicates the soma, and the solid arrowhead indicates the axon. The cell was sparsely branched and had a very large dendritic tree (dendritic field diameter 893 µm) and a soma diameter of 15 µm. The dendrites were stratified at the GCL/IPL border with the exception of one short branch that crossed over to terminate in the outer IPL (arrowhead). The injected cell was morphologically identical to the inner melanopsin cells. Scale bars = 10 µm in C (applies to A–C); 200 µm in E.
Tracer coupling
Seven inner stratifying melanopsin cells and one outer stratifying cell were targeted in the in vitro retina based on their intrinsic fluorescence and intracellularly injected with Neurobiotin. In four of the inner cells, the Neurobiotin revealed tracer coupling to a subset of cells with somas in the GCL or, rarely, the INL. No tracer coupling was apparent in the single outer cell. The quality of the labeling via tracer coupling was variable, but one injected inner melanopsin cell showed extensive coupling to a population of 51 cells (Fig. 16A–C). The tracer‐coupled cells were for the most part lightly stained, and none had a completely stained dendritic tree. Among the tracer‐coupled cells, 48 had small somas typical of amacrine cells (mean soma diameter ± SD 12 ± 1 µm; Fig. 16B). Among these cells, 43 had somas located in the GCL and five in the INL; they had two or three primary dendrites and sparse dendritic arbors. The remaining three tracer‐coupled cells had larger somas (diameter ± SD 16 ± 2 µm) located in the GCL. The somas were larger than those of most ganglion cells, falling within the range of the melanopsin cells (Fig. 16B), suggesting the possibility of homotypic tracer coupling. These coupled cells were very lightly labeled, and little morphology could be determined beyond the presence of three or four primary dendrites. No axons were seen, but this may be attributable to the light labeling.
Figure 16.
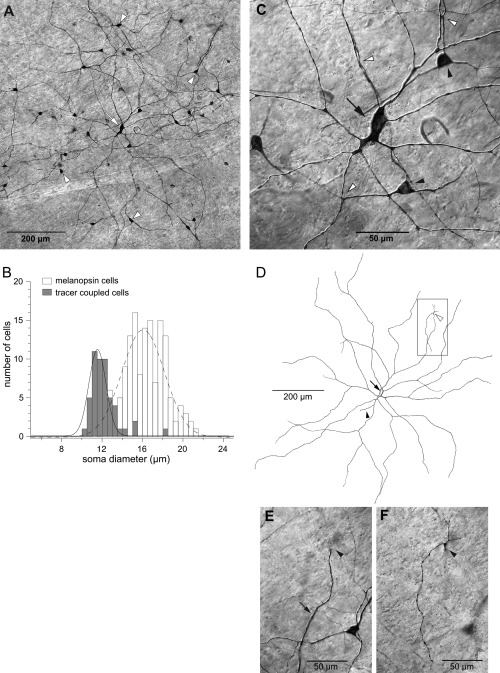
Melanopsin cells injected intracellularly with Neurobiotin show tracer coupling to a subset of amacrine and ganglion cells. A: An inner melanopsin cell (arrow) was targeted based on its intrinsic fluorescence and injected with Neurobiotin. It was surrounded by tracer coupled amacrine cells (arrowheads). B: Soma diameters of tracer‐coupled cells shown in A plotted as a histogram (shaded bars; n = 51) along with soma diameters of melanopsin cells (open bars; n = 262). Solid and dashed lines are Gaussian functions fit to the tracer‐coupled and melanopsin cell data, respectively. A single Gaussian function well describes the majority of the tracer coupled cells with the exception of three cells that lie to the right. C: Enlarged view of the melanopsin cell shown in A (arrow). Two tracer coupled amacrine cells are in focus (black arrowheads). Amacrine cell dendrites are closely apposed to the melanopsin cell dendrites in several places (white arrowheads). D: Tracing of the complete dendritic tree of the melanopsin cell shown in A (arrow indicates the soma; black arrowhead indicates the axon). The cell had a dendritic field diameter of 943 µm, soma diameter of 19 µm, and was located 12.5 mm from the fovea. The cell was primarily inner stratified; most of its dendrites were located near the GCL/IPL border, but one distal dendrite ascended to the outer border of the IPL (white arrowhead), where it branched into four short terminal dendrites. E: Photomicrograph of the boxed area in D. Focus is in the inner IPL on a dendrite of the melanopsin cell (arrow). The arrowhead indicates where the dendrite turns to ascend to the outer IPL. The soma of a tracer‐coupled amacrine cell can be seen to the right of the melanopsin cell dendrite. F: Same area shown in E. Focus is shifted to the outer IPL, where the melanopsin cell dendrite branches into four terminal dendrites (arrowhead). No amacrine cell processes appear to be associated with the melanopsin cell's outer dendrites. Scale bars = 10 µm in A,D; 50 µm in C,E,F.
Although it was not possible to make a detailed study of the dendritic morphology of the tracer‐coupled amacrine cells because of incomplete staining, some observations on dendritic stratification were possible. Amacrine cells whose dendrites could be followed for some distance appeared to be somewhat broadly stratified over a depth of ∼90–100% of the IPL (GCL border = 100%; INL border = 0%). Some amacrine cell dendrites were closely apposed to the injected ganglion cell dendrites near the GCL border (Fig. 16C). Some of the amacrine cells also had dendrites that stratified more narrowly at a depth of ∼65% of the IPL. This bistratified pattern appeared to be common, although in some cases only dendrites in the innermost stratum of the IPL could be clearly seen. Labeling in the outer IPL was very light, and only a few amacrine cell dendrites could be seen. The labeled amacrine cells with somas in the INL were generally too lightly labeled to determine stratification beyond proximal dendrites at the outer border of the IPL. However, two cells with somas in the INL also had dendrites stratifying in the inner IPL at ∼65% and ∼90–100% depth. Two of the cells with somas in the GCL that stratified at the 90–100% and 65% levels also had one long dendrite each that stratified in the outer IPL near the INL border. The uniformity of soma size and the pattern of dendritic stratification suggest that the tracer‐coupled cells with small somas represent a single population of multistratified amacrine cells. However, the incomplete staining of dendritic processes leaves open the possibility that another type of amacrine cell might also be represented.
A tracing of the complete dendritic tree of the melanopsin cell is shown in Figure 16D. Although the melanopsin cell was stratified primarily near the GCL border, one dendrite crossed to the outer IPL, where it formed four short terminal branches (Fig. 16D–F). No amacrine cell dendrites were associated with the melanopsin cell dendrites in the outer IPL.
DISCUSSION
The present study confirms and extends previous descriptions of melanopsin cells in primates (Hannibal et al., 2004; Dacey et al., 2005; Jusuf et al., 2007; Vugler et al., 2007; Grunert et al., 2011), providing additional evidence that there are two distinct morphological types, those with dendrites that are primarily or exclusively inner stratifying and those with dendrites that are primarily or exclusively outer stratifying. Both cell types are present at a very low spatial density, and the somas of each type form regular mosaics, with each set of dendrites covering the entire retina.
The somas and dendritic trees of melanopsin ganglion cells in macaque and human retinas are among the largest reported in primates. Some of the largest retinal ganglion cells previously described from primate retina can now be identified as melanopsin cells. In Golgi studies of human retina, the G20 cells precisely match the description of the inner stratifying melanopsin cells. The G21 cells also resemble melanopsin cells in that they had extremely large somas and large, sparse dendritic arbors and dendritic spines. However, the G21 cells were described as ramifying in the middle of the IPL. (Kolb et al., 1992). Very large human retinal ganglion cells labeled by intracellular injection of Neurobiotin can also now be identified as melanopsin cells. These include the “giant very sparse” cells and the “axon collateral‐bearing” cells described previously (Peterson and Dacey, 1998, 1999). In macaque retina, two types of ganglion cells injected with Neurobiotin can be identified as inner stratifying melanopsin cells based on their large soma, sparse dendritic branching, and stratification in the innermost stratum of the IPL. These include the “large very sparse cell” and the “fine very sparse cell” (Yamada et al., 2005). The differences between the two could be explained by differences in eccentricity; the values of their branch point numbers and dendritic field fall within the ranges reported here for macaque retinas.
One example of a melanopsin cell dendrite ascending into the OPL was seen in a vertical section of macaque immunolabeled retina; the dendrite originated from an outer stratifying cell with a soma in the INL. Dendrites like these are also very rare in adult mouse retinas (Hattar et al., 2002). Dendrites of melanopsin cells projecting to the OPL are much more common during early postnatal development of mouse retina, however, and they originate from M1 cells, the likely homologues of outer stratifying macaque melanopsin cells (Renna et al., 2014). Therefore, it is likely that the rare “biplexiform” melanopsin cells in primates are anomalous remnants from the developing retina.
From cell counts in the human retina we estimated that the melanopsin cells made up 0.4% of all human ganglion cells, but in two earlier studies human melanopsin cells made up from 0.8% (Hannibal et al., 2004) to 1.5% (La Morgia et al., 2010) of all ganglion cells. It is uncertain whether this discrepancy is due to differences between individual retinas, variations in the labeling methods, or both. In any case, only a very small percentage of all human retinal ganglion cells are melanopsin cells. In macaque, the cell density was similarly low, with melanopsin cells accounting for only 0.2% of the total ganglion cells. Low spatial density has also been reported for melanopsin‐immunoreactive ganglion cells in mouse retina (Hattar et al., 2006; Berson et al., 2010).
Two types of melanopsin cells
Both types of melanopsin cells in primates had large somas and large, sparsely branched dendritic trees, but there were clear morphological differences between the two types. The dendritic trees of inner stratifying cells were significantly more highly branched than those of outer stratifying cells. A similar disparity in dendritic branching has been reported for mouse retina, in which M2 cells (likely homologues of the inner stratifying primate melanopsin cells) were more highly branched than M1 cells (Berson et al., 2010). Primate inner stratifying cells also had significantly larger somas than outer cells, and the two types also differed in the typical locations of their somas. Inner cells always had somas located in the GCL, whereas the majority of outer cells had somas in the INL. However, a substantial number, 15% of all melanopsin cells in the macaque retina and 23% in the human, were outer stratifying cells with somas in the GCL. Thus, the position of the soma was not always a reliable indicator of the melanopsin cell type. For marmoset retina, Jusuf et al. (2007) found that outer stratifying melanopsin ganglion cells could have somas located in either the GCL or the INL, whereas the somas of inner stratifying cells were always located in the GCL. Similar findings have also been reported for mouse retina, in which the M1 cells often had somas displaced to the INL whereas the M2 cells never did (Berson et al., 2010).
The dendrites of the inner stratifying cells typically had short spines, a feature of melanopsin ganglion cells described for the first time here, whereas the dendrites of the outer cells were primarily smooth with few spines. The dendrites of the melanopsin cells were confined to two plexuses, one in the innermost stratum of the IPL and another in the outermost stratum. A quantitative analysis indicated that the two plexuses were independent, providing additional evidence that there were two distinct types of melanopsin cells. Occasionally, a dendrite from an outer stratifying cell descended to the inner plexus or a dendrite from an inner stratifying cell ascended to the outer plexus. The dendrites did not ramify in any of the intervening strata of the IPL. As a result, approximately 89% of the outer plexus consisted of dendrites of primarily or exclusively outer stratifying cells in both human and macaque retinas. The composition of the inner plexus was slightly different in the two species. In the macaque, 99% of the inner plexus originated from primarily or exclusively inner stratifying cells, although, in the human, the proportion was smaller, approximately 91%. There was, however, no evidence in primate for a distinct bistratified type of melanopsin cell with dendritic trees that uniformly tile the retina without leaving any gaps in the dendritic plexus, a generally accepted criterion for classifying cells as forming a discrete cell type (Wässle, 2004).
In mice, melanopsin cells with dendrites in both strata of the IPL, the M3 cells, have been described as bistratified cells. These include cells with most of their dendrites in the outer stratum, cells with most of their dendrites in the inner stratum, and cells with approximately half of their dendrites in each stratum. Despite this variability in their dendritic stratification patterns, their light responses and membrane properties were very similar to one another and closely resembled M2 cells though not M1 cells (Schmidt et al., 2011; Schmidt and Kofuji, 2011). Another recent article, however, argued that M3 cells were not a distinct cell type because they are very sparsely distributed and do not form a separate mosaic that tiles the retina uniformly (Berson et al., 2010), a finding in agreement with the present study. Electrophysiological experiments will be required to determine whether the primate melanopsin cells with dendrites in both strata of the IPL have distinctive physiological properties similar to those reported for mouse M3 cells (Schmidt and Kofuji, 2011).
The two types of melanopsin cells in macaque retina also appeared to express the photopigment at different protein levels because, under the conditions that we used for electron microscopy, only the outer stratifying melanopsin cells were labeled. Based on results from rodents, it is likely that the level of melanopsin in the inner stratifying cells was below the threshold for detection using this technique. The M1 cell type has higher levels of the photopigment and, in the absence of synaptic input, a greater absolute sensitivity to light than M2 cells (Do and Yau, 2010; Schmidt et al., 2011). Thus rodent M1 and M2 cells appear to be homologues of macaque outer and inner stratifying melanopsin cells, respectively.
Previous studies with transgenic mouse models have reported that the M1 and M2 cells have differential projections to the LGN as indicated by whether the reporter gene used in the study labeled only M1 cells, resulting in no labeling in the dLGN, or all five melanopsin‐expressing cell types, including the M2 cells, in which case extensive melanopsin cell projections were found in the dLGN (Hattar et al., 2006; Brown et al., 2010; Ecker et al., 2010). In macaque the situation appears to be different. We found that melanopsin cells retrogradely labeled from tracer injection in the dLGN included both inner (presumed M2 homologue) and outer (presumed M1 homologue) stratifying cell types.
The inner and outer stratifying melanopsin cells also meet additional criteria for the definition of distinct neuronal types in that their somas had regular distributions and their dendrites covered the retina uniformly. The analysis of the spatial distribution of the somas of melanopsin cells confirmed that the inner and the outer stratifying melanopsin cells were two distinct types. The regularity index calculated from the soma distribution was low when the two populations were combined, but it was higher when the two populations were considered separately. The coverage factor for each type was approximately two, which indicates that each point on the retina, on average, provides input to the dendrites of two outer and two inner melanopsin cells. In mice a much higher coverage factor has been reported for both M1 cells (3.8) and M2 cells (4.6; Berson et al., 2010). For marmoset, however, Jusuf et al. (2007) found that melanopsin ganglion cells “tile the retina with little overlap.” Berson et al. point out that their coverage estimate for mouse melanopsin cells is also much higher than reported for other ganglion cell types in species other than the mouse, and the question remains of whether this higher coverage is also unusual among mouse ganglion cell types.
Inputs to melanopsin ganglion cells from bipolar cells
The electron microscopic immunolabeling experiments provided direct evidence for excitatory input from bipolar cells to the outer stratifying type of melanopsin ganglion cells. The presynaptic bipolar cells are certainly driven by cones; in double immunolabeling experiments, no contacts were seen between melanopsin dendrites and rod bipolar cell axons labeled with antibodies to PKCα, a finding in keeping with a previous study in macaque retina by Grünert et al. (2011). The presynaptic bipolar cells are expected to have ON responses to light based on the light responses of the melanopsin cells in macaques. The double‐labeling experiments with CD15 antibody provide evidence that one of the presynaptic bipolar cells is the DB6 type, whose axons terminate in the innermost stratum of the IPL, as expected for an ON bipolar cell. Synapses onto the outer stratifying dendrites were made en passant, as the DB6 axons descended in the IPL. These findings that DB6 cells contact both inner and outer melanopsin ganglion cell axons confirm the results of previous experiments in macaque and marmoset retinas (Grunert et al., 2011). The analysis of DB6 bipolar cells stained by the Golgi method confirmed that short, presynaptic processes in the outermost stratum of the IPL are a regular feature of DB6 axons. In this regard, the macaque was similar to the mouse and the rabbit, in which ON cone bipolar cells make synapses en passant with outer stratifying melanopsin ganglion cell dendrites (Dumitrescu et al., 2009; Hoshi et al., 2009; Lauritzen et al., 2013). Another candidate to provide excitatory input to the dendrites of outer stratifying melanopsin ganglion cells is the ON bipolar cell that selectively contacts short wavelength‐sensitive cones. This type of bipolar cell also makes en passant synapses onto ganglion cell dendrites in the outermost 10% of the macaque IPL (Calkins et al., 1998).
There were many more contacts between DB6 axon terminals and the dendrites of inner stratifying melanopsin ganglion cell dendrites, and some of the contacts were onto dendritic spines. The contacts are known to be sites of ribbon synapses in macaque and marmoset retinas (Jusuf et al., 2007; Grunert et al., 2011), and one of the inner melanopsin cells in the present study received approximately 170 of these synapses. Bipolar cell synapses onto dendrites of melanopsin cells in the inner stratum of the mouse retina have been described via electron microscopy previously (Belenky et al., 2003). Excitatory inputs from bipolar cells to melanopsin cells of rodents have also been described in several electrophysiological studies (Perez‐Leon et al., 2006; Wong et al., 2007; Dumitrescu et al., 2009; Schmidt and Kofuji, 2010; Reifler et al., 2015).
Inputs to melanopsin ganglion cells from amacrine cells
The electron microscopic immunolabeling studies also provided direct evidence of input to outer stratifying melanopsin ganglion cell dendrites from amacrine cells. These were similar to the synapses from amacrine cells onto the dendrites of melanopsin dendrites in the outer stratum of the mouse IPL (Belenky et al., 2003). Based on an anatomical study of the neurotransmitter receptors of melanopsin cells in macaque retina, these are expected to include both GABAergic and glycinergic amacrine cells (Neumann et al., 2011). One of the presynaptic amacrine cells was likely the type that contains dopamine. In double‐immunolabeling experiments with antibodies to TH, extensive contacts between axons of dopaminergic amacrine cells and the dendrites and somas of melanopsin cells were observed in the outermost stratum of the IPL. Based on the descriptions of the morphology of melanopsin ganglion cells in this study, all of the somas and approximately 90% of the dendrites there were from the outer stratifying type. The contacts were very similar to those described previously in human and rat retinas (Ostergaard et al., 2007; Vugler et al., 2007). There is also evidence for dopaminergic input to melanopsin ganglion cells from retrograde viral tracing studies in the mouse (Viney et al., 2007). There is physiological evidence for dopaminergic synapses onto melanopsin cells in rodents. Acting through D2 receptors, dopamine elevates the levels of mRNA of both PACAP and melanopsin in rat retina (Sakamoto et al., 2005). Dopamine also reduces the melanopsin‐mediated component of the photocurrent of intrinsically photosensitive ganglion cells from rat retina via D1 receptors. The effect is direct; it is also observed in dissociated ganglion cells, identified by retrograde labeling from the hypothalamus (Van Hook et al., 2012).
The tracer‐coupling experiments provided evidence of electrical synapses between inner stratifying macaque melanopsin ganglion cells and a subset of amacrine cells. Tracer coupling was observed in four of seven inner stratifying melanopsin cells that were targeted for intracellular injection in vitro by their autofluorescence and filled with Neurobiotin. In rat retina, these electrical synapses appear to be functional. Although amacrine cells do not contain any known photopigments, some rat amacrine cells with somas in the GCL had sustained responses to light after chemical synaptic transmission was blocked (Reifler et al., 2015). In one macaque inner cell, the tracer coupling was robust enough to label a large number of amacrine cells and many of their higher order dendrites. The coupled amacrine cells appeared to be a single, multistratified type, whose somas were found mainly in the GCL, but it was not possible to characterize their morphology fully because they were incompletely labeled. Several types of multistratified amacrine cells have been described for human and macaque retinas (Mariani, 1990; Kolb et al., 1992), but none seems to match this description precisely. The amacrine cells coupled to the M2 ganglion cells of mouse retina, the likely homologues of the inner cells, were a different morphological type. The mouse amacrine cells had relatively small dendritic arbors and multiple axons (Muller et al., 2010).
CONCLUSIONS
There are many similarities between melanopsin ganglion cells in human and macaque and those described in other species, including a low spatial density, dendritic stratification and branching pattern, soma size and location, and synaptic input from bipolar and amacrine cells, with the mouse M1 and M2 cells being the likely homologues of the primate outer and inner stratifying melanopsin cells, respectively. The present data, however, also point to several differences. We find no evidence in macaque or human for a separate, distinct bistratified melanopsin cell type as has been suggested for mouse retina (Schmidt et al., 2011; Schmidt and Kofuji, 2011). Additionally, our data from macaque melanopsin cells retrogradely labeled from tracer injections in the LGN indicate that in primate both inner and outer stratifying melanopsin cells project to the dLGN, although in mouse the majority of melanopsin ganglion cell innervation of the dLGN appears to be provided by only inner stratifying cells (Hattar et al., 2006; Brown et al., 2010; Ecker et al., 2010).
Both types of melanopsin cells in primates depolarize in response to increments in light intensity (Dacey et al., 2005), but the light responses of outer cells are not as well characterized as those of the inner cells. Future experiments will be aided by the finding that melanopsin cells exhibit an autofluorescence allowing them to be specifically targeted in the in vitro preparation for physiological recording.
CONFLICT OF INTEREST STATEMENT
The authors state there are no conflicts of interest.
ROLE OF AUTHORS
All authors had full access to all of the data in the study and take responsibility for the integrity of the data and the accuracy of the data analysis. Study concept and design: H‐WL, BBP, K‐WY, DMD, PDG. Acquisition of data: H‐WL, XR, BBP, DWM, DMD. Analysis and interpretation of data: H‐WL, XR, BBP, DWM, K‐WY, PDG, DMD. Melanopsin antibody characterization: XR. Drafting of the manuscript: H‐WL, XR, BBP, DWM, K‐WY, PDG, DMD. Obtained funding: DMD, K‐WY, PDG, DWM.
ACKNOWLEDGMENTS
We thank Dr. Christine Curcio and the Age‐Related Maculopathy Histopathology Laboratory (supported by the International Retinal Research Foundation, the National Eye Institute [EY06109] and the Vision Science Research Center [EY03039]), University of Alabama at Birmingham, for the human retina used in the immunohistochemical study. Macaque retinas were provided by the Tissue Distribution Program of the National Primate Research Center at the University of Washington (RR00166). We are grateful to Dr. Orin S. Packer for assistance with the statistical analyses and Ms. Toni Haun for technical assistance.
LITERATURE CITED
- Belenky MA, Smeraski CA, Provencio I, Sollars PJ, Pickard GE. 2003. Melanopsin retinal ganglion cells receive bipolar and amacrine cell synapses. J Comp Neurol 460:380–393. [DOI] [PubMed] [Google Scholar]
- Berson DM, Dunn FA, Takao M. 2002. Phototransduction by retinal ganglion cells that set the circadian clock. Science 295:1070–1073. [DOI] [PubMed] [Google Scholar]
- Berson DM, Castrucci AM, Provencio I. 2010. Morphology and mosaics of melanopsin‐expressing retinal ganglion cell types in mice. J Comp Neurol 518:2405–2422. [DOI] [PMC free article] [PubMed] [Google Scholar]
- Boycott BB, Dowling JE. 1969. Organization of the primate retina: light microscopy. Philos Trans R Soc Lond B Biol Sci 255:109–184. [DOI] [PubMed] [Google Scholar]
- Brown TM, Gias C, Hatori M, Keding SR, Semo M, Coffey PJ, Gigg J, Piggins HD, Panda S, Lucas RJ. 2010. Melanopsin contributions to irradiance coding in the thalamo‐cortical visual system. PLoS Biol 8:e1000558. [DOI] [PMC free article] [PubMed] [Google Scholar]
- Calkins DJ, Tsukamoto Y, Sterling P. 1998. Microcircuitry and mosaic of a blue‐yellow ganglion cell in the primate retina. J Neurosci 18:3373–3385. [DOI] [PMC free article] [PubMed] [Google Scholar]
- Chan TL, Martin PR, Grunert U. 2001. Immunocytochemical identification and analysis of the diffuse bipolar cell type DB6 in macaque monkey retina. Eur J Neurosci 13:829–832. [DOI] [PubMed] [Google Scholar]
- Cowan NJ, Dobner PR, Fuchs EV, Cleveland DW. 1983. Expression of human alpha‐tubulin genes: interspecies conservation of 3′ untranslated regions. Mol Cell Biol 3:1738–1745. [DOI] [PMC free article] [PubMed] [Google Scholar]
- Curcio CA, Allen KA. 1990. Topography of ganglion cells in human retina. J Comp Neurol 300:5–25. [DOI] [PubMed] [Google Scholar]
- Dacey DM. 1990. The dopaminergic amacrine cell. J Comp Neurol 301:461–489. [DOI] [PubMed] [Google Scholar]
- Dacey DM, Lee BB. 1994. The ‘blue‐on’ opponent pathway in primate retina originates from a distinct bistratified ganglion cell type. Nature 367:731–735. [DOI] [PubMed] [Google Scholar]
- Dacey DM, Peterson BB, Robinson FR, Gamlin PD. 2003. Fireworks in the primate retina: in vitro photodynamics reveals diverse LGN‐projecting ganglion cell types. Neuron 37:15–27. [DOI] [PubMed] [Google Scholar]
- Dacey DM, Liao HW, Peterson BB, Robinson FR, Smith VC, Pokorny J, Yau KW, Gamlin PD. 2005. Melanopsin‐expressing ganglion cells in primate retina signal colour and irradiance and project to the LGN. Nature 433:749–754. [DOI] [PubMed] [Google Scholar]
- Dkhissi‐Benyahya O, Rieux C, Hut RA, Cooper HM. 2006. Immunohistochemical evidence of a melanopsin cone in human retina. Invest Ophthalmol Vis Sci 47:1636–1641. [DOI] [PubMed] [Google Scholar]
- Do MT, Yau KW. 2010. Intrinsically photosensitive retinal ganglion cells. Physiol Rev 90:1547–1581. [DOI] [PMC free article] [PubMed] [Google Scholar]
- Dumitrescu ON, Pucci FG, Wong KY, Berson DM. 2009. Ectopic retinal ON bipolar cell synapses in the OFF inner plexiform layer: contacts with dopaminergic amacrine cells and melanopsin ganglion cells. J Comp Neurol 517:226–244. [DOI] [PMC free article] [PubMed] [Google Scholar]
- Ecker JL, Dumitrescu ON, Wong KY, Alam NM, Chen SK, LeGates T, Renna JM, Prusky GT, Berson DM, Hattar S. 2010. Melanopsin‐expressing retinal ganglion‐cell photoreceptors: cellular diversity and role in pattern vision. Neuron 67:49–60. [DOI] [PMC free article] [PubMed] [Google Scholar]
- Grunert U, Jusuf PR, Lee SC, Nguyen DT. 2011. Bipolar input to melanopsin containing ganglion cells in primate retina. Vis Neurosci 28:39–50. [DOI] [PubMed] [Google Scholar]
- Hannibal J, Hindersson P, Ostergaard J, Georg B, Heegaard S, Larsen PJ, Fahrenkrug J. 2004. Melanopsin is expressed in PACAP‐containing retinal ganglion cells of the human retinohypothalamic tract. Invest Ophthalmol Vis Sci 45:4202–4209. [DOI] [PubMed] [Google Scholar]
- Hannibal J, Kankipati L, Strang CE, Peterson BB, Dacey D, Gamlin PD. 2014. Central projections of intrinsically photosensitive retinal ganglion cells in the macaque monkey. J Comp Neurol 522:2231–2248. [DOI] [PMC free article] [PubMed] [Google Scholar]
- Hattar S, Liao HW, Takao M, Berson DM, Yau KW. 2002. Melanopsin‐containing retinal ganglion cells: architecture, projections, and intrinsic photosensitivity. Science 295:1065–1070. [DOI] [PMC free article] [PubMed] [Google Scholar]
- Hattar S, Kumar M, Park A, Tong P, Tung J, Yau K, Berson D. 2006. Central projections of melanopsin‐expressing retinal ganglion cells in the mouse. J Comp Neurol 497:326–349. [DOI] [PMC free article] [PubMed] [Google Scholar]
- Hoshi H, Liu WL, Massey SC, Mills SL. 2009. ON inputs to the OFF layer: bipolar cells that break the stratification rules of the retina. J Neurosci 29:8875–8883. [DOI] [PMC free article] [PubMed] [Google Scholar]
- Joo HR, Peterson BB, Dacey DM, Hattar S, Chen SK. 2013. Recurrent axon collaterals of intrinsically photosensitive retinal ganglion cells. Vis Neurosci 30:175–182. [DOI] [PMC free article] [PubMed] [Google Scholar]
- Jusuf PR, Lee SC, Hannibal J, Grunert U. 2007. Characterization and synaptic connectivity of melanopsin‐containing ganglion cells in the primate retina. Eur J Neurosci 26:2906–2921. [DOI] [PubMed] [Google Scholar]
- Kolb H, Linberg KA, Fisher SK. 1992. Neurons of the human retina: a Golgi study. J Comp Neurol 318:147–187. [DOI] [PubMed] [Google Scholar]
- La Morgia C, Ross‐Cisneros FN, Sadun AA, Hannibal J, Munarini A, Mantovani V, Barboni P, Cantalupo G, Tozer KR, Sancisi E, Salomao SR, Moraes MN, Moraes‐Filho MN, Heegaard S, Milea D, Kjer P, Montagna P, Carelli V. 2010. Melanopsin retinal ganglion cells are resistant to neurodegeneration in mitochondrial optic neuropathies. Brain 133:2426–2438. [DOI] [PMC free article] [PubMed] [Google Scholar]
- Lauritzen JS, Anderson JR, Jones BW, Watt CB, Mohammed S, Hoang JV, Marc RE. 2013. ON cone bipolar cell axonal synapses in the OFF inner plexiform layer of the rabbit retina. J Comp Neurol 521:977–1000. [DOI] [PMC free article] [PubMed] [Google Scholar]
- Lucas RJ. 2013. Mammalian inner retinal photoreception. Curr Biol 23:R125–R133. [DOI] [PubMed] [Google Scholar]
- Mariani AP. 1990. Amacrine cells of the rhesus monkey retina. J Comp Neurol 301:382–400. [DOI] [PubMed] [Google Scholar]
- Marshak DW, Aldrich LB, Del Valle J, Yamada T. 1990. Localization of immunoreactive cholecystokinin precursor to amacrine cells and bipolar cells of the macaque monkey retina. J Neurosci 10:3045–3055. [DOI] [PMC free article] [PubMed] [Google Scholar]
- Molday LL, Molday RS. 2014. 1D4: a versatile epitope tag for the purification and characterization of expressed membrane and soluble proteins. Methods Mol Biol 1177:1–15. [DOI] [PMC free article] [PubMed] [Google Scholar]
- Molday RS, MacKenzie D. 1983. Monoclonal antibodies to rhodopsin: characterization, cross‐reactivity, and application as structural probes. Biochemistry 22:653–660. [DOI] [PubMed] [Google Scholar]
- Muller LP, Do MT, Yau KW, He S, Baldridge WH. 2010. Tracer coupling of intrinsically photosensitive retinal ganglion cells to amacrine cells in the mouse retina. J Comp Neurol 518:4813–4824. [DOI] [PMC free article] [PubMed] [Google Scholar]
- Neumann S, Haverkamp S, Auferkorte ON. 2011. Intrinsically photosensitive ganglion cells of the primate retina express distinct combinations of inhibitory neurotransmitter receptors. Neuroscience 199:24–31. [DOI] [PubMed] [Google Scholar]
- Ostergaard J, Hannibal J, Fahrenkrug J. 2007. Synaptic contact between melanopsin‐containing retinal ganglion cells and rod bipolar cells. Invest Ophthalmol Vis Sci 48:3812–3820. [DOI] [PubMed] [Google Scholar]
- Perez‐Leon JA, Warren EJ, Allen CN, Robinson DW, Brown RL. 2006. Synaptic inputs to retinal ganglion cells that set the circadian clock. Eur J Neurosci 24:1117–1123. [DOI] [PMC free article] [PubMed] [Google Scholar]
- Perry VH, Cowey A. 1985. The ganglion cell and cone distributions in the monkey's retina: implications for central magnification factors. Vis Res 25:1795–1810. [DOI] [PubMed] [Google Scholar]
- Peterson BB, Dacey DM. 1998. Morphology of human retinal ganglion cells with intraretinal axon collaterals. Vis Neurosci 15:377–387. [DOI] [PubMed] [Google Scholar]
- Peterson BB, Dacey DM. 1999. Morphology of wide‐field, monostratified ganglion cells of the human retina. Vis Neurosci 16:107–120. [DOI] [PubMed] [Google Scholar]
- Provencio I, Rodriguez IR, Jiang G, Hayes WP, Moreira EF, Rollag MD. 2000. A novel human opsin in the inner retina. J Neurosci 20:600–605. [DOI] [PMC free article] [PubMed] [Google Scholar]
- Reifler AN, Chervenak AP, Dolikian ME, Benenati BA, Meyers BS, Demertzis ZD, Lynch AM, Li BY, Wachter RD, Abufarha FS, Dulka EA, Pack W, Zhao X, Wong KY. 2015. The rat retina has five types of ganglion‐cell photoreceptors. Exp Eye Res 130:17–28. [DOI] [PMC free article] [PubMed] [Google Scholar]
- Renna JM, Chellappa D, Ross C, Stabio M, Berson D. 2014. Melanopsin ganglion cells extend dendrites into the outer retina during early postnatal development. Dev Neurobiol [E‐pub ahead of print]. [DOI] [PMC free article] [PubMed] [Google Scholar]
- Rodieck RW. 1989. Starburst amacrine cells of the primate retina. J Comp Neurol 285:18–37. [DOI] [PubMed] [Google Scholar]
- Sakamoto K, Liu C, Kasamatsu M, Pozdeyev NV, Iuvone PM, Tosini G. 2005. Dopamine regulates melanopsin mRNA expression in intrinsically photosensitive retinal ganglion cells. Eur J Neurosci 22:3129–3136. [DOI] [PubMed] [Google Scholar]
- Schmidt TM, Kofuji P. 2010. Differential cone pathway influence on intrinsically photosensitive retinal ganglion cell subtypes. J Neurosci 30:16262–16271. [DOI] [PMC free article] [PubMed] [Google Scholar]
- Schmidt TM, Kofuji P. 2011. Structure and function of bistratified intrinsically photosensitive retinal ganglion cells in the mouse. J Comp Neurol 519:1492–1504. [DOI] [PMC free article] [PubMed] [Google Scholar]
- Schmidt TM, Do MT, Dacey D, Lucas R, Hattar S, Matynia A. 2011. Melanopsin‐positive intrinsically photosensitive retinal ganglion cells: from form to function. J Neurosci 31:16094–16101. [DOI] [PMC free article] [PubMed] [Google Scholar]
- Van Hook MJ, Wong KY, Berson DM. 2012. Dopaminergic modulation of ganglion‐cell photoreceptors in rat. Eur J Neurosci 35:507–518. [DOI] [PMC free article] [PubMed] [Google Scholar]
- Vaney DI. 1992. Photochromic intensification of diaminobenzidine reaction product in the presence of tetrazolium salts: applications for intracellular labeling and immunohistochemistry. J Neurosci Methods 44:217–223. [DOI] [PubMed] [Google Scholar]
- Viney TJ, Balint K, Hillier D, Siegert S, Boldogkoi Z, Enquist LW, Meister M, Cepko CL, Roska B. 2007. Local retinal circuits of melanopsin‐containing ganglion cells identified by transsynaptic viral tracing. Curr Biol CB 17:981–988. [DOI] [PubMed] [Google Scholar]
- Vugler AA, Redgrave P, Semo M, Lawrence J, Greenwood J, Coffey PJ. 2007. Dopamine neurones form a discrete plexus with melanopsin cells in normal and degenerating retina. Exp Neurol 205:26–35. [DOI] [PubMed] [Google Scholar]
- Wässle H. 2004. Parallel processing in the mammalian retina. Nat Rev Neurosci 5:747–757. [DOI] [PubMed] [Google Scholar]
- Wässle H, Riemann HJ. 1978. The mosaic of nerve cells in the mammalian retina. Proc R Soc Lond B Biol Sci 200:441–461. [DOI] [PubMed] [Google Scholar]
- Wong KY, Dunn FA, Graham DM, Berson DM. 2007. Synaptic influences on rat ganglion‐cell photoreceptors. J Physiol 582:279–296. [DOI] [PMC free article] [PubMed] [Google Scholar]
- Yamada ES, Bordt AS, Marshak DW. 2005. Wide‐field ganglion cells in macaque retinas. Vis Neurosci 22:383–393. [DOI] [PMC free article] [PubMed] [Google Scholar]