

Abstract
Background
Chemokine C-C motif ligand 1 (CCL1) accumulates C-C motif chemokine receptor 8 positive leukocytes to the inflammatory sites. Single-nucleotide polymorphisms in the chemokine CCL1 gene are associated with exacerbation of chronic obstructive lung disease. However, it is unclear whether CCL1 has immunomodulatory functions during pulmonary inflammation. This study aimed to elucidate this issue using newly generated transgenic mice that express CCL1 in the lungs (SPC-CCL1 mice).
Methods
To evaluate the phenotypes of these mice, lung section and bronchoalveolar lavage (BAL) fluid analyses were performed. We intratracheally administered lipopolysaccharide (LPS) or Mycobacterium bovis as a model of acute or chronic lung inflammation, respectively.
Results
No histological differences were observed between lung tissue from SPC-CCL1 Tg and wild-type mice in the resting condition and after LPS administration. In the resting condition, the total BAL cell concentration was lower in SPC-CCL1 Tg mice than in wild-type mice (P = 0.0097). Flow cytometric analyses showed that SPC-CCL1 Tg mice had fewer F4/80-positive cells than wild-type mice (P = 0.0278). After intratracheal LPS administration, CCL1 overexpression changed neither the total numbers nor population of BAL cells. After mycobacterial administration, pulmonary granuloma formation was significantly enhanced. The degree of Immunostaining for endoplasmic reticulum to nucleus signaling 1, a molecule associated with granuloma formation and endoplasmic reticulum stress, was significantly enhanced in the granuloma regions of SPC-CCL1 mice treated with Mycobacterium, compared to those of wild-type mice.
Conclusions
CCL1 overexpression in the lungs did not change the acute inflammatory response induced by LPS, but enhanced granuloma formation after mycobacterial treatment, possibly through enhancing endoplasmic reticulum stress.
Keywords: CCL1, Mycobacterium bovis, Granuloma, Endoplasmic reticulum stress, Lipopolysaccharide, Gene targeted mouse
Background
Chemokines constitute a family of mediators of inflammation and immunity, which are specifically involved in the regulation of immune defense and in immune system housekeeping (Baggiolini 2001; Teran 2000). Chemokine C-C motif ligand 1 (CCL1) is one of the genes that reside in a CCL subfamily chemokine gene cluster on chromosome 17q11.2-q12 in humans (Rollins 1997). CCL1 is known to be produced by activated monocytes/macrophages, T lymphocytes (Th1, Th2, Tc), and endothelial cells (Rollins 1997; Tiffany et al. 1997; Wilson et al. 1988). It mainly acts as a potent chemoattractant for monocytes/macrophages, lymphocytes, and neutrophils and is thought to play a major role in inflammatory processes (Luo et al. 1996; Miller and Krangel 1992; Rollins 1997). Furthermore, C-C motif chemokine receptor 8 (CCR8), a receptor of CCL1, is known to be expressed in monocytes/macrophages, Th2, and regulatory T lymphocytes (Treg) (Rollins 1997; Trebst et al. 2003; Zingoni et al. 1998).
Prior to this study, we demonstrated that single-nucleotide polymorphisms (SNPs) in the CCL1 gene are associated with chronic obstructive pulmonary disease (COPD) exacerbation (Takabatake et al. 2006), that is mainly caused by respiratory tract infection and induces acute worsening of symptoms from the usual stable state (Hurst et al. 2006; Patel et al. 2002; Wilkinson et al. 2006). Carriage of the risk allele for this SNP (National Center for Biotechnology Information SNP: rs2282691: A allele) predisposes patients with COPD to exacerbation. In contrast, carriage of another allele (the T allele) is associated with relative protection from exacerbation (Takabatake et al. 2006). Because this SNP is located in the promoter region of the CCL1 gene, where the C/EBPβ transcription factor binds, this phenomenon appears to be determined by differences in affinity between C/EBPβ and the DNA motif (Takabatake et al. 2006). C/EBPβ is a key transcription factor for acute-phase molecules in response to acute lung injury or infection, and the cardinal role of C/EBPβ is to up-regulate a set of C/EBPβ-regulated genes, including the CCL1 gene, leading to the subsequent activation of the innate immune system and inflammatory response (Didon et al. 2005; Poli 1998). CCL1 has been suggested to play a key role in host defense mechanisms, and up-regulation of CCL1 may defend against infections.
Although the role of CCL1 are investigated, it is still unclear how CCL1 modulates acute and chronic inflammations in the lung. Therefore, we sought to clarify the roles of CCL1 in the lung using newly engineered transgenic (Tg) mice (SPC-CCL1 Tg mice). We evaluated the phenotype of these mice and the in vivo effects of CCL1 overexpression on acute and chronic lung inflammation.
Methods
Construction of the SPC-CCL1 plasmid vector
The 3.7 hSP-C/SV-40 plasmid used in this study was kindly provided by Jeffrey A. Whitsett, (Children’s Hospital Medical Center, Cincinnati, Ohio, USA) (Glasser et al. 1988, 1991). This plasmid is composed of a 3.7-kb flanking sequence of the human SP-C promoter and the SV-40 small T intron as a polyadenylation signal (Geraci et al. 1999; Korfhagen et al. 1990). This construct enables specific expression of transgenes in the distal lung epithelium and alveoli (Geraci et al. 1999; Glasser et al. 1991).
The murine CCL1 mRNA sequence was ascertained by searching the NCBI library (NM_011329) and the Ensembl genome browser (ENSMUSG00000020702). The mRNA of murine CCL1 consists of 514 bp, including the untranslated region and the coding sequence. We prepared an insert genome sequence comprising 283 bp, including the entire coding sequence, and added restriction enzyme sites, SalI (GTCGAC) and EcoRI (GAATTC), before and after the sequence. Invitrogen™ assisted in sequence manufacture. The murine CCL1 cDNA was cloned into the SalI/EcoRI restriction site of the 3.7 hSP-C/SV-40 plasmid, creating the SPC-CCL1 cDNA fusion gene (Fig. 1a). The proper orientation of the plasmid was confirmed using an ABI PRISM 3130 Genetic Analyzer, and polymerase chain reaction (PCR) using Platinum Taq DNA polymerase (Invitrogen, Carlsbad, CA, USA) using specific primers. We designed specific primers across the sequence of CCL1 and SV40 DNA (forward: TGT CCC TCT CCT ACG GAC AC, reverse: CCA CAG AAG TAA GGT TCC TTC ACA). These primers were also used to verify the genomic DNA sequence of the transgene in vivo.
Fig. 1.
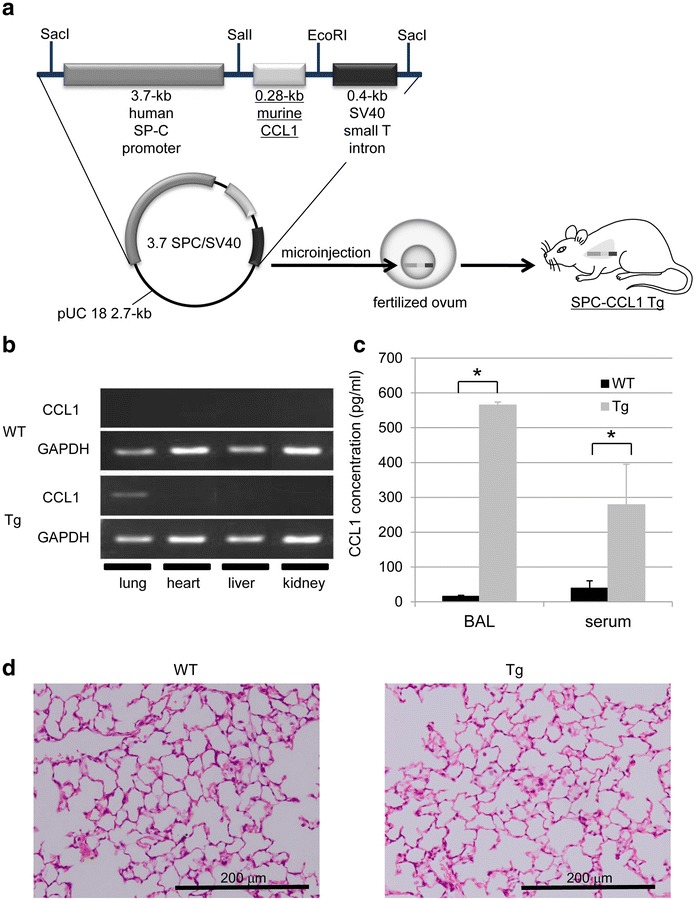
Generation of the CCL1 transgenic (Tg) mice using the surfactant protein C (SP-C) promoter. a The plasmid was composed of the 3.7-kb human SP-C promoter and the SV-40 small T intron. The murine CCL1 cDNA was cloned into the SalI/EcoRI restriction site, creating the SPC-CCL1 cDNA fusion gene. The resultant plasmid was digested with SacI to generate 4.4-kb (SPC-CCL1) linear fragments, which were microinjected into the pronuclei of fertilized C57BL/6 mouse eggs and implanted into a foster mother mouse to induce a pseudopregnancy. b Gene expression of SPC-CCL1 and GAPDH evaluated by RT-PCR. CCL1 gene expression was confirmed by RT-PCR using specific primers. CCL1 gene expression was upregulated in the lungs of SPC-CCL1 Tg mice, but negative in those of wild-type (WT) mice. c Comparison of CCL1 levels in BAL fluid between Tg and WT mice. CCL1 concentrations were measured by ELISA. The levels of CCL1 in BAL fluid and serum were elevated in SPC-CCL1 Tg mice (gray bar) compared to WT mice (black bar). *P value <0.01. d Histological findings for the lungs (hematoxylin and eosin stain, ×200). No morphological changes were observed in the lungs of SPC-CCL1 Tg mice (right), compared to WT mice (left)
Generation of SPC-CCL1 Tg mice
The resultant plasmid was digested with SacI to generate 2.7-kb (pUC 18 DNA) and 4.4-kb (SPC-CCL1) linear fragments, which were microinjected into the pronuclei of fertilized C57BL/6 mouse eggs and implanted into a foster mother mouse to induce a pseudopregnancy. We commissioned the Research Laboratory for Molecular Genetics (Faculty of Medicine, Yamagata University) to generate transgenic mice.
The rooms were kept free of any pathogens. All mice were handled according to the guide for the care and use of laboratory animals of Yamagata University, and the study protocol was approved by the Animal Subjects Committee of Yamagata University (23068, 24068, 25068, 26068, and 27068). The study was also performed in accordance with the Declaration of Helsinki.
Histological analysis
Mice were anesthetized by intraperitoneal injection of 10 % pentobarbital (100 mg/kg body weight), and were sacrificed for collection of blood and excision of organs. The lungs were inflated intratracheally under constant positive pressure at 25 cm H2O with 4 % paraformaldehyde for fixation and resected to prepare paraffin-embedded lung blocks for morphological examinations (Hirama et al. 2007). Other tissues were also fixed with 4 % paraformaldehyde, and embedded into paraffin. Tissue sections were cut at a 3-μm thickness and placed on glass slides, subsequently stained with hematoxylin and eosin, and examined using a microscope (BX50F4; Olympus, Tokyo, Japan).
Extraction of RNA and reverse transcription (RT)-PCR
Total RNA was extracted from lung, heart, liver, and kidney tissues using TRIzol reagent (Invitrogen, Carlsbad, CA, USA) according to the manufacturer’s protocol. RT was performed using SuperScript III reverse transcriptase (Invitrogen, Carlsbad, CA, USA) and gene expression was assessed by RT-PCR. The sequences of the specific primers were as follows: CCL1; identical to the primers described above, GAPDH; forward, CTT CAC CAC CAT GGA GAA GGC; reverse, GGC ATG GAC TGT GGT CAT GAG, CCR8; forward, TGG TCT TCC TGC CTC GAT GGA; reverse, CAG GCT GTT CCC CAG AAG GCC CA. PCR products were electrophoresed in 2.0 % agarose gels containing ethidium bromide, and visualized digitally with an ultraviolet illuminator (AB1500 Printgraph and AE 6905H Image Saver HR; ATTO Bioscience, Tokyo, Japan) (Machiya et al. 2007).
Preparation of blood
Whole blood was drawn by direct puncture of the inferior vena cava in mice, which had been deeply anesthetized with intraperitoneal 10 % pentobarbital (100 mg/kg body weight). Blood samples were used for three different purposes; whole blood cell counts, serum collection, and preparation of white blood cell suspensions. For whole blood cell counts, blood was collected into tubes containing ethylenediaminetetracetic acid (EDTA), and was analyzed using a whole blood counter (Celltacα; Nihon Kohden, Tokyo, Japan). For serum collection, blood was collected into tubes without EDTA, and thereafter individual serum samples were separated from the clotted blood by centrifugation and stored at −80 °C until the assays were performed. For preparation of white blood cell suspensions, whole blood was collected into tubes containing EDTA, blood cell suspensions were prepared after hemolysis of erythrocytes by distilled water, and the resultant suspensions were used for flow cytometry.
Bronchoalveolar Lavage (BAL) procedure
Mice were anesthetized and a 20-gauge metallic catheter was inserted into the trachea. BAL was performed by administering 1 ml of Hanks’ balanced salt solution (HBSS) containing 0.5 mM EDTA 3 times with a syringe. These manipulations were performed gently to avoid artificial lung injury. Total BAL cell numbers were counted under a light microscope using a hemocytometer. Fractions of the BAL cells were attached to glass slides by cytospinning at 1000 rpm for 5 min (Shandon Cytospin 2 Cytocentrifuge; Thermo, Waltham, MA, USA), and stained with a Diff-Quick solution (International Reagents Corp., Kobe, Japan) for differential cell counts (Hirama et al. 2007). The remaining cells were divided from the BAL fluid by centrifugation at 1200 rpm for 5 min, supernatants were stored at −80 °C until evaluation by ELISA, and cell suspensions were used for flow cytometry.
Biochemical analysis of BAL fluid and serum
Murine CCL1, interleukin-6 and tumor necrosis factor-alpha in the BAL fluid and serum were measured by ELISA (Quantikine; R&D Systems, Minneapolis, MN, USA), according to the manufacturer’s protocols.
Flow cytometry
Cell surface markers of BAL cells (F4/80, CD11b, Gr-1) from WT or SPC-CCL1 Tg mice were analyzed by flow cytometry. Cells were resuspended in fluorescence-activated cell sorter (FACS) buffer (PBS supplemented with 0.2 % BSA, 0.01 % sodium azide). BAL cells were stained with FITC-labeled F4/80 antibody (AbD; Serotec, Kidlington, UK); PerCP-labeled CD11b antibody (BD Pharmingen, CA, USA), PE-labeled Gr1 antibody (BD Pharmingen, CA, USA), or an isotype control (BD Pharmingen, CA, USA) at a concentration of 10 µg/ml at 4 °C for 30 min in the dark. Stained cells were washed once in FACS buffer and subjected to flow cytometric analysis using a FACS Canto II (BD Biosciences, CA, USA) (Sato-Nishiwaki et al. 2013). Data were analyzed using DIVA software (BD Bioimaging Systems, MD, USA) and FlowJo 7.6.1 (Tree Ster, Inc., Ashland, OR, USA).
Acute lung inflammation model
Mice were anesthetized by intraperitoneal injection of 10 % pentobarbital (80 mg/kg body weight), and the trachea was intubated with a 22-gauge cannula. Lipopolysaccharide (LPS, 2 mg/kg body weight) derived from Escherichia coli O55: B5 (SIGMA-ALDRICH. St. Louis, MO, USA) in isotonic sodium chloride solution was intratracheally administered via a cannula at a determinate amount (50 µl/mouse) (Chen et al. 2013). Mice were sacrificed after 6, 24, or 72 h from administration, and were evaluated for histological findings of lung, BAL cell count, and cell differentials.
Chronic lung injury model
Bacille de Calmette et Guérin (BCG, 6 × 10⁶/mouse) derived from Mycobacterium bovis (Tokyo 172 strain) (Japan BCG Laboratory. Tokyo, Japan) in isotonic sodium chloride solution was intratracheally administered via a cannula at a determinate amount (100 µl/mouse) to anesthetized mice (Fulton et al. 2000; Tokairin et al. 2008). Mice were sacrificed after 28 days from administration for the preparation of pathological samples and the isolation of total RNA from the lungs. In the pathological analyses, three digitized tissue images were randomly taken using a microscope system at the 10× magnification from all lobes of each mouse, and the total number of granulomas was counted.
Immunohistochemistry
Paraffin-embedded sections (3 μm thick) were cut and placed on glass slides. For detection of immunoglobulin (Ig), sections were incubated with antibodies to horseradish peroxidase-labeled mouse IgG (Promega Corp., Madison, WI, USA) at 1:250 dilution. For detection of endoplasmic reticulum to nucleus signaling (Ern)-1, sections were incubated with antibodies to phosphorylated Ern1, also known as inositol-requiring enzyme-1a (IRE1a) (Novus Biologicals, Littleton, CO, USA) at 1:1000 dilution, followed by horseradish peroxidase-labeled anti-rabbit IgG (Promega Corp., Madison, WI, USA) at 1:200 dilution. Color development was performed using the DAKO Liquid DAB + Substrate Chromogen System (Dako, Glostrup, Denmark). Immunostaining of all sections was performed simultaneously, to avoid variation due to differences in staining conditions. Cell nuclei were stained with hematoxylin.
To evaluate the positivity of IgG and Ern1, intensities of IgG and Ern1 immunohistochemistry in each granuloma were scored according to the scoring system described in the previous literature with some modification (Serth et al. 1995): 0, no staining at all; 1, staining in <5 % of cells; 2, staining in 5–10 % of cells; 3, staining in 11–39 % of cells; 4, staining in >40 % of cells. This assessment was performed in the twenty granulomas in each mice, and the mean was used for the representative value for a mouse.
Evaluation of bacterial burden after inoculation of BCG
As described above, BCG (6 × 10⁶/mouse) was intratracheally administrated to mice. DNA was isolated from removed lungs using Allprep DNA/RNA Mini Kit (QIAGEN). MBP70, a BCG genomic DNA, and Ywhaz, a genomic mouse DNA, was amplified using real-time PCR system (Kimura et al. 2012). The sequences of the specific primers were as follows: MBP70; forward, ACC AGC ATC CTG ACC TAC CAC; reverse, CTT GAG GCT GTT ACC CTG ACC, and Ywhaz4; forward, GTA AAG TGC AGC CCA CGA CA; reverse, AGG AAG CGG CCT TAG ACC TT. The primers for Ywhaz were designed from the sequence between intron 1 and 2. The ratio of the PCR-amplification level in MBP to that in Ywhaz were considered as bacterial burden of BCG (Cousins et al. 1992; de Assuncao et al. 2014). Data were expressed as fold change compared to wildtype mice.
Statistical analysis
The results are expressed as mean ± standard deviation (SD). Student’s t test was used to evaluate differences in means. The non-parametric Mann–Whitney U test was used to compare variables that were not normally distributed. All statistical analyses were performed using JMP version 9 software (SAS Institute Inc., Cary, NC, USA). Statistical significance was defined as P < 0.05.
Results
Confirmation of CCL1 mRNA overexpression
Three transgenic founders (lines 6, 8, and 63) were generated, as confirmed by PCR of genomic DNA. CCL1 mRNA expression of SPC-CCL1 Tg mice was confirmed by RT-PCR using specific primers. Transgene expression of CCL1 was detected only in the lungs of SPC-CCL1 Tg mice, and no CCL1 expression was observed in other organs, or in WT mice. Representative images of CCL1 and GAPDH expression in line 63 are shown in Fig. 1b. The levels of CCL1 in BAL fluid and serum were significantly elevated in SPC-CCL1 Tg mice, compared with WT mice (Fig. 1c). The CCL1 concentration in the BAL fluid was lower in the other two lines of transgenic mice than in line 63 (data not shown). Thus, line 63 was used for the following experiments.
Evaluation of phenotypes
No neonatal death was observed in SPC-CCL1 mice, and the survival rate was similar to that of WT mice (data not shown). The general appearance of SPC-CCL1 Tg mice was not obviously different from that of WT mice (data not shown). No morphological differences in lung tissue were observed between SPC-CCL1 Tg mice and WT mice (Fig. 1d). Histological findings for other tissues (heart, thymus, liver, spleen, pancreas, kidney, adrenal gland, and skin) did not differ significantly between SPC-CCL1 Tg mice and WT mice (data not shown).
There were no significant differences in organ weight between SPC-CCL1 Tg mice and WT mice (Table 1). In the whole blood counts, SPC-CCL1 Tg mice and WT mice did not differ significantly in numbers of white blood cells or red blood cells, but the platelet count was significantly higher in SPC-CCL1 Tg mice than in WT mice (Table 1).
Table 1.
Comparisons of organ weight/blood count between wild-type (WT) and SP-C CCL-1 transgenic (Tg) mice at resting condition
| WT (n = 4) | Tg (n = 4) | P value | |
|---|---|---|---|
| BW (g) | 25.7 ± 2.9 | 24.5 ± 0.8 | 0.3865 |
| Lung (g) | 0.119 ± 0.009 | 0.118 ± 0.009 | 0.7728 |
| Heart (g) | 0.113 ± 0.006 | 0.114 ± 0.010 | 0.5637 |
| Liver (g) | 1.138 ± 0.102 | 1.101 ± 0.085 | 0.5637 |
| Spleen (g) | 0.074 ± 0.012 | 0.070 ± 0.006 | 0.2482 |
| Kidney (g) | 0.279 ± 0.048 | 0.244 ± 0.023 | 0.3865 |
| Thymus (g) | 0.035 ± 0.003 | 0.033 ± 0.006 | 0.5637 |
| WBC (×102/µl) | 54.20 ± 16.36 | 65.40 ± 25.19 | 0.3472 |
| RBC (×104/µl) | 981.6 ± 125.3 | 845.6 ± 44.8 | 0.0758 |
| Hemoglobin (g/dl) | 15.8 ± 1.8 | 13.7 ± 0.4 | 0.0740 |
| Hematocrit (%) | 46.6 ± 6.1 | 43.2 ± 1.7 | 0.3472 |
| Platelet (×104/µl) | 68.6 ± 14.6 | 88.5 ± 10.5 | 0.0283 |
Values are given as the mean ± SD
Mann–Whitney U test
BW body weight, WBC white blood cell, RBC red blood cell
Analysis of BAL cell numbers and differential cell counts
Concentrations of BAL cells and total cell count were significantly lower in SPC-CCL1 Tg mice than in WT mice (Table 2). Furthermore, the number of macrophages was lower in SPC-CCL1 Tg mice than in WT mice (Table 2).
Table 2.
Comparison of BAL cells between wild-type (WT) and SP-C CCL-1 transgenic (Tg) mice at resting condition
| WT (n = 16) | Tg (n = 15) | P value | |
|---|---|---|---|
| BW (g) | 25.8 ± 2.0 | 26.2 ± 2.8 | 0.6734 |
| Collection volume (ml) | 2.93 ± 0.07 | 2.93 ± 0.07 | 0.9471 |
| Cell concentrations (×104/ml) | 2.00 ± 0.73 | 1.37 ± 0.52 | 0.0097 |
| Total cell count (×104) | 8.16 ± 2.19 | 4.31 ± 1.24 | 0.0112 |
| Macrophages (×104) | 7.66 ± 1.33 | 4.31 ± 1.24 | 0.0103 |
| Neutrophils (×104) | 0.46 ± 0.54 | 0.00 ± 0.00 | 0.1349 |
| Lymphocytes (×104) | 0.04 ± 0.06 | 0.00 ± 0.00 | 0.2688 |
| Eosinophils (×104) | 0.00 ± 0.00 | 0.00 ± 0.00 | – |
Values are given as the mean ± SD
Mann–Whitney U test
BW body weight
Analysis of surface markers by flow cytometry (FCM)
Dot plots of BAL cells by FCM are shown in Fig. 2. BAL cells of WT mice (Fig. 2a) and SPC-CCL1 Tg mice (Fig. 2b) were distributed by forward scatter (FSC) and side scatter (SSC). FSC and SSC were expressed on a log scale, and smaller objects (FSC < 5000) were omitted from analyses as debris. Cells regarded as alveolar macrophages (AMs) were enclosed hexagonal forms, and gated for analysis (Tailleux et al. 2005). The results showed fewer AMs in SPC-CCL1 Tg mice than in WT mice.
Fig. 2.
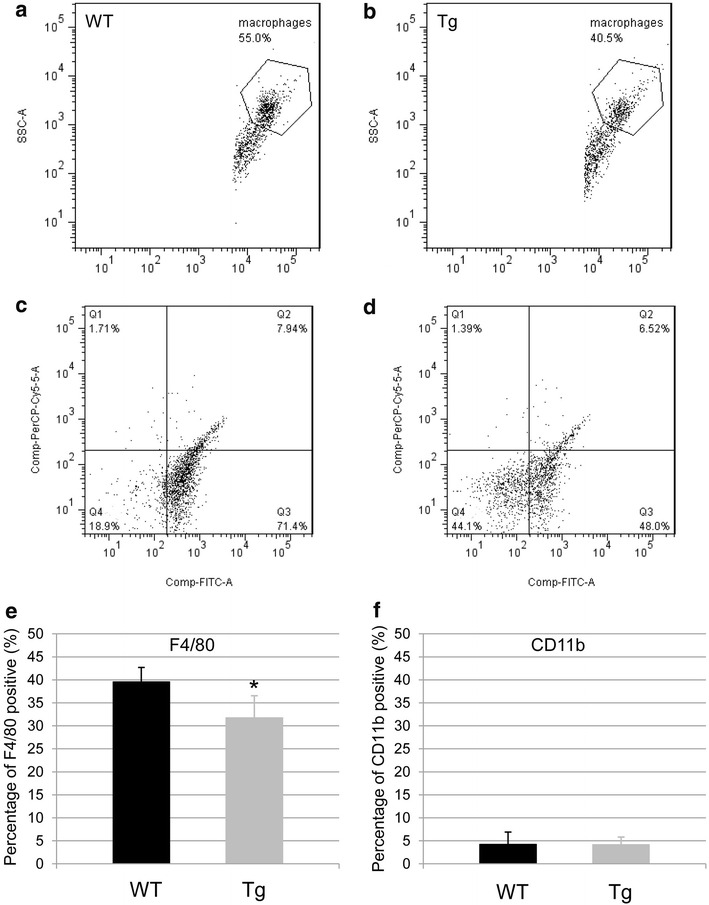
Flow cytometric (FCM) plots of BAL cells and alveolar macrophages. Representative schemas for dot plots for FCM are shown. BAL cells of WT mice (a) and SPC-CCL1 Tg mice (b) were distributed by forward scatter (FSC) and side scatter (SSC). Cells regarded as alveolar macrophages were enclosed hexagonal form. Alveolar macrophages were decreased in SPC-CCL1 Tg mice compared to WT mice. FSC and SSC were expressed on a log scale, and smaller objects (FSC < 5000) were omitted from analyses as debris. The fraction of macrophages was gated and the surface markers of WT mice and SPC-CCL1 Tg mice were evaluated. The gated fractions of AMs from WT mice (c) and SPC-CCL1 Tg mice (d) were distributed by FITC-F4/80 and PerCP-CD11b. e F4/80-positive cells were decreased in SPC-CCL1 Tg mice (gray bar) compared to WT mice (black bar). f CD11b-positive cells remained unchanged compared to WT mice. *P value <0.05 compared to WT mice
Subsequently, the gated fractions of AMs of WT mice and SPC-CCL1 Tg mice were evaluated for expression of surface markers (F4/80 and CD11b) (Fig. 2c, d). Expression of F4/80 on AMs from SPC-CCL1 Tg mice was attenuated, compared with that of WT mice (Fig. 2e, Tg mice: 31.8 ± 4.8 %, WT mice: 39.6 ± 3.1 %, P = 0.0278). However, expression of CD11b on AMs from SPC-CCL1 Tg mice remained unchanged, compared with that of WT mice (Fig. 2f, Tg mice: 4.2 ± 1.7 %, WT mice: 4.2 ± 2.7 %, P = 0.9168).
Analysis of acute lung injury model
Mice were intratracheally administered LPS (2 mg/kg body weight) and sacrificed at 6, 24, or 72 h after administration. At 6 h after administration, inflammatory cells, such as neutrophils, had infiltrated the alveoli of both WT (Fig. 3a) and SPC-CCL1 Tg mice (Fig. 3b). Infiltration of inflammatory cells was almost equal between the two groups. At 72 h after administration, the alveoli were filled with inflammatory cells, particularly neutrophils, macrophages, and exudates. Histopathological findings did not show significant differences between LPS-treated SPC-CCL1 Tg mice (Fig. 3d) and WT mice (Fig. 3c).
Fig. 3.
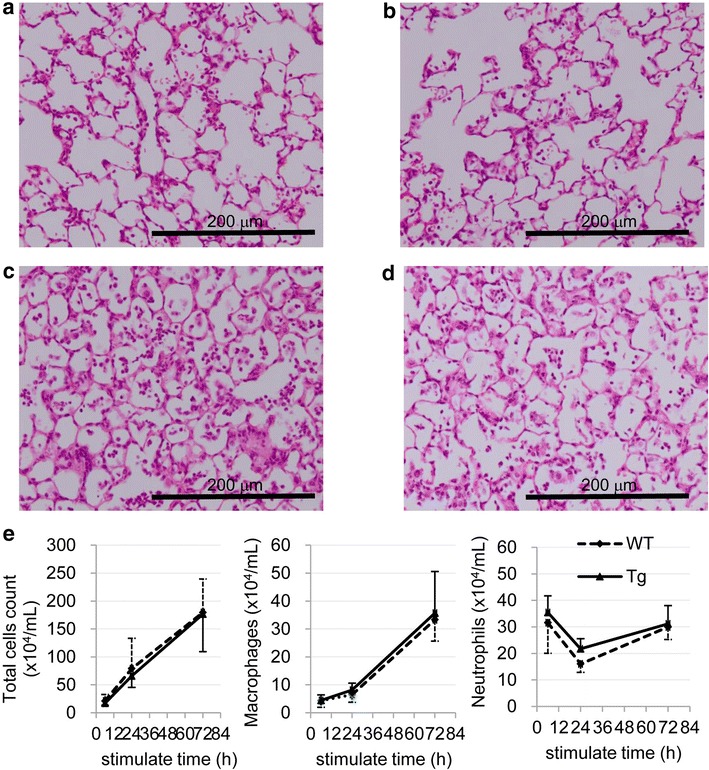
Intratracheal administration of lipopolysaccharide (LPS) into the lungs of wild-type (WT) and SPC-CCL1 transgenic (Tg) mice. To produce a model of acute lung injury, mice were intratracheally administered LPS (2 mg/kg body weight). a WT mice, 6 h after administration. Inflammatory cells such as neutrophils had infiltrated the alveoli. b SPC-CCL1 Tg mice, 6 h after administration. Infiltration of inflammatory cells was also observed. c WT mice, 72 h after administration. The alveoli were filled with inflammatory cells, particularly neutrophils, macrophages, and exudates. d SPC-CCL1 Tg mice, 72 h after administration. Histopathological findings did not show significant differences between LPS-treated SPC-CCL1 Tg mice and WT mice. e Time course of changes in BAL cells (left total cells, middle macrophages, right neutrophils) 6, 24 and 72 h after LPS administration. CCL1 overexpression changed neither the total number nor population of BAL cells
Figure 3e shows a time course of change in BAL cells after LPS administration. However, CCL1 overexpression changed neither the total numbers nor population of BAL cells (Fig. 3e). In addition, the levels of interleukin-6 and tumor necrosis factor-alpha in BAL fluid after LPS intratracheal administration were not different in between WT and Tg mice (Table 3).
Table 3.
Comparison of Interleukin-6 (IL-6) and tumor necrosis factor-alpha (TNF-alpha) in bronchoalveolar lavage fluid after intratracheal administration of lipopolysaccharide between wild-type (WT) and SP-C CCL-1 transgenic (Tg) mice
| Time point (h) | WT (n = 5) | Tg (n = 5) | P | |
|---|---|---|---|---|
| IL-6 | 0 | 18.6 ± 6.2 | 19.8 ± 6.4 | 0.77 |
| 6 | 254.2 ± 90.7 | 385.6 ± 107.8 | 0.63 | |
| 24 | 1336.0 ± 500.3 | 1500.6 ± 331.2 | 0.56 | |
| 72 | 915.6 ± 377.9 | 1141.0 ± 423.0 | 0.4 | |
| TNF alpha | 0 | 18.0 ± 7.6 | 22.0 ± 7.5 | 0.43 |
| 6 | 563.2 ± 198.1 | 728.6 ± 218.6 | 0.26 | |
| 24 | 1576.4 ± 546.8 | 1468.8 ± 589.9 | 0.77 | |
| 72 | 315.8 ± 126.6 | 417.2 ± 174.8 | 0.32 |
Values are given as the mean ± SD
Mann–Whitney U test
Analysis of chronic lung inflammation model
The lungs of WT and Tg mice were infected with M. bovis (BCG) to produce chronic pulmonary inflammation. Compared to the lungs of BCG-infected WT mice (Fig. 4a), granuloma formation was increased in Tg mice (Fig. 4b). Quantification was performed as described in the “Methods”, and the difference was confirmed (Fig. 4c). There were no significant bacterial burdens between WT and Tg mice (1.13 ± 0.60 fold vs wild type, P = 0.74, n = 4 in each group).
Fig. 4.
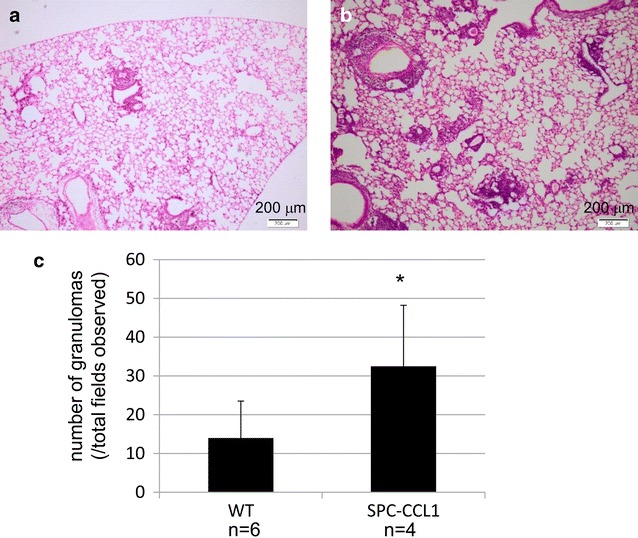
Intratracheal administration of Mycobacterium into the lungs of wild-type (WT) and SPC-CCL1 transgenic (Tg) mice. To produce a model of chronic lung inflammation, mice were intratracheally administered Bacille de Calmette et Guérin (BCG). a Representative lung image of WT mice, 28 days after administration. b Representative lung image of SPC-CCL1 Tg mice, 28 days after administration. Enhanced granuloma formation was observed in the lungs of Tg mice, compared to WT mice c. *P value <0.05 compared to WT mice
Antibody-mediated immunity is reported to be important for mycobacterial infection (Chan et al. 2014). Immunohistochemical analysis using an antibody against IgG revealed more IgG-positive cells in the granulomatous lesions of BCG-treated Tg mice than in those of WT mice [Fig. 5a, b: IgG immunostaining score: WT, 1.3 ± 0.6 (n = 6); Tg 2.7 ± 0.6 (n = 4); P < 0.05 Mann–Whitney U test].
Fig. 5.
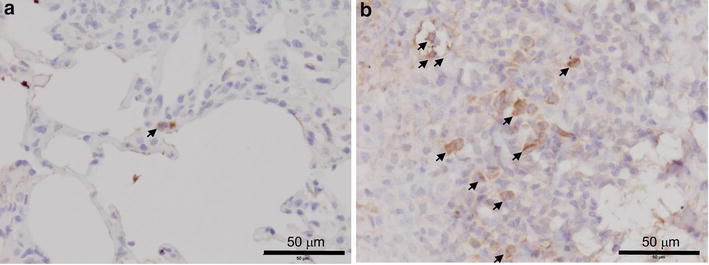
Immunohistochemical staining using an antibody to immunoglobulin G in the lungs of BCG-treated wild-type (WT) and SP-C CCL-1 transgenic (Tg) mice. Pulmonary immunoglobulin G was immunohistochemically stained in the lungs of WT (a, n = 6) and Tg mice (b, n = 4) 21 days after BCG administration, as described in the “Methods”. Representative images are shown. Black arrows indicate positive cells. Original magnification ×800
Enhanced endoplasmic reticulum (ER) stress in SPC-CCL1 transgenic mice after mycobacterial infection
Recently, the involvement of ER stress was reported in the pathogenesis of granuloma formation induced by Mycobacterium (Seimon et al. 2010). Immunohistochemical analysis showed that alveolar macrophages in the lungs of Tg mice treated with BCG were more positive for phosphorylated Ern1 than those of WT mice (Fig. 6c, d). The nuclei in granuloma cells of BCG-treated Tg mice were more positive for phosphorylated Ern1 than those of WT mice [Fig. 6e, f: Ern1 immunostaining score: WT, 3.1 ± 0.1 (n = 6); Tg 3.7 ± 0.1 (n = 4); P < 0.05 Mann–Whitney U test].
Fig. 6.
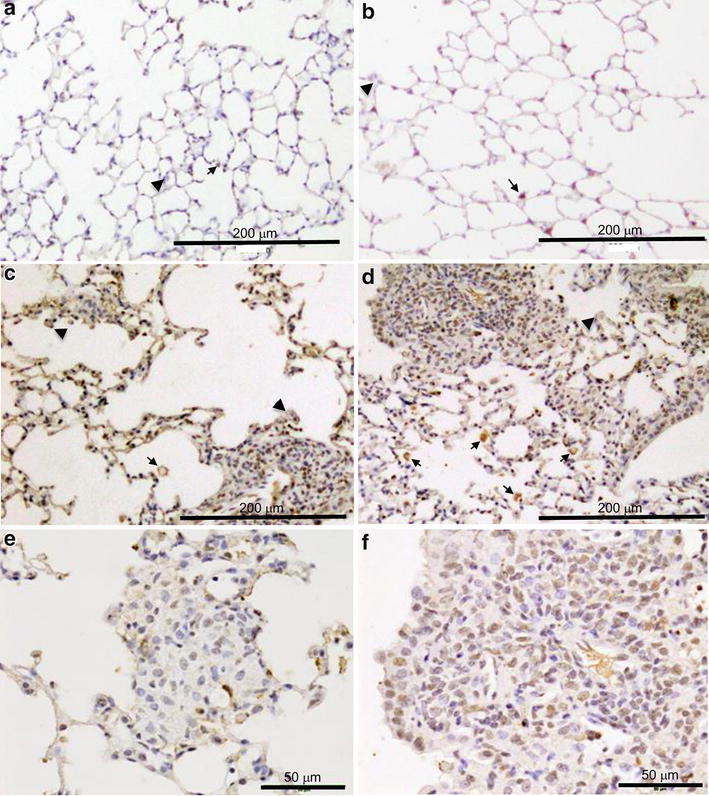
Immunohistochemical staining using an antibody to phosphorylated endoplasmic reticulum to nucleus signaling 1 (Ern1) in the lungs of BCG-treated wild-type (WT) and SP-C CCL-1 transgenic (Tg) mice. Phosphorylated Ern1 was immunohistochemically stained in the lungs of WT and Tg mice 21 days after BCG administration, as described in the “Methods”. Black arrows indicate phosphorylated Ern1-positive alveolar macrophages. Black arrowheads indicate phosphorylated Ern1-negative alveolar macrophages. a WT untreated, b Tg untreated, c WT BCG-treated; d Tg BCG-treated, e WT BCG-treated, f Tg BCG-treated. a–d original magnification ×200, e, f original magnification ×800
Discussion
In this study, we generated Tg mice that overexpress CCL1 specifically in the lungs (Fig. 1), and the activity of the transgene was verified by the high concentrations of CCL1 in the BAL fluid and serum (Fig. 1c). The receptor for CCL1, CCR8, is not expressed on pulmonary epithelium, endothelium, or fibroblast. Therefore, pulmonary expression using SP-C promoter thought to be usable to evaluate the immune reaction of CCR8-positive leukocytes to CCL1, although the major source of CCL1 is different between CCL1 Tg and WT mice. Because we did not detect the gene expression of CCL1 in other organs of CCL1 mice (Fig. 1b), the elevation of CCL1 seems to be due to spill-over of lung CCL1. However, the number of BAL cells, particularly the number of AMs, was significantly lower in these Tg mice than in WT mice (Table 2). In addition, F4/80, a macrophage differentiation marker, was significantly reduced on AMs recovered from the BAL from resting-state Tg mice compared to WT mice (Fig. 2). In the model of acute lung inflammation, the accumulation of inflammatory cells did not significantly differ between the lungs of WT and Tg mice (Fig. 3). Notably, in the model of chronic inflammation, formation of granulomas after BCG administration was significantly enhanced in the lungs of Tg mice compared to WT mice (Fig. 4). Immunohistochemical analysis showed the higher levels of phosphorylated Ern1 in the alveolar macrophages and nuclei of granuloma cells in BCG-treated CCL1 Tg mice than in WT mice (Fig. 6).
CCL1 mainly acts as a potent chemoattractant for monocytes/macrophages, lymphocytes, and neutrophils. Therefore, the accumulation of the leukocytes to the lungs was expected in the CCL1 Tg mice. However, against this prediction, the total cells and alveolar macrophages recovered from BAL were significantly reduced in SPC-CCL1 Tg mice. The mechanism for this phenomenon has not been elucidated. In the lungs of these Tg mice, CCL1 is constitutively expressed, and a high level of CCL1 is maintained. Thus, in these mice, lung cells are chronically exposed to a high level of CCL1. Although acute chemotactic effects of CCL1 on inflammatory cells have been shown by several investigators (Doyle and Murphy 1999; Luo et al. 1994; Miller and Krangel 1992; Tiffany et al. 1997), the chronic effects of CCL1 have not been investigated. This difference in exposure of the cells to CCL1, acute or chronic, may alter the cellular response to this chemokine. Furthermore, chronic exposure to CCL1 might alter the expression of its receptor, CCR8, or the status of downstream molecules associated with CCL1-CCR8 signal transduction. However, we could not detect the expression of CCR8 in lung tissue or BAL cells of both CCL1 Tg and WT mice using RT-PCR methods, probably due to the low expression of CCR8 in lung tissue and alveolar macrophages, although CCR8 expression was positive in thymus of WT and CCL1 Tg mice (data not shown). Because we could not find any literatures describing the expression of CCR8 in the murine alveolar macrophages, the expression of CCR8 may be lost during the process to terminal differentiation of alveolar macrophages in mice. CCR8 expression in circulating monocyte should be examined using flow cytometry technique in the future in CCL1 Tg mice.
Total BAL cells, especially alveolar macrophages, and expression of the surface marker, F4/80, in AMs of Tg mice was significantly reduced (Table 2; Fig. 2e). F4/80 has been established as a specific cell surface marker for murine macrophages (Austyn and Gordon 1981; Morris et al. 1991), and is known to be a member of the epidermal growth factor-seven-transmembrane-domain family. As the precursors of tissue macrophages, blood monocytes express less F4/80 than mature macrophages (Gordon et al. 1992). CD11b is expressed on the surface of monocytes, macrophages, NK cells, and granulocytes. AMs express less CD11b than their monocytic precursors (Senft et al. 2007). In the present study, F4/80 expression was reduced in the AMs of SPC-CCL1 Tg mice compared to those of WT mice. However, the mechanisms for decreasing numbers and surface markers of alveolar macrophages in CCL1 Tg mice was unclear. The alveolar macrophage numbers and functions are known to be regulated by hematopoietic growth factors such as M-CSF and GM-CSF (Shibata et al. 2001a, b). CCL1 may modulate the expression of these growth factors or their receptors. In future work, we will need to evaluate the levels of M-CSF, GM-CSF, receptors for M-CSF and GM-CSF, and the transcription factors that regulate the differentiation and functions of macrophages, such as PU.1, MafB, and interferon regulatory factor-8 (Sato-Nishiwaki et al. 2013; Shibata et al. 2001a; Tamura et al. 2000).
In the present study, CCL1 overexpression did not alter accumulation of inflammatory cells after LPS stimulation (Fig. 3), although the baseline number of alveolar macrophages were significantly reduced (Table 2). This result was consistent with a previous report that demonstrated a lack of induction of CCL1 by stimulation with LPS, IFN-γ, interleukin-1beta (IL-1β), tumor necrosis factor alpha (TNFα), IL-4, IL-13, IL-10, IL-6, IL-18, and combinations thereof in human monocytes, induction of CCL1 in monocytes, and the requirement for engagement of FcγR II following exposure to IL-1β or LPS (Sironi et al. 2006). CCL1 did not play major roles in this acute lung inflammation model.
CCL1 is suggested to be involved in the pathogenesis of mycobacterial infection, one of the most important chronic inflammation in the lung (Yu et al. 2012). Increase of CCL1 was reported in the animal experimental model of granuloma by Mycobacterium (Chiu et al. 2003). Seimon et al. demonstrated induction of ER stress and upregulation of Ern1 in granuloma cells by administration of M. tuberculosis to mice (Seimon et al. 2010). In the present study, we demonstrated the enhanced phosphorylation of Ern1 in the granulomas of CCL1 Tg mice (Fig. 6). To the best of our knowledge, there are no studies that have investigated the relationship between CCL1 and Ern1. However, it has been reported that overexpression of CCL2, another chemokine, induces ER stress in a preadipocyte cell line. Inhibition of ER stress by taurursodeoxycholate or knockdown of Ern1 inhibited CCL2-induced protein caused autophagy and adipogenesis (Younce and Kolattukudy 2012). Increase of reactive oxygen species (ROS) is suggested to be involved in one of the mechanism governing CCL2-induced ER stress (Younce and Kolattukudy 2012). Because CCL1 also induces reactive oxygen in the presence of LPS in a dose-dependent manner (Reimer et al. 2011), it is possible that the increase of ROS enhances the ER stress in CCL1 Tg mice. The mechanism governing the upregulation of Ern1 in the BCG-treated Tg mice needs to be elucidated with the precise in vitro experiments in the future.
Ern1 possesses an intrinsic kinase activity and an endoribonuclease activity, and it is important in altering gene expression in response to endoplasmic reticulum-based stress signals. Although it has not been elucidated whether ER stress plays a beneficial role in the host response to infection, ER stress interacts with and regulates signaling intermediates involved in the activation of the innate and adaptive immune responses (Muralidharan and Mandrekar 2013). It has been reported that Ern1 is necessary for the development of adaptive immune B cells, terminally differentiated plasma cells (Iwakoshi et al. 2003; Zhang et al. 2005). As shown in Fig. 5, immunoglobulin positive cells were increased in the granuloma of CCL1 Tg mice. Thus, enhanced phosphorylation of Ern1 may be essential for the alteration of immune status observed in the granuloma cells of BCG-treated CCL1 Tg mice.
In the chronic lung inflammation model using intratracheal administration of BCG, granuloma formation was significantly increased in Tg mice. Since bacterial burden after BCG inoculation was not significantly different between two groups (text in the “Results” section), this enhanced formation of granuloma suggests the involvement of the hyper-response to biotic stimulus in CCL1 Tg mice, not due to reduced bacterial killing capacity.
In conclusion, the present study demonstrated that CCL1 overexpression in the lungs altered the phenotypes of alveolar macrophages in terms of the number of alveolar macrophages and surface marker expression at resting state in vivo. Although over-expression of CCL1 in the lungs did not alter the acute inflammatory reaction, it altered the chronic inflammatory response induced by Mycobacterium, perhaps through enhancing ER stress. To the best of our knowledge, this study demonstrates novel in vivo roles for CCL1 in adaptive immunity such as granuloma formation.
Authors’ contributions
HK: conducted experiments and wrote the manuscript; MS, KS, TN and TK: conducted part of the experiments; YS, SI, SA and IK: supervised the work; MN, KY, AI and YT: prepared the data for analyses and conducted the analyses; ON: generated the transgenic mice. All authors read and approved the final manuscript.
Acknowledgements
This study was supported by the Japan Society for the Promotion of Science (20590892, 20790563, 23390220, 23591111, 26461177, and 26461153).
Competing interests
The authors declare that they have no competing interests.
Abbreviations
- AM
Alveolar macrophage
- BAL
Bronchoalveolar lavage
- BCG
Bacille de Calmette et Guérin
- CCL1
C-C motif ligand 1
- COPD
Chronic obstructive pulmonary disease
- ER
Endoplasmic reticulum
- Ern1
Endoplasmic reticulum to nucleus signaling 1
- FSC
Forward scatter
- Ig
Immunoglobulin
- IRE1a
Inositol-requiring enzyme-1a
- LPS
Lipopolysaccharide
- SP-C
Surfactant protein-C
- SSC
Side scatter
- Tg
Transgenic
- WT
Wild type
Contributor Information
Hiroyuki Kishi, Email: laugh.the.best.medicine@gmail.com.
Masamichi Sato, Email: m-satoh@med.id.yamagata-u.ac.jp.
Yoko Shibata, Email: shibata@med.id.yamagata-u.ac.jp.
Kento Sato, Email: k-sato@med.id.yamagata-u.ac.jp.
Sumito Inoue, Email: sinoue@med.id.yamagata-u.ac.jp.
Shuichi Abe, Email: abeshu@icloud.com.
Tomomi Kimura, Email: tomomi-i@med.id.yamagata-u.ac.jp.
Michiko Nishiwaki, Email: m-nishi@med.id.yamagata-u.ac.jp.
Keiko Yamauchi, Email: kyamauchi@med.id.yamagata-u.ac.jp.
Takako Nemoto, Email: n.takako@med.id.yamagata-u.ac.jp.
Akira Igarashi, Email: akigaras@med.id.yamagata-u.ac.jp.
Yoshikane Tokairin, Email: ytoukair@med.id.yamagata-u.ac.jp.
Osamu Nakajima, Email: nakajima@med.id.yamagata-u.ac.jp.
Isao Kubota, Email: ikubota@med.id.yamagata-u.ac.jp.
References
- Austyn JM, Gordon S. F4/80, a monoclonal antibody directed specifically against the mouse macrophage. Eur J Immunol. 1981;11:805–815. doi: 10.1002/eji.1830111013. [DOI] [PubMed] [Google Scholar]
- Baggiolini M. Chemokines in pathology and medicine. J Intern Med. 2001;250:91–104. doi: 10.1046/j.1365-2796.2001.00867.x. [DOI] [PubMed] [Google Scholar]
- Chan J, Mehta S, Bharrhan S, Chen Y, Achkar JM, Casadevall A, Flynn J. The role of B cells and humoral immunity in Mycobacterium tuberculosis infection. Semin Immunol. 2014;26:588–600. doi: 10.1016/j.smim.2014.10.005. [DOI] [PMC free article] [PubMed] [Google Scholar]
- Chen J, Li C, Gao X, Li C, Liang Z, Yu L, Li Y, Xiao X, Chen L. Keratinocyte growth factor gene delivery via mesenchymal stem cells protects against lipopolysaccharide-induced acute lung injury in mice. PLoS ONE. 2013;8:e83303. doi: 10.1371/journal.pone.0083303. [DOI] [PMC free article] [PubMed] [Google Scholar]
- Chiu BC, Freeman CM, Stolberg VR, Komuniecki E, Lincoln PM, Kunkel SL, Chensue SW. Cytokine-chemokine networks in experimental mycobacterial and schistosomal pulmonary granuloma formation. Am J Respir Cell Mol Biol. 2003;29:106–116. doi: 10.1165/rcmb.2002-0241OC. [DOI] [PMC free article] [PubMed] [Google Scholar]
- Cousins DV, Wilton SD, Francis BR, Gow BL. Use of polymerase chain reaction for rapid diagnosis of tuberculosis. J Clin Microbiol. 1992;30:255–258. doi: 10.1128/jcm.30.1.255-258.1992. [DOI] [PMC free article] [PubMed] [Google Scholar]
- de Assuncao TM, Batista EL, Jr, Deves C, Villela AD, Pagnussatti VE, de Oliveira Dias AC, Kritski A, Rodrigues-Junior V, Basso LA, Santos DS. Real time PCR quantification of viable Mycobacterium tuberculosis from sputum samples treated with propidium monoazide. Tuberculosis (Edinb) 2014;94:421–427. doi: 10.1016/j.tube.2014.04.008. [DOI] [PubMed] [Google Scholar]
- Didon L, Qvarfordt I, Andersson O, Nord M, Riise GC. Decreased CCAAT/enhancer binding protein transcription factor activity in chronic bronchitis and COPD. Chest. 2005;127:1341–1346. doi: 10.1378/chest.127.4.1341. [DOI] [PubMed] [Google Scholar]
- Doyle HA, Murphy JW. Role of the C-C chemokine, TCA3, in the protective anticryptococcal cell-mediated immune response. J Immunol. 1999;162:4824–4833. [PubMed] [Google Scholar]
- Fulton SA, Martin TD, Redline RW, Henry Boom W. Pulmonary immune responses during primary Mycobacterium bovis- Calmette–Guerin bacillus infection in C57Bl/6 mice. Am J Respir Cell Mol Biol. 2000;22:333–343. doi: 10.1165/ajrcmb.22.3.3776. [DOI] [PubMed] [Google Scholar]
- Geraci MW, Gao B, Shepherd DC, Moore MD, Westcott JY, Fagan KA, Alger LA, Tuder RM, Voelkel NF. Pulmonary prostacyclin synthase overexpression in transgenic mice protects against development of hypoxic pulmonary hypertension. J Clin Invest. 1999;103:1509–1515. doi: 10.1172/JCI5911. [DOI] [PMC free article] [PubMed] [Google Scholar]
- Glasser SW, Korfhagen TR, Perme CM, Pilot-Matias TJ, Kister SE, Whitsett JA. Two SP-C genes encoding human pulmonary surfactant proteolipid. J Biol Chem. 1988;263:10326–10331. [PubMed] [Google Scholar]
- Glasser SW, Korfhagen TR, Wert SE, Bruno MD, McWilliams KM, Vorbroker DK, Whitsett JA. Genetic element from human surfactant protein SP-C gene confers bronchiolar-alveolar cell specificity in transgenic mice. Am J Physiol. 1991;261:L349–L356. doi: 10.1152/ajplung.1991.261.4.L349. [DOI] [PubMed] [Google Scholar]
- Gordon S, Lawson L, Rabinowitz S, Crocker PR, Morris L, Perry VH. Antigen markers of macrophage differentiation in murine tissues. Curr Top Microbiol Immunol. 1992;181:1–37. doi: 10.1007/978-3-642-77377-8_1. [DOI] [PubMed] [Google Scholar]
- Hirama N, Shibata Y, Otake K, Machiya J, Wada T, Inoue S, Abe S, Takabatake N, Sata M, Kubota I. Increased surfactant protein-D and foamy macrophages in smoking-induced mouse emphysema. Respirology. 2007;12:191–201. doi: 10.1111/j.1440-1843.2006.01009.x. [DOI] [PubMed] [Google Scholar]
- Hurst JR, Perera WR, Wilkinson TM, Donaldson GC, Wedzicha JA. Systemic and upper and lower airway inflammation at exacerbation of chronic obstructive pulmonary disease. Am J Respir Crit Care Med. 2006;173:71–78. doi: 10.1164/rccm.200505-704OC. [DOI] [PubMed] [Google Scholar]
- Iwakoshi NN, Lee AH, Vallabhajosyula P, Otipoby KL, Rajewsky K, Glimcher LH. Plasma cell differentiation and the unfolded protein response intersect at the transcription factor XBP-1. Nat Immunol. 2003;4:321–329. doi: 10.1038/ni907. [DOI] [PubMed] [Google Scholar]
- Kimura T, Shibata Y, Yamauchi K, Igarashi A, Inoue S, Abe S, Fujita K, Uosaki Y, Kubota I. Oxidized phospholipid, 1-palmitoyl-2-(9′-oxo-nonanoyl)-glycerophosphocholine (PON-GPC), produced in the lung due to cigarette smoking, impairs immune function in macrophages. Lung. 2012;190:169–182. doi: 10.1007/s00408-011-9331-2. [DOI] [PubMed] [Google Scholar]
- Korfhagen TR, Glasser SW, Wert SE, Bruno MD, Daugherty CC, McNeish JD, Stock JL, Potter SS, Whitsett JA. Cis-acting sequences from a human surfactant protein gene confer pulmonary-specific gene expression in transgenic mice. Proc Natl Acad Sci U S A. 1990;87:6122–6126. doi: 10.1073/pnas.87.16.6122. [DOI] [PMC free article] [PubMed] [Google Scholar]
- Luo Y, Laning J, Devi S, Mak J, Schall TJ, Dorf ME. Biologic activities of the murine beta-chemokine TCA3. J Immunol. 1994;153:4616–4624. [PubMed] [Google Scholar]
- Luo Y, D’Amore PA, Dorf ME. Beta-chemokine TCA3 binds to and activates rat vascular smooth muscle cells. J Immunol. 1996;157:2143–2148. [PubMed] [Google Scholar]
- Machiya J, Shibata Y, Yamauchi K, Hirama N, Wada T, Inoue S, Abe S, Takabatake N, Sata M, Kubota I. Enhanced expression of MafB inhibits macrophage apoptosis induced by cigarette smoke exposure. Am J Respir Cell Mol Biol. 2007;36:418–426. doi: 10.1165/rcmb.2006-0248OC. [DOI] [PubMed] [Google Scholar]
- Miller MD, Krangel MS. The human cytokine I-309 is a monocyte chemoattractant. Proc Natl Acad Sci U S A. 1992;89:2950–2954. doi: 10.1073/pnas.89.7.2950. [DOI] [PMC free article] [PubMed] [Google Scholar]
- Morris L, Graham CF, Gordon S. Macrophages in haemopoietic and other tissues of the developing mouse detected by the monoclonal antibody F4/80. Development. 1991;112:517–526. doi: 10.1242/dev.112.2.517. [DOI] [PubMed] [Google Scholar]
- Muralidharan S, Mandrekar P. Cellular stress response and innate immune signaling: integrating pathways in host defense and inflammation. J Leukoc Biol. 2013;94:1167–1184. doi: 10.1189/jlb.0313153. [DOI] [PMC free article] [PubMed] [Google Scholar]
- Patel IS, Seemungal TA, Wilks M, Lloyd-Owen SJ, Donaldson GC, Wedzicha JA. Relationship between bacterial colonisation and the frequency, character, and severity of COPD exacerbations. Thorax. 2002;57:759–764. doi: 10.1136/thorax.57.9.759. [DOI] [PMC free article] [PubMed] [Google Scholar]
- Poli V. The role of C/EBP isoforms in the control of inflammatory and native immunity functions. J Biol Chem. 1998;273:29279–29282. doi: 10.1074/jbc.273.45.29279. [DOI] [PubMed] [Google Scholar]
- Reimer MK, Brange C, Rosendahl A. CCR8 signaling influences Toll-like receptor 4 responses in human macrophages in inflammatory diseases. Clin Vaccine Immunol. 2011;18:2050–2059. doi: 10.1128/CVI.05275-11. [DOI] [PMC free article] [PubMed] [Google Scholar]
- Rollins BJ. Chemokines. Blood. 1997;90:909–928. [PubMed] [Google Scholar]
- Sato-Nishiwaki M, Aida Y, Abe S, Shibata Y, Kimura T, Yamauchi K, Kishi H, Igarashi A, Inoue S, Sato M, et al. Reduced number and morphofunctional change of alveolar macrophages in MafB gene-targeted mice. PLoS ONE. 2013;8:e73963. doi: 10.1371/journal.pone.0073963. [DOI] [PMC free article] [PubMed] [Google Scholar]
- Seimon TA, Kim MJ, Blumenthal A, Koo J, Ehrt S, Wainwright H, Bekker LG, Kaplan G, Nathan C, Tabas I, et al. Induction of ER stress in macrophages of tuberculosis granulomas. PLoS ONE. 2010;5:e12772. doi: 10.1371/journal.pone.0012772. [DOI] [PMC free article] [PubMed] [Google Scholar]
- Senft AP, Korfhagen TR, Whitsett JA, LeVine AM. Surfactant protein D regulates the cell surface expression of alveolar macrophage beta(2)-integrins. Am J Physiol Lung Cell Mol Physiol. 2007;292:L469–L475. doi: 10.1152/ajplung.00297.2006. [DOI] [PubMed] [Google Scholar]
- Serth J, Kuczyk MA, Bokemeyer C, Hervatin C, Nafe R, Tan HK, Jonas U. p53 immunohistochemistry as an independent prognostic factor for superficial transitional cell carcinoma of the bladder. Br J Cancer. 1995;71:201–205. doi: 10.1038/bjc.1995.41. [DOI] [PMC free article] [PubMed] [Google Scholar]
- Shibata Y, Berclaz PY, Chroneos ZC, Yoshida M, Whitsett JA, Trapnell BC. GM-CSF regulates alveolar macrophage differentiation and innate immunity in the lung through PU.1. Immunity. 2001;15:557–567. doi: 10.1016/S1074-7613(01)00218-7. [DOI] [PubMed] [Google Scholar]
- Shibata Y, Zsengeller Z, Otake K, Palaniyar N, Trapnell BC. Alveolar macrophage deficiency in osteopetrotic mice deficient in macrophage colony-stimulating factor is spontaneously corrected with age and associated with matrix metalloproteinase expression and emphysema. Blood. 2001;98:2845–2852. doi: 10.1182/blood.V98.9.2845. [DOI] [PubMed] [Google Scholar]
- Sironi M, Martinez FO, D’Ambrosio D, Gattorno M, Polentarutti N, Locati M, Gregorio A, Iellem A, Cassatella MA, Van Damme J, et al. Differential regulation of chemokine production by Fcgamma receptor engagement in human monocytes: association of CCL1 with a distinct form of M2 monocyte activation (M2b, Type 2) J Leukoc Biol. 2006;80:342–349. doi: 10.1189/jlb.1005586. [DOI] [PubMed] [Google Scholar]
- Tailleux L, Pham-Thi N, Bergeron-Lafaurie A, Herrmann JL, Charles P, Schwartz O, Scheinmann P, Lagrange PH, de Blic J, Tazi A, et al. DC-SIGN induction in alveolar macrophages defines privileged target host cells for mycobacteria in patients with tuberculosis. PLoS Med. 2005;2:e381. doi: 10.1371/journal.pmed.0020381. [DOI] [PMC free article] [PubMed] [Google Scholar]
- Takabatake N, Shibata Y, Abe S, Wada T, Machiya J, Igarashi A, Tokairin Y, Ji G, Sato H, Sata M, et al. A single nucleotide polymorphism in the CCL1 gene predicts acute exacerbations in chronic obstructive pulmonary disease. Am J Respir Crit Care Med. 2006;174:875–885. doi: 10.1164/rccm.200603-443OC. [DOI] [PubMed] [Google Scholar]
- Tamura T, Nagamura-Inoue T, Shmeltzer Z, Kuwata T, Ozato K. ICSBP directs bipotential myeloid progenitor cells to differentiate into mature macrophages. Immunity. 2000;13:155–165. doi: 10.1016/S1074-7613(00)00016-9. [DOI] [PubMed] [Google Scholar]
- Teran LM. CCL chemokines and asthma. Immunol Today. 2000;21:235–242. doi: 10.1016/S0167-5699(00)01634-0. [DOI] [PubMed] [Google Scholar]
- Tiffany HL, Lautens LL, Gao JL, Pease J, Locati M, Combadiere C, Modi W, Bonner TI, Murphy PM. Identification of CCR8: a human monocyte and thymus receptor for the CC chemokine I-309. J Exp Med. 1997;186:165–170. doi: 10.1084/jem.186.1.165. [DOI] [PMC free article] [PubMed] [Google Scholar]
- Tokairin Y, Shibata Y, Sata M, Abe S, Takabatake N, Igarashi A, Ishikawa T, Inoue S, Kubota I. Enhanced immediate inflammatory response to Streptococcus pneumoniae in the lungs of mice with pulmonary emphysema. Respirology. 2008;13:324–332. doi: 10.1111/j.1440-1843.2007.01229.x. [DOI] [PubMed] [Google Scholar]
- Trebst C, Staugaitis SM, Kivisakk P, Mahad D, Cathcart MK, Tucky B, Wei T, Rani MR, Horuk R, Aldape KD, et al. CC chemokine receptor 8 in the central nervous system is associated with phagocytic macrophages. Am J Pathol. 2003;162:427–438. doi: 10.1016/S0002-9440(10)63837-0. [DOI] [PMC free article] [PubMed] [Google Scholar]
- Wilkinson TM, Donaldson GC, Johnston SL, Openshaw PJ, Wedzicha JA. Respiratory syncytial virus, airway inflammation, and FEV1 decline in patients with chronic obstructive pulmonary disease. Am J Respir Crit Care Med. 2006;173:871–876. doi: 10.1164/rccm.200509-1489OC. [DOI] [PubMed] [Google Scholar]
- Wilson SD, Burd PR, Billings PR, Martin CA, Dorf ME. The expression and regulation of a potential lymphokine gene (TCA3) in CD4 and CD8 T cell clones. J Immunol. 1988;141:1563–1570. [PubMed] [Google Scholar]
- Younce C, Kolattukudy P. MCP-1 induced protein promotes adipogenesis via oxidative stress, endoplasmic reticulum stress and autophagy. Cell Physiol Biochem. 2012;30:307–320. doi: 10.1159/000339066. [DOI] [PubMed] [Google Scholar]
- Yu Y, Zhang Y, Hu S, Jin D, Chen X, Jin Q, Liu H. Different patterns of cytokines and chemokines combined with IFN-gamma production reflect Mycobacterium tuberculosis infection and disease. PLoS ONE. 2012;7:e44944. doi: 10.1371/journal.pone.0044944. [DOI] [PMC free article] [PubMed] [Google Scholar]
- Zhang K, Wong HN, Song B, Miller CN, Scheuner D, Kaufman RJ. The unfolded protein response sensor IRE1alpha is required at 2 distinct steps in B cell lymphopoiesis. J Clin Invest. 2005;115:268–281. doi: 10.1172/JCI200521848. [DOI] [PMC free article] [PubMed] [Google Scholar]
- Zingoni A, Soto H, Hedrick JA, Stoppacciaro A, Storlazzi CT, Sinigaglia F, D’Ambrosio D, O’Garra A, Robinson D, Rocchi M, et al. The chemokine receptor CCR8 is preferentially expressed in Th2 but not Th1 cells. J Immunol. 1998;161:547–551. [PubMed] [Google Scholar]