

Abstract
Asian countries have seen the expansion of combination antiretroviral therapy (cART) over the past decade. The TREAT Asia HIV Observational Database (TAHOD) was established in 2003 comprising 23 urban referral sites in 13 countries across the region. We examined trends in treatment outcomes in patients who initiated cART between 2003 and 2013. Time of cART initiation was grouped into three periods: 2003–2005, 2006–2009, and 2010–2013. We analyzed trends in undetectable viral load (VL; defined as VL <400 copies/ml), CD4 changes from pre-cART levels, and overall survival. Of 6,521 patients included, the overall median CD4 count at cART initiation was 120 cells/μl (interquartile range: 38–218). Despite an increase over time, pre-cART CD4 counts remained <200 cells/μl. Adjusted analyses showed undetectable VL was more likely when starting cART in later years [2006–2009: odds ratio (OR) = 1.76, 95% confidence interval (CI) (1.45, 2.15); and 2010–2013: OR = 3.04, 95% CI (2.33, 3.97), all p < .001, compared to 2003–2005], and survival was improved [2006–2009: subdistribution hazard ratio (SHR) = 0.41, 95% CI (0.27, 0.61), 2010–2013: SHR = 0.29, 95% CI (0.17, 0.49), all p < .001, compared to 2003–2005]. No differences in CD4 response was observed over time. Age and CD4 levels prior to cART initiation were associated with all three treatment outcomes, with older age and higher CD4 counts being associated with undetectable VL. Survival and VL response on cART have improved over the past decade in TAHOD, although CD4 count at cART initiation remained low. Greater effort should be made to facilitate earlier HIV diagnosis and linkage to care and treatment, to achieve greater improvements in treatment outcomes.
Introduction
Resource-limited countries in Asia and Africa have seen a massive scale-up in combination antiretroviral therapy (cART) delivery in the past decade. The improved access to cART is partly due to the World Health Organization (WHO) public health promotion strategies beginning in 2001.1,2 In 2006, the WHO launched a standardized simplified treatment protocol and decentralized service delivery to enable access to cART to HIV-infected adults and children in both public and private sectors.2 HIV-infected patients in many countries in Asia have since been provided with antiretroviral (ARV) drugs free of charge or at a minimal cost.
Despite the scale-up, cART coverage in Asia reached only 33% of those living with HIV compared to 37% in the African region in 2013.3 The TREAT Asia program of amfAR (The Foundation for AIDS Research), established the TREAT Asia HIV Observational Database (TAHOD) in 2003, aimed at evaluating the impact of HIV disease, coinfections, and cART management on clinical outcomes in the Asia-Pacific, to inform HIV care and treatment practices and policies in the region. TAHOD4 is a prospective observational database and adult cohort study that has collected data from 23 sites in 13 countries and territories in Asia. All TAHOD sites are major referral centers in urban cities. In 2012, TAHOD expanded to include data captured from the TREAT Asia Studies to Evaluate Resistance–Monitoring Study (TASER-M)5, which had active patient recruitment between 2006 and 2011. In 2014, TAHOD Low Intensity Transfer (TAHOD-LITE6) was established with the aim of creating a surveillance mechanism for some of the TAHOD participating sites.
As the oldest, longitudinal regional HIV observational cohort in Asia, TAHOD facilitates the evaluation of trends and key treatment outcomes, offering important insights into the past decade of cART delivery in Asia, and informing further improvement of cART services. According to the WHO 2015 guidelines,7 the majority of countries with site participation in TAHOD initiated ART at CD4 ≤ 350 cells/μl with Thailand being the only country in South-East Asia that has adopted the “treat all” approach. Furthermore, a recently published TAHOD study has found that 72% of patients have presented late with older age, injecting drug users and male sex being risk factors for late presentation into care.8
In this study, we investigated time trends and factors associated with CD4 changes, undetectable viral load (VL) and mortality in TAHOD patients initiating cART between 2003 and 2013. Outcomes were not compared across sites or countries as these data are published elsewhere.6
Methods
Patients enrolled in TAHOD from the September 2013 data transfer were included if they initiated cART from 2003 onward. Patients with prior mono/dual ARV exposure were excluded. Year of cART initiation was divided into three periods corresponding to changes in WHO treatment guidelines9,10: 2003–2005, 2006–2009, and 2010–2013. All analysis follow-up time were censored at 3 years from cART initiation to allow comparison of treatment outcomes over the three study periods, as this reflects the maximum follow-up time for those initiating cART between 2010–2013. VL, CD4, and mortality outcomes were those that occurred in the first 3 years from start of cART.
Undetectable VL
Patients included in this sub-analysis were those with at least one VL test available in the first 3 years of cART initiation. Time from cART initiation was divided into 6-monthly intervals to reflect our twice-yearly data transfers: 0–0.5, 0.5–1.0, 1.0–1.5, 1.5–2.0, 2.0–2.5, and 2.5–3.0 years. If there were multiple VL tests in each time interval, the VL closest to the end of that interval was used. Undetectable VL was defined as VL <400 copies/ml. Repeated measures logistic regression models fitted using Generalized Estimating Equations (GEE) were used to estimate the association between clinical characteristics and undetectable VL.
Changes in CD4 cell count
Patients were selected if they had at least one pre-cART CD4 and one post-cART CD4 count available in the first 3 years after treatment initiation. As with the analysis for undetectable VL, time from cART initiation was likewise divided into 6-monthly intervals. If more than one CD4 test was available in each follow-up time interval, the CD4 closest to the end of that interval was used. CD4 change was defined as the difference between the post-cART and the pre-cART CD4 counts. Factors associated with CD4 changes were analyzed using repeated measures linear regression GEE models.
Overall survival
Patients were included if they had at least one follow-up day after the start of cART, or after cohort enrolment for those who enrolled in TAHOD after having already initiated cART. Risk of mortality began from cART initiation and ended on the date of death, however, those who started cART prior to enrolment into TAHOD were included with risk time left truncated at cohort entry date. Fine and Gray's11 competing risk analysis was used to analyze survival time with lost to follow-up (LTFU) cases treated as competing risk. All other patients were censored at the last visit date or 3 years from cART initiation, which ever occurred first. The effect size was presented as the subdistribution hazard ratio (SHR) that represents the hazard ratio (HR) for mortality in the presence of competing risk, and can be interpreted in a similar way as Cox regression model HRs. LTFU was defined as patients not being seen for more than 12 months, excluding deceased and transferred patients. Cumulative incidence curves were plotted for mortality in the presence of competing risks.
Patient characteristics were compared using the chi-squared test for categorical variables and Kruskal–Wallis test for continuous variables. Covariates adjusted in the regression models were year of cART initiation, age, sex, mode of HIV exposure, pre-cART CD4 and VL, initial regimen, hepatitis B/C coinfection, prior AIDS diagnosis, and time from cART initiation. To account for site differences, such as frequency of VL testing, all regression models were adjusted for individual sites and fitted using backward stepwise selection process. Variables significant at p < .10 in the univariate models were chosen for inclusion in the multivariate models. Covariates with p < .05 were considered statistically significant in the final multivariate models.
Data transfers from clinical sites were aggregated at The Kirby Institute, UNSW Australia, at 6-monthly intervals in March and September. Ethics approvals were obtained from the local ethics committees of each TAHOD-participating site and the coordinating center (TREAT Asia/amfAR) and the UNSW Australia Ethics Committee. All data management and statistical analyses were performed using SAS software version 9.3 (SAS Institute, Inc., Cary, NC) and Stata software version 13.1 (Stata Corp., College Station, TX).
Results
A total of 6,521 TAHOD patients from Cambodia, China and Hong Kong SAR, India, Indonesia, Japan, Malaysia, the Philippines, Singapore, South Korea, Taiwan, Thailand and Vietnam met the inclusion criteria and received cART between 2003–2013. The median follow-up time from start of cART was 4.1 years [95% confidence interval (95% CI) (2.4, 6.6)]. Their baseline characteristics are described in Table 1. cART initiation was more common between 2006–2009 (45.4%) than in 2003–2005 (25.4%) or 2010–2013 (29.2%). The high proportion of patients initiating cART in 2006–2009 is attributed to active enrolment for the TASER-M cohort. The median age was 35 years [interquartile range (IQR) 29–41], with the majority of patients being male (69.5%) and reporting heterosexual HIV exposure (62.7%). The initial cART regimen mostly consisted of two nucleoside reverse transcriptase inhibitors (NRTI) and a non-NRTI (NNRTI), with stavudine- and zidovudine-based regimens being the most common.12 These characteristics are also reported by individual country and can be seen in Supplementary Table S1 (Supplementary Data are available online at www.liebertpub.com/aid).
Table 1.
Patient Characteristics
| Year of cART initiation | |||||
|---|---|---|---|---|---|
| Total (%) n = 6,521 (100) | 2003–2005 (%) n = 1,657 (25.4) | 2006–2009 (%) n = 2,961 (45.4) | 2010–2013 (%) n = 1,903 (29.2) | p-Value | |
| Age (years) | |||||
| Median [IQR] | 35 [29–41] | 35 [30–41] | 35 [29–41] | 34 [29–41] | .012 |
| ≤30 | 1,993 (30.6) | 459 (27.7) | 907 (30.6) | 627 (32.9) | .027 |
| 31–40 | 2,758 (42.3) | 749 (45.2) | 1,226 (41.4) | 783 (41.1) | |
| 41–50 | 1,250 (19.2) | 316 (19.1) | 585 (19.8) | 349 (18.3) | |
| >50 | 520 (8.0) | 133 (8.0) | 243 (8.2) | 144 (7.6) | |
| Sex | |||||
| Male | 4,534 (69.5) | 1,127 (68.0) | 2,062 (69.6) | 1,345 (70.7) | .224 |
| Female | 1,987 (30.5) | 530 (32.0) | 899 (30.4) | 558 (29.3) | |
| HIV mode of exposure | |||||
| Heterosexual exposure | 4,087 (62.7) | 1,134 (68.4) | 1,895 (64.0) | 1,058 (55.6) | <.001 |
| Homosexual exposure | 1,334 (20.5) | 292 (17.6) | 586 (19.8) | 456 (24.0) | |
| Injecting drug use | 617 (9.5) | 74 (4.5) | 291 (9.8) | 252 (13.2) | |
| Other/unknown | 483 (7.4) | 157 (9.5) | 189 (6.4) | 137 (7.2) | |
| Pre-cART CD4 (cells/μl) | |||||
| Median [IQR] | 120 [38–218] | 92 [32–184] | 127 [40–213] | 134 [39–251] | <.001 |
| ≤50 | 1,722 (26.4) | 446 (26.9) | 759 (25.6) | 517 (27.2) | <.001 |
| 51–100 | 809 (12.4) | 215 (13.0) | 367 (12.4) | 227 (11.9) | |
| 101–200 | 1,419 (21.8) | 336 (20.3) | 726 (24.5) | 357 (18.8) | |
| >200 | 1,653 (25.3) | 277 (16.7) | 739 (25.0) | 637 (33.5) | |
| Missing | 918 (14.1) | 383 (23.1) | 370 (12.5) | 165 (8.7) | |
| Pre-cART VL (copies/ml) | |||||
| Median [IQR] | 100,000 [31,000–280,195] | 117,000 [28,600–381,000] | 100,000 [34,800–258,000] | 95,963 [26,700–280,195] | .050 |
| <100,000 | 1,616 (24.8) | 248 (15.0) | 855 (28.9) | 513 (27.0) | .216 |
| ≥100,000 | 1,676 (25.7) | 289 (17.4) | 891 (30.1) | 496 (26.1) | |
| Missing | 3,229 (49.5) | 1,120 (67.6) | 1,215 (41.0) | 894 (47.0) | |
| Initial cART regimen | |||||
| NRTI+NNRTI | 5,721 (87.7) | 1,327 (80.1) | 2,674 (90.3) | 1,720 (90.4) | <.001 |
| NRTI+PI | 736 (11.3) | 311 (18.8) | 258 (8.7) | 167 (8.8) | |
| Other combination | 64 (0.98) | 19 (1.1) | 29 (1.0) | 16 (0.8) | |
| Hepatitis B status | |||||
| Negative | 4,572 (70.1) | 1,005 (60.7) | 2,212 (74.7) | 1,355 (71.2) | .448 |
| Positive | 529 (8.1) | 120 (7.2) | 241 (8.1) | 168 (8.8) | |
| Not tested | 1,420 (21.8) | 532 (32.1) | 508 (17.2) | 380 (20.0) | |
| Hepatitis C status | |||||
| Negative | 3,978 (61.0) | 974 (58.8) | 1,851 (62.5) | 1,153 (60.6) | <.001 |
| Positive | 785 (12.0) | 121 (7.3) | 352 (11.9) | 312 (16.4) | |
| Not tested | 1,758 (27.0) | 562 (33.9) | 758 (25.6) | 438 (23.0) | |
| CDC category | |||||
| A | 3,247 (49.8) | 754 (45.5) | 1,375 (46.4) | 1,118 (58.7) | <.001 |
| B | 800 (12.3) | 197 (11.9) | 508 (17.2) | 95 (5.0) | |
| C | 2,474 (37.9) | 706 (42.6) | 1,078 (36.4) | 690 (36.3) | |
p-Values for categorical variables exclude missing or not tested value.
cART, combination antiretroviral therapy; IQR, interquartile range; NRTI, nucleoside reverse transcriptase inhibitors; NNRTI, non-NRTI; PI, protease inhibitor; VL, viral load.
Undetectable VL
A total of 4,735 patients had at least one VL result available in the first 3 years of cART. Figure 1a indicates that the proportion of TAHOD patients with undetectable VL from 6 months of cART onward has remained steady at ∼80%–90% for all time periods of cART initiation.
FIG. 1.
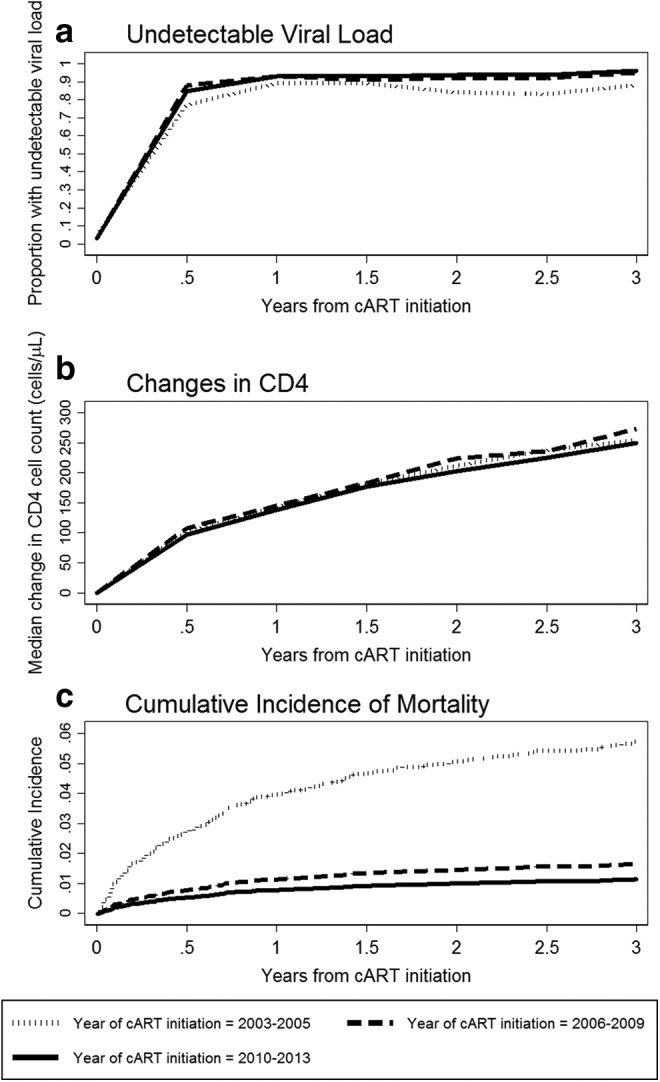
(a) Proportion of undetectable viral load; (b) median changes in CD4 count; and (c) cumulative incidence of mortality.
Table 2 shows factors associated with undetectable VL in the univariate model were year of cART initiation (p < .001), age (p < .001), mode of HIV exposure (p = .011), pre-cART VL (p < .001) and CD4 count (p < .001), hepatitis C coinfection (p = .080), prior AIDS diagnosis (p = .042), and time from cART initiation (p < .001).
Table 2.
Undetectable Viral Load Over 3 Years from Combination Antiretroviral Therapy Initiation
| Univariate | Multivariate | |||||
|---|---|---|---|---|---|---|
| Total of 4,735 patients | OR | 95% CI | p-Value | OR | 95% CI | p-Value |
| Year of cART initiation | <.001 | <.001 | ||||
| 2003–2005 | 1 | 1 | ||||
| 2006–2009 | 1.94 | 1.60, 2.35 | <.001 | 1.76 | 1.45, 2.15 | <.001 |
| 2010–2013 | 3.00 | 2.30, 3.90 | <.001 | 3.04 | 2.33, 3.97 | <.001 |
| Age at cART initiation | <.001 | .001 | ||||
| ≤30 | 1 | 1 | ||||
| 31–40 | 1.13 | 0.94, 1.36 | .183 | 1.10 | 0.92, 1.33 | .298 |
| 41–50 | 1.39 | 1.11, 1.74 | .004 | 1.35 | 1.07, 1.71 | .011 |
| >50 | 1.56 | 1.14, 2.14 | .006 | 1.57 | 1.14, 2.17 | .006 |
| Sex | ||||||
| Male | 1 | |||||
| Female | 0.88 | 0.73, 1.06 | .195 | |||
| HIV exposure | .011 | |||||
| Heterosexual contact | 1 | |||||
| Homosexual contact | 1.28 | 1.00, 1.63 | .047 | |||
| Injecting drug use | 0.73 | 0.55, 0.97 | .032 | |||
| Other/unknown | 0.97 | 0.72, 1.31 | .858 | |||
| Pre-cART VL (copies/ml) | ||||||
| <100,000 | 1 | 1 | ||||
| ≥100,000 | 0.69 | 0.56, 0.84 | <.001 | 0.74 | 0.60, 0.91 | .004 |
| Missing | ||||||
| Pre-cART CD4 (cells/μl) | <.001 | <.001 | ||||
| ≤50 | 1 | 1 | ||||
| 51–100 | 0.98 | 0.76, 1.27 | .890 | 0.98 | 0.76, 1.27 | .900 |
| 101–200 | 1.15 | 0.92, 1.45 | .225 | 1.17 | 0.93, 1.47 | .181 |
| >200 | 1.56 | 1.24, 1.97 | <.001 | 1.49 | 1.18, 1.89 | .001 |
| Missing | ||||||
| Initial cART regimen | .864 | |||||
| NRTI+NNRTI | 1 | |||||
| NRTI+PI | 0.99 | 0.76, 1.28 | .917 | |||
| Other combination | 0.85 | 0.46, 1.55 | .588 | |||
| Hepatitis B coinfection | ||||||
| Negative | 1 | |||||
| Positive | 0.96 | 0.72, 1.28 | .784 | |||
| Not tested | ||||||
| Hepatitis C coinfection | ||||||
| Negative | 1 | |||||
| Positive | 0.80 | 0.62, 1.03 | .080 | |||
| Not tested | ||||||
| Prior AIDS diagnosis | ||||||
| No | 1 | |||||
| Yes | 0.84 | 0.71, 0.99 | .042 | |||
| Time from cART initiation, years | <.001 | <.001 | ||||
| 0.0–0.5 | 1 | 1 | ||||
| 0.5–1.0 | 2.13 | 1.82, 2.49 | <.001 | 2.14 | 1.82, 2.52 | <.001 |
| 1.0–1.5 | 1.95 | 1.65, 2.29 | <.001 | 2.01 | 1.70, 2.38 | <.001 |
| 1.5–2.0 | 2.15 | 1.81, 2.56 | <.001 | 2.24 | 1.88, 2.68 | <.001 |
| 2.0–2.5 | 2.18 | 1.80, 2.63 | <.001 | 2.36 | 1.94, 2.87 | <.001 |
| 2.5–3.0 | 2.82 | 2.27, 3.51 | <.001 | 3.12 | 2.52, 3.88 | <.001 |
Global p-values for age and CD4 are tests for trend. All other global p-values are tests for heterogeneity excluding missing values.
p-Values in bold represent significant covariates in the final model.
CI, confidence interval; OR, odds ratio.
In multivariate analyses, achieving undetectable VL was more likely if cART was initiated in later years [2006–2009: odds ratio (OR) = 1.76, 95% CI (1.45, 2.15), p < .001; and 2010–2013: OR = 3.04, 95% CI (2.33, 3.97), p < .001] compared to 2003–2005. Older age [41–50 years: OR 1.35, 95% CI (1.07, 1.71), p = .011; and >50 years: OR = 1.57, 95% CI (1.14, 2.17), p = .006] compared to age ≤30 years, high pre-cART CD4 count of >200 cells/μl [OR = 1.49, 95% CI (1.18, 1.89), p = .001] compared to ≤50 cells/μl, and longer time since cART initiation [0.5–1.0 years: OR = 2.14, 95% CI (1.82, 2.52); 1.0–1.5 years: OR = 2.01, 95% CI (1.70, 2.38); 1.5–2.0 years: OR = 2.24, 95% CI (1.88, 2.68); 2.0–2.5 years: OR = 2.36, 95% CI (1.94, 2.87); and 2.5–3.0 years: OR = 3.12, 95% CI (2.52, 3.88), all p < .001, compared to 0.0–0.5 years] were also associated with achieving VL suppression. Patients who started cART with VL ≥100,000 copies/ml were less likely to show undetectable VL in the first 3 years [OR = 0.74, 95% CI (0.60, 0.91), p = .004].
Changes in CD4 cell count
There were 5,244 patients with a CD4 cell count available before and after cART initiation. Figure 1b illustrates that there has been a continued increase in the median CD4 gain over time, with very little differences between periods of cART initiation. The median increase from pretreatment values reached ∼250 cells/μl at 3 years from cART.
Table 3 shows that year of cART initiation was the only variable not associated with changes in CD4 in both the univariate and multivariate regression analyses. The adjusted model shows that characteristics associated with higher mean CD4 increase over 3 years were female sex [difference = 17 cells/μl compared to male, 95% CI (9, 26), p < .001], homosexual contact [difference = 20 cells/μl compared to heterosexual exposure, 95% CI (7, 32), p = .002], high pre-cART VL of ≥100,000 copies/ml [difference = 32 cells/μl, 95% CI (22, 42), p < .001], protease inhibitor (PI)- based regimen [difference = 28 cells/μl compared to NNRTI-based regimen, 95% CI (6, 50), p = .013], prior AIDS diagnosis [difference = 10 cells/μl, 95% CI (1, 19), p = .025], and increasing time on cART compared to the first 6 months (all p < .001). The mean CD4 increase for patients in the 41–50 year old age group was 19 cells/μl less than the increase for the ≤30 year old group [95% CI (−30, −8), p < .001]. The CD4 gain was smaller for those aged above 50 years [difference = −25 cells/μl, 95% CI (−42, −9), p < .001].
Table 3.
CD4 Changes from Over 3 Years from Combination Antiretroviral Therapy Initiation
| Univariate | Multivariate | |||||
|---|---|---|---|---|---|---|
| Total of 5,244 patients | Diff | 95% CI | p-Value | Diff | 95% CI | p-Value |
| Year of cART initiation | .444 | |||||
| 2003–2005 | Ref | |||||
| 2006–2009 | 4 | −7, 15 | .470 | |||
| 2010–2013 | −4 | −16, 8 | .537 | |||
| Age at cART initiation | <.001 | <.001 | ||||
| ≤30 | Ref | Ref | ||||
| 31–40 | −4 | −14, 6 | .404 | −4 | −14, 6 | .434 |
| 41–50 | −19 | −30, −8 | .001 | −19 | −30, −8 | .001 |
| >50 | −28 | −44, −12 | .001 | −25 | −42, −9 | .002 |
| Sex | ||||||
| Male | Ref | Ref | ||||
| Female | 15 | 7, 23 | <.001 | 17 | 9, 26 | <.001 |
| HIV exposure | .005 | .007 | ||||
| Heterosexual contact | Ref | Ref | ||||
| Homosexual contact | 11 | −1, 24 | .075 | 20 | 7, 32 | .002 |
| Injecting drug use | −19 | −33, −6 | .004 | −9 | −25, 6 | .223 |
| Other/unknown | 7 | −9, 23 | .414 | 10 | −6, 26 | .224 |
| Pre-cART VL (copies/ml) | ||||||
| <100,000 | Ref | |||||
| ≥100,000 | 36 | 25, 46 | <.001 | 32 | 22, 42 | <.001 |
| Missing | ||||||
| Pre-cART CD4 (cells/μl) | <.001 | .008 | ||||
| ≤50 | Ref | Ref | ||||
| 51–100 | 5 | −5, 16 | .328 | 5 | −5, 15 | .303 |
| 101–200 | −2 | −11, 7 | .641 | −1 | −11, 9 | .843 |
| >200 | −22 | −32, −12 | <.001 | −16 | −28, −4 | .008 |
| Initial cART regimen | .006 | .014 | ||||
| NRTI+NNRTI | Ref | Ref | ||||
| NRTI+PI | 32 | 10, 54 | .004 | 28 | 6, 50 | .013 |
| Other combination | −9 | −44, 27 | .636 | −11.85 | −47, 23 | .503 |
| Hepatitis B coinfection | ||||||
| Negative | Ref | Ref | ||||
| Positive | −17 | −29, −5 | .004 | −17 | −28, −5 | .004 |
| Not tested | ||||||
| Hepatitis C coinfection | ||||||
| Negative | Ref | Ref | ||||
| Positive | −22 | −33, −11 | <.001 | −15 | −28, −3 | .015 |
| Not tested | ||||||
| Prior AIDS diagnosis | ||||||
| No | Ref | Ref | ||||
| Yes | 13 | 6, 21 | .001 | 10 | 1, 19 | .025 |
| Time from cART initiation, years | <.001 | <.001 | ||||
| 0.0–0.5 | Ref | Ref | ||||
| 0.5–1.0 | 45 | 41, 49 | <.001 | 45 | 41, 49 | <.001 |
| 1.0–1.5 | 90 | 85, 94 | <.001 | 90 | 85, 94 | <.001 |
| 1.5–2.0 | 120 | 115, 125 | <.001 | 120 | 115, 125 | <.001 |
| 2.0–2.5 | 141 | 136, 147 | <.001 | 141 | 136, 147 | <.001 |
| 2.5–3.0 | 165 | 160, 171 | <.001 | 165 | 159, 171 | <.001 |
Global p-values for age and CD4 are tests for trend. All other global p-values are tests for heterogeneity excluding missing values.
p-Values in bold represent significant covariates in the final model.
Other covariates associated with smaller increases compared to the reference group were pre-cART CD4 > 200 cells/μl [difference = −16 cells/μl, 95% CI (−28, −4), p = .008], positive hepatitis B coinfection [difference = −17 cells/μl, 95% CI (−28, −5), p = .004], and positive hepatitis C coinfection [difference = −15 cells/μl, 95% CI (−28, −3), p = .015].
Overall survival
Among 5,653 patients with follow-up, there were 191 deaths in the first 3 years of cART, with a crude mortality rate of 1.6 per 100 person-years [100 pys; 95% CI (1.39, 1.85)]. The number of patients who were considered LTFU was 478 patients. The overall rate of LTFU was 4.02 per 100 pys [95% CI (3.67, 4.39)]. By country, the LTFU rates ranged from 0.22 to 8.80 per 100 pys, with 7/13 countries having rates <2.00 per 100 pys. By year of cART initiation, the LTFU rates ranged from 2.51 to 5.00 per 100 pys. Table 4 shows that in the presence of competing risk, the hazard for mortality decreased for later years of cART initiation. Other variables associated with better survival in the unadjusted model were age (p < .001), sex (p < .018), mode of HIV exposure (p = .002), pre-cART VL (p = .017), pre-cART CD4 count (p < .001), hepatitis C coinfection (p = .018), and prior AIDS diagnosis (p < .001).
Table 4.
Mortality Over 3 Years from Combination Antiretroviral Therapy Initiation
| Univariate | Multivariate | ||||||||||
|---|---|---|---|---|---|---|---|---|---|---|---|
| No. of patients | Follow-up (years) | No. of deaths | Mortality rate (/100 pys) | 95% CI | SHR | 95% CI | p-Value | SHR | 95% CI | p-Value | |
| Total | 5,653 | 11,921.42 | 191 | 1.6 | 1.39, 1.85 | ||||||
| Year of cART initiation | <.001 | <.001 | |||||||||
| 2003–2005 | 1,352 | 2,750.48 | 58 | 2.11 | 1.63, 2.73 | 1 | 1 | ||||
| 2006–2009 | 2,598 | 5,963.95 | 76 | 1.27 | 1.02, 1.60 | 0.35 | 0.24, 0.52 | <.001 | 0.41 | 0.27, 0.61 | <.001 |
| 2010–2013 | 1,703 | 3,206.98 | 57 | 1.78 | 1.37, 2.30 | 0.24 | 0.14, 0.39 | <.001 | 0.29 | 0.17, 0.49 | <.001 |
| Age at cART initiation | <.001 | <.001 | |||||||||
| ≤30 | 1,710 | 3,493.88 | 37 | 1.06 | 0.77, 1.46 | 1 | 1 | ||||
| 31–40 | 2,382 | 5,049.37 | 72 | 1.43 | 1.13, 1.80 | 1.41 | 0.94, 2.11 | .099 | 1.29 | 0.86, 1.94 | .212 |
| 41–50 | 1,093 | 2,389.3 | 38 | 1.59 | 1.16, 2.19 | 1.56 | 0.98, 2.47 | .059 | 1.50 | 0.94, 2.38 | .090 |
| >50 | 468 | 988.87 | 44 | 4.45 | 3.31, 5.98 | 4.79 | 3.06, 7.48 | <.001 | 4.93 | 3.19, 7.62 | <.001 |
| Sex | |||||||||||
| Male | 3,939 | 8,325.07 | 147 | 1.77 | 1.50, 2.08 | 1 | |||||
| Female | 1,714 | 3,596.35 | 44 | 1.22 | 0.91, 1.64 | 0.64 | 0.45, 0.93 | .018 | |||
| HIV exposure | .002 | ||||||||||
| Heterosexual contact | 3,492 | 7,381.67 | 120 | 1.63 | 1.36, 1.94 | 1 | |||||
| Homosexual contact | 1,157 | 2,604.39 | 21 | 0.81 | 0.53, 1.24 | 0.40 | 0.22, 0.72 | .002 | |||
| Injecting drug use | 557 | 976.81 | 30 | 3.07 | 2.15, 4.39 | 1.45 | 0.87, 2.40 | .152 | |||
| Other/unknown | 447 | 958.54 | 20 | 2.09 | 1.35, 3.23 | 1.28 | 0.74, 2.22 | .376 | |||
| Pre-cART VL (copies/ml) | |||||||||||
| <100,000 | 1,511 | 3,441.2 | 35 | 1.02 | 0.73, 1.42 | 1 | |||||
| ≥100,000 | 1,535 | 3,505.64 | 66 | 1.88 | 1.48, 2.40 | 1.65 | 1.09, 2.49 | .017 | |||
| Missing | 2,607 | 4,974.58 | 90 | 1.81 | 1.47, 2.22 | ||||||
| Pre-cART CD4 (cells/μl) | <.001 | .034 | |||||||||
| ≤50 | 1,488 | 3,076.88 | 81 | 2.63 | 2.12, 3.27 | 1 | 1 | ||||
| 51–100 | 692 | 1,461.89 | 26 | 1.78 | 1.21, 2.61 | 0.68 | 0.44, 1.06 | .092 | 0.80 | 0.52, 1.25 | .330 |
| 101–200 | 1,223 | 2,641.86 | 36 | 1.36 | 0.98, 1.89 | 0.55 | 0.36, 0.82 | .004 | 0.74 | 0.47, 1.16 | .189 |
| >200 | 1,475 | 3,214.98 | 25 | 0.78 | 0.53, 1.15 | 0.32 | 0.20, 0.50 | <.001 | 0.54 | 0.33, 0.89 | .016 |
| Missing | 775 | 1,525.8 | 23 | 1.51 | 1.00, 2.27 | ||||||
| Initial cART regimen | .464 | ||||||||||
| NRTI+NNRTI | 4,973 | 10,437.89 | 174 | 1.67 | 1.44, 1.93 | 1 | |||||
| NRTI+PI | 623 | 1,356.24 | 14 | 1.03 | 0.61, 1.74 | 1.04 | 0.52, 2.08 | .915 | |||
| Other combination | 57 | 127.29 | 3 | 2.36 | 0.76, 7.31 | 2.06 | 0.66, 6.48 | .216 | |||
| Hepatitis B coinfection | |||||||||||
| Negative | 3,995 | 8,580.24 | 124 | 1.45 | 1.21, 1.72 | 1 | |||||
| Positive | 455 | 994.02 | 14 | 1.41 | 0.83, 2.38 | 0.94 | 0.53, 1.64 | .819 | |||
| Not tested | 1,203 | 2,347.15 | 53 | 2.26 | 1.73, 2.96 | ||||||
| Hepatitis C coinfection | |||||||||||
| Negative | 3,430 | 7,491.58 | 103 | 1.37 | 1.13, 1.67 | 1 | 1 | ||||
| Positive | 701 | 1,304.09 | 33 | 2.53 | 1.80, 3.56 | 1.70 | 1.10, 2.62 | .018 | 1.72 | 1.10, 2.68 | .017 |
| Not tested | 1,522 | 3,125.74 | 55 | 1.76 | 1.35, 2.29 | ||||||
| Prior AIDS diagnosis | |||||||||||
| No | 3,474 | 7,416.78 | 66 | 0.89 | 0.70, 1.13 | 1 | 1 | ||||
| Yes | 2,179 | 4,504.63 | 125 | 2.77 | 2.33, 3.31 | 3.08 | 2.25, 4.22 | <.001 | 2.35 | 1.64, 3.36 | <.001 |
Global p-values for age and CD4 are tests for trend. All other global p-values are tests for heterogeneity excluding missing values.
p-Values in bold represent significant covariates in the final model.
pys, person-years; SHR, subdistribution hazard ratio.
The multivariate model shows CD4 count of >200 cells/μl was associated with improved survival [SHR = 0.54 compared to CD4 ≤50 cells/μl, 95% CI (0.33, 0.89), p = .016]. Survival was better in later periods of cART with the hazards reducing for more recent years [2006–2009: SHR = 0.41, 95% CI (0.27, 0.61); and 2010–2013: SHR = 0.29, 95% CI (0.17, 0.49), all p < .001, compared to 2003–2005]. This can also be seen in Figure 1c where the cumulative incidence curve for mortality for 2003–2005 was much higher than the other two time periods. The 2010–2013 curve was lowest, remaining below 10% over 3 years.
Covariates associated with poorer survival were age >50 years [SHR = 4.93 compared to age ≤30 years, 95% CI (3.19, 7.62), p < .001], positive hepatitis C coinfection [SHR = 1.72, 95% CI (1.10, 2.68), p = .017], and prior AIDS diagnosis [SHR = 2.35, 95% CI (1.64, 3.36), p < .001].
Supplementary Figure S1 is an extension of Figure 1, which shows graphical illustrations of proportions with undetectable VL, median changes in CD4 count, and mortality up to 10 years after cART initiation. This figure shows that proportions with undetectable VL remained high, with increasing median CD4 changes. Survival probability at 10 years for those in the 2003–2005 group was above 80%.
Discussion
The past decade of TAHOD showed that cART initiation in later years was associated with more frequent undetectable VL and improved survival. No association was seen with the magnitude of CD4 changes over time. There was a positive overall increase in the proportion of patients with VL suppression and increase in CD4 count gains over the 3 years from cART initiation. Additionally, the cumulative mortality incidence was noticeably higher for patients who started prior to 2006.
The odds of achieving undetectable VL was tripled if cART was initiated in 2010–2013 and almost doubled for 2006–2009, compared to prior 2006. This is consistent with findings from a South African study, which showed reduced risk for virological failure in later years of cART initiation.13 However, due to the limited availability of VL testing in resource-poor countries in the early time periods of our study,14 the differences we observed may reflect more targeted VL testing to confirm failure, rather than suboptimal treatment response in the early years of cART. The WHO now recommends VL testing every 12 months after starting cART if VL testing is routinely available.15 Our TAHOD sites consist mainly of low to middle-income country settings, with the majority reporting VL testing being done on average less than once per year.16 Although site has been adjusted in the analyses to account for any heterogeneity across sites, the effects of different cART initiation periods on VL outcomes should be interpreted with caution. Additionally, the results are only representative of those who were included in the analyses and not of the entire cohort.
The overall median CD4 count at time of cART initiation was 120 cells/μl with patients starting in 2003–2005 having the lowest median CD4 of 92 cells/μl, and those starting cART in 2010–2013 showing a median CD4 count of 134 cells/μl. These values are comparable to those found in Sub-Saharan Africa where the mean CD4 count at cART initiation in 2002 was 152 cells/μl with no significant increase over time until 2013.17 Although the proportion of late cART starters in TAHOD has decreased over time, there is still a significant number of HIV-infected individuals presenting at later stages of disease, which is associated with reduced effectiveness of cART.18 Furthermore, our results indicate that achieving cART initiation at the WHO recommended threshold of <500 cells/μl15 may not be feasible in many settings in the Asia-Pacific region without more successful HIV testing programs and immediate linkage to care.
CD4 recovery from pretreatment values continued over time, with an average increase of ∼250 cells/μl after 3 years on cART. The changes in CD4 were positively associated with treatment duration, although the cART initiation time periods had no effect on the CD4 increase, as has been shown in other studies.19–21
Mortality rates in TAHOD have decreased across different periods of cART initiation. With LTFU as a competing risk, the adjusted SHR in the first 3 years decreased as time of cART initiation advanced. This was to be expected due to advances in treatment guidelines over the past decade.1,15,22 These findings are similar to observations from other resource-limited settings where the HR for mortality has also been shown to decrease over time.23,24
The rate of LTFU in TAHOD (4.02 per 100 pys) is relatively low compared to those seen in routine care programs in African countries, where proportions of LTFU as high as 39% have been reported.25 This is possibly due to the TAHOD recruitment processes where consecutive samples of patients who were likely to remain in care were chosen. Factors associated with LTFU in TAHOD have been reported in previous literature, with younger age, HIV VL >500 copies, shorter history of HIV infection, no prior mono or dual therapy, and those receiving PI-based regimen being associated with LTFU.26 It has been shown that there is an association between mortality and LTFU in the African region, where mortality is likely to have occurred within 3 months of being LTFU.27–29 In TAHOD, however, the risk of death in those LTFU remains unclear. A linkage study of the Australian HIV Observational Database (AHOD), which has an LTFU rate similar to that of TAHOD, revealed that being LTFU was not associated with increased risk of mortality.30,31
Overall, the effects of other adjusted characteristics in the regression models are consistent with previous findings.4,12,16,32,33 Age and CD4 count were both significantly associated with the three treatment outcomes. Older age showed an association with lower CD4 increase and an increased risk of mortality. Achieving undetectable VL, however, was more likely in older patients. Patients initiating cART at high CD4 count had better survival, smaller increases in CD4 count, and were more likely to be virologically suppressed. Hepatitis C coinfection was associated with poorer survival and lower CD4 changes. However, it is important to note that there may be a high correlation between injecting drug use and hepatitis C coinfection, thus making it difficult to determine the underlying association.
The positive outcomes of homosexual HIV exposure and PI-based regimens on changes in CD4 count could be attributed to socioeconomic factors and other confounders that could not be adjusted for in this study. A published study34 has shown that patients with these two characteristics were more likely to show good cART adherence, which could in turn lead to better treatment responses. Moreover, a previous TAHOD analysis has also shown that approximately two-thirds of TAHOD patients with CD4 < 200 cells/μl were taking pneumocystis prophylaxis, mainly co-trimoxazole and this was found to be a significant factor in lowering mortality rates,35 another potential confounder in our analyses.
Our study was limited by the shorter maximum follow-up time available from those who initiated cART in 2010–2013. Although patients initiating cART in earlier years had longer follow-up time, we limited our analyses to 3 years to be able to compare treatment outcomes across multiple initiation time periods. However, graphical illustrations have been extended to include follow-up time of 10 years in Supplementary Figure S1. Another limitation of the study was that cART adherence information in TAHOD did not form part of routine data collection until 2011, however, risk factors for suboptimal adherence have been reported previously in TASER-M, with sites that assessed adherence less frequently being associated with suboptimal adherence.34 It is known that suboptimal adherence to cART compromises treatment response and is associated with VL failure, poor CD4 recovery, and the development of HIV drug resistance mutations.36–38 Therefore, our results must be interpreted with caution due to the absence of adherence data. In addition, as TAHOD sites are primarily urban referral centers, our findings may not be representative of the 13 countries and territories where they are located or of the broader Asia-Pacific region.
Conclusions
Over a decade of cART use in TAHOD, we found that virological response and survival improved over time in our cohort. Median CD4 count prior to treatment initiation has remained lower than targets set by international guidelines, and changes in CD4 count after starting cART were similar across all time periods. Although TAHOD patients have benefited from the increasing availability of cART and advances in HIV treatment options, HIV-infected patients in Asia continue to be linked to treatment at late stages of their disease. Greater effort to ensure earlier HIV diagnosis so that patients can be referred into treatment is required to control the regional epidemic.
Funding
The TAHOD is an initiative of TREAT Asia, a program of amfAR, The Foundation for AIDS Research, with support from the U.S. National Institutes of Health's National Institute of Allergy and Infectious Diseases, Eunice Kennedy Shriver National Institute of Child Health and Human Development, and National Cancer Institute, as part of the International Epidemiologic Databases to Evaluate AIDS (IeDEA; U01AI069907). TREAT Asia is also supported by ViiV Healthcare. The Kirby Institute is funded by the Australian Government Department of Health and Ageing, and is affiliated with the Faculty of Medicine, UNSW Australia (The University of New South Wales). The content of this publication is solely the responsibility of the authors and does not necessarily represent the official views of any of the governments or institutions mentioned above.
Supplementary Material
Contributor Information
Collaborators: The TREAT Asia HIV Observational Database (TAHOD) Network
Acknowledgments
C.V. Mean, V. Saphonn*, and V. Khol: National Center for HIV/AIDS, Dermatology & STDs, and University of Health Sciences, Phnom Penh, Cambodia; F.J. Zhang*, H.X. Zhao, and N. Han: Beijing Ditan Hospital, Capital Medical University, Beijing, China; M.P. Lee*,‡, P.C.K. Li, W. Lam, and Y.T. Chan: Queen Elizabeth Hospital, Hong Kong, China; N. Kumarasamy*, S Saghayam, and C Ezhilarasi: Chennai Antiviral Research and Treatment Clinical Research Site (CART CRS), YRGCARE Medical Centre, VHS, Chennai, India; S. Pujari*, K. Joshi, S. Gaikwad, and A Chitalikar: Institute of Infectious Diseases, Pune, India; T.P. Merati*,†, D.N. Wirawan, and F. Yuliana: Faculty of Medicine Udayana University and Sanglah Hospital, Bali, Indonesia; E. Yunihastuti*, D. Imran, and A. Widhani: Working Group on AIDS Faculty of Medicine, University of Indonesia/Cipto Mangunkusumo Hospital, Jakarta, Indonesia; S. Oka*, J. Tanuma, and T. Nishijima: National Center for Global Health and Medicine, Tokyo, Japan; J.Y. Choi*, Na S, and J.M. Kim: Division of Infectious Diseases, Department of Internal Medicine, Yonsei University College of Medicine, Seoul, South Korea; B.L.H. Sim*, Y.M. Gani, and R. David: Hospital Sungai Buloh, Sungai Buloh, Malaysia; A. Kamarulzaman*, S.F. Syed Omar, S. Ponnampalavanar, and I. Azwa: University Malaya Medical Centre, Kuala Lumpur, Malaysia; M. Mustafa and N. Nordin: Hospital Raja Perempuan Zainab II, Kota Bharu, Malaysia; R. Ditangco*, E. Uy, and R Bantique: Research Institute for Tropical Medicine, Manila, Philippines; W.W. Wong*, W.W. Ku, and P.C. Wu: Taipei Veterans General Hospital, Taipei, Taiwan; O.T. Ng*, P.L. Lim, L.S. Lee, and P.S. Ohnmar: Tan Tock Seng Hospital, Singapore; P. Phanuphak*, K. Ruxrungtham, A. Avihingsanon, and P. Chusut: HIV-NAT/Thai Red Cross AIDS Research Centre, Bangkok, Thailand; S. Kiertiburanakul*, S. Sungkanuparph, L. Chumla, and N. Sanmeema: Faculty of Medicine Ramathibodi Hospital, Mahidol University, Bangkok, Thailand; R. Chaiwarith*, T. Sirisanthana, W. Kotarathititum and J. Praparattanapan: Research Institute for Health Sciences, Chiang Mai, Thailand; P. Kantipong* and P. Kambua: Chiangrai Prachanukroh Hospital, Chiang Rai, Thailand; W. Ratanasuwan* and R. Sriondee: Faculty of Medicine, Siriraj Hospital, Mahidol University, Bangkok, Thailand; K.V. Nguyen*, H.V. Bui, D.T.H. Nguyen, and D.T. Nguyen: National Hospital for Tropical Diseases, Hanoi, Vietnam; T.T. Pham*, D.D. Cuong, and H.L. Ha: Bach Mai Hospital, Hanoi, Vietnam; A.H. Sohn*, N. Durier*, and B. Petersen: TREAT Asia, amfAR—The Foundation for AIDS Research, Bangkok, Thailand; D.A. Cooper, M.G. Law*, A. Jiamsakul*, and D.C. Boettiger: The Kirby Institute, UNSW Australia, Sydney, Australia.
*TAHOD Steering Committee member; †Steering Committee Chair; ‡co-Chair.
Author Disclosure Statement
K.R. has been serving as a consultant for Merck, Tibotec, and Mylan. He has had paid speaking engagements with Bristol-Meyers Squibb, Merck, Roche, Janssen-Cilag, GlaxoSmithKline, Gilead, Abbvie, Thai GPO, and Mylan Lab limited. All other authors reported no conflicts of interest.
References
- 1.World Health Organization: Scaling up anti-retroviral therapy in resource-limited settings: Guidelines for a public health approach. Available at http://apps.who.int/medicinedocs/en/d/Js2888e/, accessed February14, 2014
- 2.Gilks CF, Crowley S, Ekpini R, et al. : The WHO public-health approach to antiretroviral treatment against HIV in resource-limited settings. Lancet 2006;368:505–510 [DOI] [PubMed] [Google Scholar]
- 3.World Health Organization: Global update on the health sector response to HIV. Available at www.who.int/hiv/pub/progressreports/update2014/en/ (2014), accessed January22, 2015
- 4.Zhou J, Kumarasamy N, Ditangco R, et al. : The TREAT Asia HIV Observational Database: Baseline and retrospective data. J Acquir Immune Defic Syndr 2005;38:174–179 [DOI] [PMC free article] [PubMed] [Google Scholar]
- 5.Sungkanuparph S, Oyomopito R, Sirivichayakul S, et al. : HIV-1 drug resistance mutations among antiretroviral-naive HIV-1-infected patients in Asia: Results from the TREAT Asia Studies to Evaluate Resistance-Monitoring Study. Clin Infect Dis 2011;52:1053–1057 [DOI] [PMC free article] [PubMed] [Google Scholar]
- 6.TAHOD-LITE: Antiretroviral treatment for adult HIV infection in Asia, 1998 to 2013. Available at http://kirby.unsw.edu.au/publications/tahod-lite-antiretroviral-treatment-adult-hiv-infection-asia-1998-2013, accessed January22, 2016
- 7.World Health Organization: Guideline on when to start antiretroviral therapy and on pre-exposure prophylaxis on HIV. Available at http://apps.who.int/iris/bitstream/10665/186275/1/9789241509565_eng.pdf (2015), accessed January22, 2016 [PubMed]
- 8.Jeong SJ, Italiano C, Chaiwarith R, et al. : Late presentation into care of HIV disease and its associated factors in Asia: Results of TAHOD. AIDS Res Hum Retroviruses 2016;32:255–261 [DOI] [PMC free article] [PubMed] [Google Scholar]
- 9.World Health Organization: Antiretroviral therapy for HIV infection in adults and adolescents: Recommendations for a public health approach. Available at www.who.int/hiv/pub/guidelines/artadultguidelines.pdf (2006. revision), accessed February17, 2015 [PubMed]
- 10.World Health Organization: Antiretroviral therapy for HIV infection in adults and adolescents: Recommendations for a public health approach. Available at http://whqlibdoc.who.int/publications/2010/9789241599764_eng.pdf (2010. revision), accessed February17, 2015 [PubMed]
- 11.Fine JP, Gray RJ: A proportional hazards model for the subdistribution of a competing risk. J Am Stat Assoc 1999;94:496–509 [Google Scholar]
- 12.Boettiger DC, Kerr S, Ditangco R, et al. : Trends in first-line antiretroviral therapy in Asia: Results from the TREAT Asia HIV observational database. PLoS One 2014;9:e106525. [DOI] [PMC free article] [PubMed] [Google Scholar]
- 13.Boulle A, Van Cutsem G, Hilderbrand K, et al. : Seven-year experience of a primary care antiretroviral treatment programme in Khayelitsha, South Africa. AIDS 2010;24:563–572 [DOI] [PubMed] [Google Scholar]
- 14.Calmy A, Ford N, Hirschel B, et al. : HIV viral load monitoring in resource-limited regions: Optional or necessary? Clin Infect Dis 2007;44:128–134 [DOI] [PubMed] [Google Scholar]
- 15.World Health Organization: Consolidated guidelines on the use of antiretroviral drugs for treatment and preventing HIV infection: Recommendations for a public health approach. Available at http://apps.who.int/iris/bitstream/10665/85321/1/9789241505727_eng.pdf (June 2013), accessed January8, 2014 [PubMed]
- 16.Oyomopito R, Lee MP, Phanuphak P, et al. : Measures of site resourcing predict virologic suppression, immunologic response and HIV disease progression following highly active antiretroviral therapy (HAART) in the TREAT Asia HIV Observational Database (TAHOD). HIV Med 2010;11:519–529 [DOI] [PMC free article] [PubMed] [Google Scholar]
- 17.Siedner MJ, Ng CK, Bassett IV, Katz IT, Bangsberg DR, Tsai AC: Trends in CD4 count at presentation to care and treatment initiation in sub-Saharan Africa, 2002–2013: A meta-analysis. Clin Infect Dis 2015;60:1120–1127 [DOI] [PMC free article] [PubMed] [Google Scholar]
- 18.Kiertiburanakul S, Boettiger D, Lee MP, et al. : Trends of CD4 cell count levels at the initiation of antiretroviral therapy over time and factors associated with late initiation of antiretroviral therapy among Asian HIV-positive patients. J Int AIDS Soc 2014;17:18804. [DOI] [PMC free article] [PubMed] [Google Scholar]
- 19.Crawford K, Wakabi S, Magala F, Kibuuka H, Liu M, Hamm T: Evaluation of treatment outcomes for patients on first-line regimens in US President's Emergency Plan for AIDS Relief (PEPFAR) clinics in Uganda: Predictors of virological and immunological response from RV288 analyses. HIV Med 2015;16:95–104 [DOI] [PubMed] [Google Scholar]
- 20.Smit M, Smit C, Geerlings S, et al. : Changes in first-line cART regimens and short-term clinical outcome between 1996 and 2010 in the Netherlands. PLoS One 2013;8:e76071. [DOI] [PMC free article] [PubMed] [Google Scholar]
- 21.Nglazi MD, Lawn SD, Kaplan R, et al. : Changes in programmatic outcomes during 7 years of scale-up at a community-based antiretroviral treatment service in South Africa. J Acquir Immune Defic Syndr 2011;56:e1–e8 [DOI] [PMC free article] [PubMed] [Google Scholar]
- 22.World Health Organization: Antiretroviral therapy for HIV infection in adults and adolescents. Recommendations for a public health approach. Available at www.who.int/hiv/pub/arv/adult2010/en/index.html (2010. revision), accessed January16, 2013 [PubMed]
- 23.Grimsrud A, Balkan S, Casas EC, et al. : Outcomes of antiretroviral therapy over a 10-year period of expansion: A multicohort analysis of African and Asian HIV programs. J Acquir Immune Defic Syndr 2014;67:e55–e66 [DOI] [PubMed] [Google Scholar]
- 24.Boulle A, Schomaker M, May MT, et al. : Mortality in patients with HIV-1 infection starting antiretroviral therapy in South Africa, Europe, or North America: A collaborative analysis of prospective studies. PLoS Med 2014;11:e1001718. [DOI] [PMC free article] [PubMed] [Google Scholar]
- 25.Rosen S, Fox MP, Gill CJ: Patient retention in antiretroviral therapy programs in sub-Saharan Africa: A systematic review. PLoS Med 2007;4:e298. [DOI] [PMC free article] [PubMed] [Google Scholar]
- 26.Zhou J, Tanuma J, Chaiwarith R, et al. : Loss to followup in HIV-infected patients from Asia-Pacific region: Results from TAHOD. AIDS Res Treat 2012;2012:375217. [DOI] [PMC free article] [PubMed] [Google Scholar]
- 27.Van Cutsem G, Ford N, Hildebrand K, et al. : Correcting for mortality among patients lost to follow up on antiretroviral therapy in South Africa: A cohort analysis. PLoS One 2011;6:e14684. [DOI] [PMC free article] [PubMed] [Google Scholar]
- 28.Yu JK, Chen SC, Wang KY, et al. : True outcomes for patients on antiretroviral therapy who are “lost to follow-up” in Malawi. Bull World Health Organ 2007;85:550–554 [DOI] [PMC free article] [PubMed] [Google Scholar]
- 29.Cornell M, Lessells R, Fox MP, et al. : Mortality among adults transferred and lost to follow-up from antiretroviral therapy programmes in South Africa: A multicenter cohort study. J Acquir Immune Defic Syndr 2014;67:e67–e75 [DOI] [PMC free article] [PubMed] [Google Scholar]
- 30.McManus H, Petoumenos K, Brown K, et al. : Loss to follow-up in the Australian HIV observational database. Antivir Ther 2015;20:731–741 [DOI] [PMC free article] [PubMed] [Google Scholar]
- 31.Guy R, Wand H, McManus H, et al. : Antiretroviral treatment interruption and loss to follow-up in two HIV cohorts in Australia and Asia: Implications for ‘test and treat’ prevention strategy. AIDS Patient Care STDS 2013;27:681–691 [DOI] [PMC free article] [PubMed] [Google Scholar]
- 32.Falster K, Choi JY, Donovan B, et al. : AIDS-related and non-AIDS-related mortality in the Asia-Pacific region in the era of combination antiretroviral treatment. AIDS 2009;23:2323–2336 [DOI] [PMC free article] [PubMed] [Google Scholar]
- 33.Fatti G, Mothibi E, Meintjes G, Grimwood A: Antiretroviral treatment outcomes amongst older adults in a large multicentre cohort in South Africa. PLoS One 2014;9:e100273. [DOI] [PMC free article] [PubMed] [Google Scholar]
- 34.Jiamsakul A, Kumarasamy N, Ditangco R, et al. : Factors associated with suboptimal adherence to antiretroviral therapy in Asia. J Int AIDS Soc 2014;17:18911. [DOI] [PMC free article] [PubMed] [Google Scholar]
- 35.Lim PL, Zhou J, Ditangco RA, et al. : Failure to prescribe pneumocystis prophylaxis is associated with increased mortality, even in the cART era: Results from the Treat Asia HIV observational database. J Int AIDS Soc 2012;15:1. [DOI] [PMC free article] [PubMed] [Google Scholar]
- 36.Sethi AK, Celentano DD, Gange SJ, Moore RD, Gallant JE: Association between adherence to antiretroviral therapy and human immunodeficiency virus drug resistance. Clin Infect Dis 2003;37:1112–1118 [DOI] [PubMed] [Google Scholar]
- 37.Bastard M, Pinoges L, Balkan S, Szumilin E, Ferreyra C, Pujades-Rodriguez M: Timeliness of clinic attendance is a good predictor of virological response and resistance to antiretroviral drugs in HIV-infected patients. PLoS One 2012;7:e49091. [DOI] [PMC free article] [PubMed] [Google Scholar]
- 38.Brennan AT, Maskew M, Sanne I, Fox MP: The importance of clinic attendance in the first six months on antiretroviral treatment: A retrospective analysis at a large public sector HIV clinic in South Africa. J Int AIDS Soc 2010;13:49. [DOI] [PMC free article] [PubMed] [Google Scholar]
Associated Data
This section collects any data citations, data availability statements, or supplementary materials included in this article.