

Abstract
Promoters initiate RNA synthesis, and enhancers stimulate promoter activity. Whether promoter and enhancer activities are encoded distinctly in DNA sequences is unknown. We measured the enhancer and promoter activities of thousands of DNA fragments transduced into mouse neurons. We focused on genomic loci bound by the neuronal activity-regulated coactivator CREBBP, and we measured enhancer and promoter activities both before and after neuronal activation. We find that the same sequences typically encode both enhancer and promoter activities. However, gene promoters generate more promoter activity than distal enhancers, despite generating similar enhancer activity. Surprisingly, the greater promoter activity of gene promoters is not due to conventional core promoter elements or splicing signals. Instead, we find that particular transcription factor binding motifs are intrinsically biased toward the generation of promoter activity, whereas others are not. Although the specific biases we observe may be dependent on experimental or cellular context, our results suggest that gene promoters are distinguished from distal enhancers by specific complements of transcriptional activators.
Regulation of metazoan gene transcription is accomplished through at least two distinct biochemical activities encoded in DNA. DNA sequences with promoter activity initiate transcription at self-contained transcription start sites (TSSs) (Lenhard et al. 2012). DNA sequences with enhancer activity activate transcription initiation at promoters (Grosschedl and Birnstiel 1980; Banerji et al. 1981). Promoter and enhancer activities were once assumed to be encoded at distinct locations in metazoan genomes (Blackwood and Kadonaga 1998; Levine and Tjian 2003). Consistent with this view, gene promoters and the mRNA TSS-distal (“distal”) enhancers that regulate them are distinguishable based on their stereotypical chromatin signatures. Distal enhancers are distinguished from gene promoters based on enrichment of histone H3 monomethylated on Lys4 (H3K4me1), reduced enrichment of H3K4me3, and the absence of TSSs for spliced, polyadenylated RNAs within ∼1 kb (Heintzman et al. 2007; Andersson et al. 2014). Gene promoters are distinguished from distal enhancers by the presence of mRNA TSSs and enrichment of H3K4me3 (Heintzman et al. 2007).
Although gene promoters and distal enhancers are generally distinguishable based on chromatin signatures, they do not differ categorically in their ability to encode enhancer or promoter activities. Distal enhancers encode promoter activity, initiating synthesis not of stable mRNAs but of enhancer RNAs (eRNAs) that are unstable, unspliced, and nonpolyadenylated (De Santa et al. 2010; Kim et al. 2010; Andersson et al. 2014). Conversely, gene and lncRNA promoter sequences also encode enhancer activity (Webster et al. 1988; Li et al. 2012; Zabidi et al. 2015; Paralkar et al. 2016); although, the frequency at which this occurs outside of Drosophila is unknown. These findings suggest that within metazoan genomes, sequences that encode enhancer and promoter activities may be overlapping or even identical (Weingarten-Gabbay and Segal 2014; Andersson et al. 2015; Kim and Shiekhattar 2015; Li et al. 2016). However, because the promoter and enhancer activities of only a few defined sequences have been directly compared (Moreau et al. 1981; Serfling et al. 1985; Treisman and Maniatis 1985; Bienz and Pelham 1986), the fundamental relationships between enhancer activity, promoter activity, and the sequences that encode them are unknown.
Results
High-throughput comparison of promoter and enhancer activities using Massively Parallel Reporter Assays (MPRAs)
To identify DNA sequences that might distinctly encode enhancer and promoter activities, we compared these two activities across a library of sequences derived from distal enhancers and gene promoters (Fig. 1A). We chose 253 distal enhancer and 234 gene promoter loci based on their chromatin state in mouse cortical neurons, a well-characterized experimental system that we previously used to uncover widespread transcription at enhancers (Kim et al. 2010). Our primary selection criteria were binding of the coactivator CREBBP (Kim et al. 2010) and an increase in histone H3 acetylated on Lys-27 (H3K27ac) upon neural activation (Malik et al. 2014). We also required each locus to have a human ortholog that is DNase accessible in fetal brain and contains one or more SNPs. The goal with these selection criteria was to identify a focused set of mouse genomic loci that are active in neurons, that can be compared to their human orthologs, and that are maximally relevant to human health. In mouse neurons, the distal enhancer loci express eRNAs and are enriched in H3K4me1 (but not H3K4me3), and the gene promoter loci are enriched in H3K4me3 (Supplemental Methods; Kim et al. 2010).
Figure 1.

Measuring thousands of promoter and enhancer activities in primary neurons using Massively Parallel Reporter Assays (MPRAs). (A) For each of 234 CREBBP-bound promoter and 253 CREBBP-bound distal enhancer loci, we synthesized 11 139-bp tiles whose start sites are spaced at 20-bp intervals. The center tile at each locus is centered on the called CREBBP peak. Plots show tile coverage as a count of quantifiable tiles versus position relative to the locus center. Distal enhancers are at least 500 bp from an annotated TSS. (B) After a series of cloning steps (Supplemental Figs. S1, S2), we tagged each tile with one or more unique 18-bp barcodes. In the enhancer test, the abundance of each barcode in a cellular mRNA pool depends on the enhancer activity of its associated tile. The library contains a mix of tiles from enhancer (black) and promoter (orange) loci. pFos is a 100-bp basal FOS promoter. (C) In the promoter test, the abundance of each barcode depends on the promoter activity of its tile. (D) We packaged MPRA libraries into AAV for infection of mouse cortical neurons and quantified cDNA and control DNA barcode abundance by sequencing. We typically sequenced control DNA amplified from the plasmid library rather than from cells, because we found MPRA read counts from plasmid DNA and DNA extracted from neurons to be indistinguishable (Supplemental Fig. S3C).
For each distal enhancer and promoter locus, we synthesized 11 overlapping 139-bp tiles spanning 340 bp (i.e., 20-bp offset and 119-bp overlap between neighboring tiles). To each tile we appended one or more unique sequence barcodes (Supplemental Figs. S1, S2A; Supplemental Methods) before insertion into enhancer activity–specific and promoter activity–specific MPRAs (Fig. 1B,C). We quantify promoter activity via high-throughput sequencing of barcodes situated in the 3′ UTR of a GFP cDNA, with each barcode identifying a particular genomic tile upstream of the GFP. We quantify enhancer activity via amplification of the entire genomic tile from the 3′ UTR of a GFP cDNA, which is situated downstream from a 100-bp basal human FOS promoter (pFos) (Fisch et al. 1987). The enhancer test is conceptually identical to STARR-seq, which is able to specifically detect enhancer but not promoter activity, because any RNA transcripts that initiate within genomic tiles are not amplified for quantification (Fig. 1B; Arnold et al. 2013).
For each experiment, we infected cortical neurons with MPRA libraries, harvested RNA, and quantified barcode expression using high-throughput sequencing (Figs. 1D, 2A,B,E,F; Supplemental Figs. S2B, S3A,B, S4). After normalization, MPRA activity values represent a fold increase over negative control sequences, which were included in every MPRA library (Methods). Because CREBBP function is regulated by neural activity, we measured enhancer and promoter activities both before and after neural activation via potassium chloride (KCl)-mediated depolarization. We found examples of tiles that were positively regulated, negatively regulated, and unregulated by neural activity (Supplemental Table S1). Because our primary goal was to enable comparison of promoter and enhancer activities regardless of the extent or polarity of neural activity regulation, we generally present for each sequence the condition with maximal activity (but also show each condition separately) (Supplemental Figs. S11–S14). We directly compared enhancer and promoter activities from MPRAs with enhancer and promoter activities from luciferase assays and found them to be strongly correlated (Pearson's R = 0.95, 0.99; P < 0.05) (Fig. 2C,D,G; Supplemental Fig. S11).
Figure 2.

Replicability of enhancer and promoter activities from MPRAs. (A) Replicability of read counts across two biological replicates of an enhancer activity MPRA. (B) Replicability of enhancer activity from A. MPRA activity is defined in this and all subsequent figures as the cDNA to DNA ratio, normalized to the corresponding ratio for negative control sequences, which are included in each MPRA library. (C) Schematic of luciferase assay design. Enhancer activity was assessed with test sequences upstream of a minimal FOS promoter. Promoter activity was tested as in Figure 1C with a luciferase coding sequence in place of GFP. (D) Comparison of MPRA-based and luciferase-based enhancer activity measurements, with each shape representing a specific test sequence. Test sequences are artificial, with repeats of RFX (square), AP1 (circle), MYBL2 (triangle), and NFYshort (diamond) motifs with spacers TTATTTTAAGA (RFX, MYBL2) and CCCGCGCTGCC (AP1, NFYshort). (E–G) Same as A,B,D but for promoter activity. (H) Correlation of MPRA-based promoter activity with CAGE tag counts. Pearson's R = 0.27, P < 10−16 from t-statistic. Throughout this work, except where noted, enhancer and promoter activities are reported as the maximal activity of the unstimulated and KCl-depolarized conditions. In A, B, E, and F, the unstimulated condition is shown.
Enhancer and promoter activities colocalize in the genome but are quantitatively decoupled
We evaluated whether enhancer- and promoter-specific MPRAs could detect the desired activities. After synthesis and cloning, we were able to assess enhancer and promoter activities for 1957 tiles (31%) in all samples. This total represents an average of 4.0 tiles per locus, with 924 distal enhancer-derived and 1033 promoter-derived tiles. As expected, promoter-derived sequences harbor promoter activity (19% of tiles, 37% of loci; FDR 0.1) (Supplemental Table S1), and distal enhancer-derived sequences harbor enhancer activity (13% of tiles, 22% of loci; FDR 0.1) (Supplemental Table S1). Because distal enhancers initiate synthesis of eRNAs, we also expected distal enhancer-derived sequences to harbor promoter activity, and they do (4% of tiles, 10% of loci; FDR 0.1) (Supplemental Table S1). The overall observation that only a subset of loci is transcriptionally active is unsurprising, given (1) previous high-throughput reporter results in which a similarly low fraction of sequences were active (20%–24% versus our 22%) (White et al. 2013); (2) the presence in our library of many “off-center” tiles that likely lack relevant regulatory elements (Supplemental Figs. S5, S6); and (3) a tile length that may in some cases be too short. We found reassuringly that the promoter activity of MPRA tiles correlates with the abundance of RNA transcripts that initiate within corresponding genomic sequences, as detected by CAGE tag frequencies in neurons (Rho = 0.29, P < 10−16) (Fig. 2H; Supplemental Fig. S5D–E; FANTOM Consortium and the RIKEN PMI and CLST [DGT] 2014). These results give us confidence that enhancer- and promoter-specific MPRAs provide relevant measurements of enhancer and promoter activities.
Our data provide a high-resolution survey of metazoan enhancer activity, enabling us to ask precisely where enhancer activities localize within the mouse genome. Interestingly, we find that mean enhancer activity is similar for promoter- and distal enhancer-derived tiles (Fig. 3A; Supplemental Figs. S7A,B, S14A,B). At promoters, enhancer activity is greatest for tiles that contain annotated mRNA TSSs (Fig. 3B; Supplemental Fig. S14C,E). Because gene promoters frequently interact with each other within genomic chromatin (Li et al. 2012), these results suggest that many gene promoters may also function to enhance transcription of other genes.
Figure 3.

Promoter and enhancer activities are positively correlated but quantitatively decoupled. (A) Mean promoter and enhancer activities across all promoter-derived and distal enhancer-derived tiles and the numbers of tiles with significant promoter or enhancer activities (FDR 0.1). (B) Mean promoter and enhancer activity as a function of the distance of the center of MPRA tiles to the nearest RefSeq TSS. Negative distances correspond to tile locations upstream of the TSS. (C) Mean promoter activity for tiles cloned into the MPRA promoter test in sense (566 tiles) versus antisense (467 tiles) orientations relative to their endogenous mRNA TSS. The genomic antisense TSS position depicts the approximate location of the endogenous antisense TSS, based on a median 180-bp distance between sense and antisense TSSs (Scruggs et al. 2015). (D) Enhancer activity versus promoter activity, with each dot corresponding to one tile. Each tile's activities are shown once for unstimulated and once for KCl-depolarized neurons. The area in which both activities fall above an empirical FDR of 0.1 is shown in gray. (E) The ratio of promoter-to-enhancer activities of tiles derived from promoter and distal enhancer loci (P-value from two-tailed Student's t-test). Error bars in A–C indicate SEM for n = 2 independent biological replications. Promoter and enhancer activities are defined as in Figure 2B.
Our data also provide a high-resolution genomic survey of promoter activity. We find that promoter activity is maximal for tiles centered ∼40 bp upstream of mRNA TSSs, the same position with maximal enhancer activity (Fig. 3B; Supplemental Figs. S7C, S14C,E). Maximal promoter activity therefore colocalizes with upstream activating regions (−500 to −40 bp) that bind transcriptional activators (Guarente 1984). It also colocalizes with traditional core promoter regions (−40 to +40) that contain elements such as the TATA box and the INR, which facilitate RNA polymerase II initiation (Kadonaga 2012). However, when we compared the promoter activities of tiles inserted into our MPRA reporters in sense versus antisense orientations relative to their endogenous mRNA TSSs, we found them to be indistinguishable (P > 0.05, KS test) (Fig. 3C; Supplemental Figs. S7D, S14D,F). This result is in contrast to the offset in sense and antisense activities that is predicted by a model in which sense and antisense initiation events require distinct core promoters separated by ∼180 bp (Duttke et al. 2015; Scruggs et al. 2015); it suggests instead that bidirectional initiation may occur at the flanks of activator-bound sequences with little requirement for specific core promoter elements.
Both positive and negative relationships between enhancer and promoter activities have been recently hypothesized (Kim et al. 2010; Li et al. 2012; Andersson et al. 2015), so we compared the enhancer and promoter activities of defined sequences. We observe a clear positive correlation between enhancer and promoter activity (Spearman's ρ = 0.45 and P < 10−16, asymptotic t approximation) (Fig. 3D; Supplemental Fig. S12G,H). Interestingly, however, promoter-derived tiles have greater promoter activity than distal enhancer-derived tiles, despite having similar enhancer activity (Fig. 3A,D; Supplemental Fig. S7A,B). Correspondingly, the median ratio of promoter-to-enhancer activity of promoter-derived tiles is 3.1-fold higher than of distal enhancer-derived tiles (P < 10−16, Wilcoxon rank-sum test) (Fig. 3E; Supplemental Fig. 14G,H). The lower promoter activity of distal enhancer-derived compared to promoter-derived sequences is unlikely due to a lack of directional annotation for distal enhancers because eRNAs are transcribed bidirectionally (Kim et al. 2010), and the promoter activity we observe for promoter-derived sequences is orientation-insensitive (Fig. 3C). Nor is the lower promoter activity of distal enhancer-derived sequences likely due to distal enhancers being longer and therefore less well captured by our short tiles because the distal enhancer loci have shorter DHS-accessible regions than the promoter loci (median 1252 versus 1755 bp, P < 10−7 by Student's t-test). We conclude that enhancer and promoter activities can be encoded distinctly. In particular, the strongest promoter activity has additional sequence and mechanistic requirements, beyond those required for enhancer activity.
The elevated promoter activity of promoter-derived tiles is not due to core promoter elements or 5′ splice signals
Having determined that promoter activity has specific sequence determinants beyond those required for enhancer activity, we focused our efforts on identifying these determinants. Of all promoter-derived sequences, we found that promoter activity-only tiles are more likely to be situated from 0 to +100 relative to mRNA TSSs than enhancer activity-only tiles (P < 0.003, χ2 test) (Supplemental Fig. S8), suggesting that canonical core promoter elements might contribute to promoter but not enhancer activity. However, we found that the sequences that contained the TATA box (TATAWAWR) or the INR (YYANWYY or YYRRWYY) have no higher promoter activity than those that lack them, whether computed across our entire experiment or for promoter activity-only versus enhancer activity-only tiles (P > 0.05, Student's t-tests) (Supplemental Fig. 6E,F). These results suggest that canonical core promoter elements are not responsible for the greater promoter activity of promoter-derived compared to enhancer-derived tiles.
We also considered 5′ splice signals (5pSSs), whose presence at promoters but not distal enhancers could account for the unique ability of promoters to (1) initiate transcription that elongates beyond several kilobases; and (2) produce a spliced and polyadenylated mRNA instead of an eRNA (Andersson et al. 2015; Kim and Shiekhattar 2015). However, if 5pSSs were responsible for the elevated promoter activity of promoter-derived sequences, we would expect equivalent promoter activity from both promoter- and distal enhancer-derived sequences, because all tiles in our promoter activity test are placed upstream of the same 5pSS-containing synthetic intron (Fig. 1B,C). Instead, as described above, we observe greater promoter activity from promoter-derived than from distal enhancer-derived tiles (Fig. 3A,D,E; Supplemental Fig. S7A). This elevated promoter activity is not due to the presence of additional 5pSSs in the promoter tiles themselves: Only 8% of promoter tiles overlap an annotated 5pSS (Supplemental Table S1), and 5pSS-containing tiles have no higher promoter activity than 5pSS-lacking tiles (P = 0.78, Student's t-test). We conclude that although a 5pSS may be required to prevent premature termination of pre-mRNAs (Kaida et al. 2010; Almada et al. 2013; Ntini et al. 2013), it is insufficient to endow distal enhancer-derived tiles with promoter activity that is equivalent to that of promoter-derived tiles.
Promoter activity more than enhancer activity is associated with elevated CpG content and CpG-containing TF motifs
Compared to the genome at large, promoters but not most distal enhancers have elevated frequencies of CpG dinucleotides (Heintzman et al. 2007; Deaton and Bird 2011; Andersson et al. 2014), whose presence at promoters also correlates with activity in reporter assays (Landolin et al. 2010). We therefore asked whether CpG dinucleotides might contribute to the encoding of promoter activity. We find that the number of CpG dinucleotides in a sequence correlates with both promoter activity and the ratio of promoter-to-enhancer activity, even after controlling for total G+C nucleotide content using partial correlation (partial R = 0.33 and R = 0.21; P < 10−20, Student's t-tests) (Fig. 4A; Supplemental Figs. S9A, S12C,D; Supplemental Table S3). Consistent with the idea that it is CpG dinucleotides rather than total G+C content that influence promoter activity, G+C content itself does not correlate positively with promoter activity, when controlling for CpG content. We then asked whether CpG dinucleotide content also correlates with promoter activity in human sequences. We performed MPRAs with sequences from the human genome that are orthologous to a subset of our CREBBP-bound loci in mouse. We found that as with mouse tiles, the strongest promoter activity and the highest ratios of promoter-to-enhancer activity are encoded by CpG-rich sequences (Fig. 4B,C; Supplemental Figs. S9B, S12E,F). These results suggest that CpG dinucleotides positively influence promoter more than enhancer activity.
Figure 4.

Promoter activity more than enhancer activity is associated with CpG content. (A) The enhancer and promoter activities of mouse genomic DNA tiles ranked by the CpG dinucleotide frequency in each tile. (B) We tiled human promoter and distal enhancer loci that are orthologous to selected mouse loci. (C) The enhancer and promoter activities of 725 human genomic tiles ranked by CpG frequency. (D) The enhancer and promoter activities of 764 reversed human genomic control tiles ranked by CpG frequency. (E) The 28 most-enriched TF motifs in tiles with a CpG fraction >0.087, compared to reversed controls. The highest-scoring matches in the JASPAR database were chosen as the TF motif names, and six additional motifs without clear TF matches are in Supplemental Table S2. The number of CpG dinucleotides in each motif is indicated in red. In A, C, and D, each value is a mean from n = 2 biological replicates. Promoter and enhancer activities are defined as in Figure 2B.
Elevated CpG content is sufficient to establish promoter-associated chromatin states (Blackledge et al. 2010; Wu et al. 2011; Clouaire et al. 2012; Fenouil et al. 2012; Wachter et al. 2014). We therefore asked whether CpG richness alone is also sufficient to encode promoter activity. For this purpose, we created a set of human promoter tiles whose sequences were reversed without complementation (i.e., TGACGTCA → ACTGCAGT). This manipulation preserves G+C content but destroys transcription factor (TF) binding motifs. It also destroys individual CpGs and GpCs via inter-conversion. However, average CpG content is actually increased because there are more GpCs than CpGs in our genomic sequences (0.08% GpCs versus 0.05% CpGs, consistent with CpG depletion in the genome). We find that sequence reversal categorically abolishes promoter activity (Fig. 4D; Supplemental Fig. S11E,F). In a complementary experiment, we also used MPRAs to ask whether artificial dinucleotide repeats in the absence of motifs could generate promoter activity. We compared 20 ApG, CpA, or CpG repeats on a fixed background (Supplemental Fig. S9C). None of the sequences generated significant promoter activity (P > 0.7, one-tailed Student's t-test). Thus, high CpG content per se is insufficient to encode promoter activity but may be required together with TF motifs.
To identify TF motifs that might function as specific determinants of promoter activity, we performed motif enrichment analyses. First, we identified 28 motifs enriched in the 149 tiles with >8.7% CpGs per dinucleotide (most of which produce promoter activity) (Supplemental Fig. S9D), relative to reversed control sequences (Bonferroni-adjusted P < 0.05, binomial test) (Fig. 4E; Supplemental Table S2). Enriched motifs include those for EGR and CREB, which are activity-regulated transcription factors with binding preferences for promoters (Knapska and Kaczmarek 2004; Greer and Greenberg 2008; Kim et al. 2010; Tang et al. 2010) and RFX, a developmental regulator (Baas et al. 2006). We also identified 20 motifs, including CREB and ETS, that are enriched in tiles with promoter activity compared to those without (Supplemental Fig. S10). Finally, we performed motif enrichment between promoter activity-only and enhancer activity-only tiles (Supplemental Fig. S8E). Enhancer activity-only tiles are enriched for AP1, a neuronal activity-regulated complex formed by a FOS/JUN heterodimer that binds neuronal activity-regulated enhancers (Malik et al. 2014). Promoter activity-only tiles are enriched for EGR1, SP1, and other GC/CpG-rich motifs. These results suggest the possibility that RFX, CREB, EGR, and other motifs could generate both enhancer and promoter activities, whereas AP1 may be biased toward the generation of enhancer activity.
Motifs differ in their intrinsic biases toward the generation of promoter versus enhancer activities
To investigate the ability of individual motifs to encode promoter and enhancer activities, we used MPRAs to compare the promoter and enhancer activities of purely artificial sequences. For 32 of the most enriched motifs at CREBBP-bound genomic loci, we synthesized a sequence with tandem repeats of the motif. For each motif, we used MPRAs to measure its promoter and enhancer activities (Fig. 5A; Supplemental Fig. S13A,B; Supplemental Table S4). Several motifs produce no enhancer or promoter activity at all, consistent with a previous observation that only a subset of TFs can generate transcriptional activity on their own (Smith et al. 2013). Motifs for EGR, CREB, and RFX families of TFs stand out as having the highest promoter activity, and they also generate enhancer activity. In contrast, motifs for the AP1 complex and NFY produced significant enhancer activity with little to no promoter activity. The ability of TF motifs to generate promoter activity is not simply a function of CpG content, because RFX motifs with and without CpGs both generate promoter activity. Nor is the generation of promoter activity by these artificial sequences due to the presence of canonical core promoter elements, because neither of the two most salient core promoter motifs, the TATA box nor the INR (Frith et al. 2008), are present in any of the sequences. These results are consistent with the idea that only a subset of enhancer activity-generating motifs are also able to generate promoter activity.
Figure 5.

Motifs differ in their intrinsic biases toward the generation of promoter versus enhancer activities. (A, top) Sequence design for tandem repeats of 32 motifs, each totaling 87 bp in length; (bottom) enhancer and promoter activities of motif tandem repeats. (B, top) Sequence design for spaced motif repeats, with 18 motifs and three spacer sequences, each totaling 87 bp in length; (bottom) enhancer and promoter activities of spaced motif sequences. The log2 of enhancer activity is shown. Stars indicate at least twofold activity with significance in a one-sided Student's t-test (P < 0.05). Error bars are SEM of n = 3 biological replicates. Promoter and enhancer activities are defined as in Figure 2B.
We sought to reevaluate, using independent sequence contexts, our finding that promoter activity is encoded by a subset of the TF motifs that generate enhancer activity. This time we repeated each motif with three different spacers taken from inactive sequences (“spaced configuration”) (Fig. 5B; Supplemental Fig. 13C,D). We find that whereas many (15/18) of the spaced motifs produce enhancer activity, only two (RFX and ELK) produce significant promoter activity, and both of these motifs also produce promoter activity in the tandem repeat configuration (Fig. 5A). In contrast, AP1 generates enhancer but only minimal promoter activity in both spaced and tandem configurations. For RFX and AP1 motifs, we tested and confirmed these MPRA results using luciferase reporter assays (Supplemental Fig. S11). We conclude that some TF motifs (e.g., AP1) have a bias toward the generation of only enhancer activity, whereas others (e.g., RFX) generate both activities.
We asked whether neuronal depolarization could differentially affect enhancer versus promoter activity. To our surprise, across many artificial and genomic sequences, mean promoter activity decreases, while mean enhancer activity increases with depolarization. In genomic sequences, these changes are driven by a decrease in the promoter activities of promoter-derived loci and an increase in the enhancer activities of distal enhancer-derived loci (Supplemental Fig. S12A,B). However, in artificial sequences, some individual motifs (e.g., EGR_long, FOXN1) exhibit simultaneous increases in enhancer activity and decreases in promoter activity with depolarization. In addition, a PAX motif exhibits constitutive promoter activity but highly inducible enhancer activity (Supplemental Fig. S13). These results indicate that the relative extent of enhancer versus promoter activity generated by a DNA sequence can be regulated dynamically.
Motifs that generate promoter activity in MPRAs are present both at gene promoters and distal enhancers
We asked whether the TF motifs with intrinsic biases toward the generation of enhancer or promoter activities are correspondingly enriched at distal enhancers or gene promoters in the genome. Among the top 10 most-enriched motifs at promoters or distal enhancers were those for CREB, AP1, and RFX (Fig. 6A; Supplemental Table S5), each of which is also transcriptionally active in MPRAs. CREB motifs are similarly enriched at distal enhancers and promoters, and RFX and AP1 motifs are biased toward distal enhancers. For these three factors, we therefore also examined TF binding at promoters and distal enhancers in neurons. To assess RFX binding, we performed ChIP-seq using a MYC-tagged RFX dominant negative (RFX-DN) protein (Fig. 6B; Maijgren et al. 2004; Bae et al. 2014). To assess CREB and AP1 binding in neurons, we analyzed previously published ChIP-seq data (Fig. 6B; Kim et al. 2010; Malik et al. 2014). We found CREB to be bound preferentially at gene promoters and AP1 preferentially at distal enhancers. These preferences are consistent with the idea that promoters in the genome are distinguished from distal enhancers in part by the presence of specific complements of bound TFs because CREB motifs generate more promoter activity than AP1 in MPRAs (Fig. 5A). Interestingly, however, RFX motifs are preferentially enriched at enhancers, despite the potency of RFX in generating promoter activity, suggesting that RFX may be required for the promoter activity of distal enhancers.
Figure 6.

Motifs and their corresponding transcription factors exhibit specific preferences for promoters or distal enhancers in the genome. (A) Motifs with at least twofold enrichment at mouse gene promoters or distal CREBBP-bound enhancers, relative to corresponding flanking sequences. Motifs corresponding to CREB, RFX, and AP1 are labeled for the 10 most enriched motifs at gene promoters or distal enhancers. For colored motifs, enrichment at both classes of loci is significant (P < 10−5, Bonferroni-corrected binomial test). (B) Percentages of cortical neuron CREB, RFX, and AP1 ChIP-seq peaks located at gene promoters (top) and distal enhancers (bottom). Antibodies used were anti-CREB, anti-FOS (AP1), and anti-MYC (with MYC-tagged RFX dominant negative): (*) P < 10−14 by a hypergeometric test.
RFX is required for promoter activity of distal enhancer-derived tiles
We investigated whether the presence of RFX motifs contributes to the ability of some distal enhancer tiles to generate more promoter activity than others. We found that distal enhancer-derived tiles that have RFX motifs exhibit greater promoter activity than those that lack them (P < 0.05, Student's t-test) (Fig. 7A). Moreover, distal enhancer tiles with RFX motifs express higher levels of eRNAs than those without RFX motifs (83% higher median RNA-seq counts, P < 10−14 by Student's t-test). We therefore synthesized a MPRA library containing distal enhancer sequences with mutated RFX motifs. We found that manipulations that reduced resemblance to the idealized RFX motif reduced promoter activity (Fig. 7B,C; Supplemental Figs. S5F, S14I,J). In addition, “perfected” RFX motifs functioned better as promoters than the unaltered endogenous sequences. The effects of these mutations were negated in the presence of RFX-DN (Fig. 7D; Supplemental Figs. S5F, S14K,L), suggesting that they alter promoter activity by interfering with the binding of RFX family members. These results suggest that RFX functions to increase the promoter activity of distal enhancer sequences.
Figure 7.
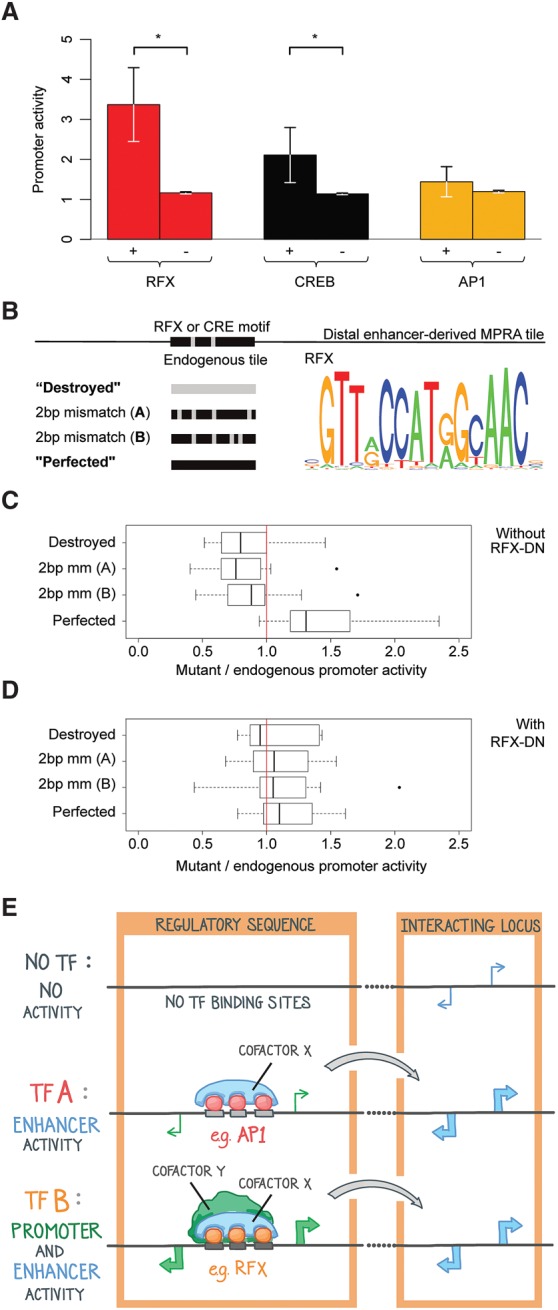
The promoter activity of distal enhancers requires RFX motifs. (A) Mean promoter activity of distal enhancer tiles that have zero (“−”) or at least two (“+”) occurrences of RFX, CREB, and AP1 motifs: (*) P < 0.05 by Student's t-test. Promoter activity is defined and normalized as in Figure 2B, and each tile's mean promoter activity from two biological replicates is averaged across all “+” and “−” tiles. The apparent lack of error bars in “−” tiles is due to the mean and SEM being computed across a large number of tiles, because most tiles lack these motifs. (B) Mutations of RFX motif occurrences within distal enhancer sequences. Each motif occurrence was altered in four different ways. A gray portion indicates a nucleotide that does not match the corresponding motif represented at right. Motifs are from HT SELEX position frequency matrices for RFX5 (Jolma et al. 2013). (C) Ratios of mutant to control promoter activity using MPRAs, with median and 25th–75th percentiles shown as bars and boxes. A ratio of one (no change in promoter activity) is indicated with a vertical red line. Promoter activity is defined as in Figure 2B. The 20 control tiles include 11 distal enhancer tiles, shown separately in Supplemental Figure S5F. (D) Same as C but for RFX dominant negative-transduced neurons. (E) Model: Transcriptional activators and coactivators determine the relative extent of enhancer and promoter activities.
Discussion
We describe here a high-throughput comparison of the promoter and enhancer activities of short, defined genomic sequence fragments. Sequences that co-encode both promoter and enhancer activities are the rule rather than the exception, suggesting that enhancer activity shares with promoter activity a common underlying mechanism. One possibility is that enhancer function requires eRNA synthesis (Ørom et al. 2010; Kaikkonen et al. 2013; Li et al. 2013; Mousavi et al. 2013; Hsieh et al. 2014; Schaukowitch et al. 2014). Consistent with this idea, eRNA synthesis at distal enhancers is correlated with transcription of nearby genes (De Santa et al. 2010; Kim et al. 2010; Rada-Iglesias et al. 2010; Arner et al. 2015). However, we observe that defined sequences do not produce enhancer and promoter activities at a fixed ratio. This decoupling of enhancer and promoter activity suggests that enhancers can activate promoters without initiating transcription.
Our work builds on recent findings that distal enhancers and gene promoters have remarkably similar genomic architectures, each with divergent transcription from nucleosome-depleted cores (Core et al. 2014; Duttke et al. 2015; Scruggs et al. 2015). At gene promoters, the presence of a 5′ splicing signal protects against premature termination (Kaida et al. 2010; Almada et al. 2013; Ntini et al. 2013). Its presence may be the sole reason that pre-mRNA transcription, but not upstream antisense promoter transcription or eRNA transcription, extends beyond a few kilobases from TSSs (Andersson et al. 2015; Kim and Shiekhattar 2015). Consistent with the idea that this promoter directionality is conferred by a splicing signal, the promoter activity we measure here in the absence of endogenous splicing signals is intrinsically bidirectional. However, our results also make clear that independently of splicing signals, gene promoters generate more promoter activity than distal enhancers.
Our results suggest that promoter activity requires little in the way of nucleotide structure because it can be generated by endogenous and artificial sequences that lack canonical core promoter elements. This flexibility contrasts with the demonstrated requirement for core promoter elements at some promoters (Smale and Kadonaga 2003; Mogno et al. 2010; Kadonaga 2012; Lubliner et al. 2015). Our results suggest instead that promoter activity at CREBBP-bound loci is best understood as a function of the specific complement of transcriptional activators that are bound (Fig. 7E), although we note that alternative mechanisms might predominate at non-CREBBP-bound loci or in other cell types. The greater promoter activity generated by some TFs (e.g., RFX) compared to others (e.g., AP1) may depend on recruitment of distinct coactivator or preinitiation complexes that are predisposed toward the generation of promoter activity. This idea fits also with the observation that TFs form complementation groups within which they may substitute for each other in the generation of transcriptional activity (Stampfel et al. 2015). The comparison of complexes recruited by RFX and AP1 could identify a generalized mechanism that distinguishes promoter from enhancer activity.
Our conclusions pertain to a specific experimental context—CREBBP-bound sequences in cortical neurons—outside of which they may differ. Generally, transcription regulation is context dependent. The same regulatory sequences likely function differently in other cell types (Heintzman et al. 2009) or with a different minimal promoter (Zabidi et al. 2015). The enhancer and promoter activities that we observe may be influenced by cryptic enhancers present in our specific MPRA plasmids, by the short tile lengths, or by the viral transduction used to introduce libraries into cells. We speculate that the ability of a specific transcriptional activator or coactivator to drive promoter activity may be context dependent, as is the ability to encode transcriptional activation generally (Smith et al. 2013).
Methods
Genomic tiles synthesized (TN03 library)
We analyzed tiles from 487 mouse genomic loci. For each distal enhancer or promoter locus, we synthesized 11 tiles centered on the called CREBBP peak, whose center was defined as the midpoint of the peak (Kim et al. 2010). For the mouse sequences, we inserted all tiles whose nearest annotated TSS is on the positive strand into our reporter assay in the “sense” orientation. We inserted all mouse tiles whose nearest annotated TSS is on the negative strand into our reporter assay in the “antisense” orientation. We also analyzed tiles from 217 human genomic loci whose nearest RefSeq TSS is transcribed on the positive genomic strand, each inserted into reporter plasmids in the sense orientation. Our nonsense controls were 498 sequences derived from human genomic loci whose sequences were reversed without complementation. Design and analysis was performed using custom scripts in R (Supplemental Methods) (R Core Team 2014).
Processing of MPRA libraries
Genomic (TN03 library), mutated genomic (TN05 library), and artificial (TN04 library) sequences were synthesized by CustomArray, Inc., and amplified by emulsion PCR (Supplemental Methods). Each oligo library was designed to contain 12,472 oligonucleotides. For TN04, sequence barcodes were added during synthesis, with 9–11 distinct barcodes per test sequence (Melnikov et al. 2012). For TN03 and TN05, random 18-bp barcodes were added during amplification (Supplemental Fig. S1). Amplified sequences were then cloned into vector pTAN01 using SfiI sites. DNA was prepared from ∼200,000 colonies for TN03 and TN05, in a deliberate bottleneck designed to limit the number of total barcodes in the plasmid library. For TN04, 5 × 10⁶ to 10 × 106 colonies were prepared. For the promoter test, a synthetic intron-GFP-KAN ORF containing fragment was cloned into the isolated libraries (Supplemental Fig S1). For the enhancer test, barcoded sequences from pTAN01 were excised and cloned into pTAN08 using SfiI sites (Supplemental Fig. S1). After each of these ligations, DNA was prepared from 5 × 10⁶ to 10 × 106 colonies for TN03, TN04, and TN05 to maintain library complexity. Our AAV MPRA strategy is similar to a recently published one (Supplemental Methods; Supplemental Fig. S2B; Shen et al. 2015).
Data access
The sequencing data from this study are described in Supplemental Table S6 and have been submitted to the NCBI Gene Expression Omnibus (GEO; http://www.ncbi.nlm.nih.gov/geo/) under accession number GSE77213.
Acknowledgments
We thank Tarjei Mikkelsen, Alex Melnikov, and Connie Cepko for sharing reagents and offering advice; Sarah Boswell, Mike Springer, Nicholas DeStefino, Kelsey Tyssowski, Jen Harrow, Michal Kosicki, Ilias Georgakopolous-Soares, Daniel Gaffney, Leopold Parts, and Tae-Kyung Kim for helpful discussions and critical reading of the manuscript; Manolis Kellis for support and advice; Daniel Wiegand and Brian Turczyk for assistance with oligonucleotide synthesis; and Clarissa Scholes for making the model in Figure 7. This work was funded by the National Institutes of Health, National Institute of Mental Health (R01 MH101528-01).
Author contributions: Conceptualization: J.M.G. and M.H.; methodology: T.A.N., A.R.S., A.R.P., and M.H.; investigation: T.A.N., A.R.S., R.D.J., M.H., and J.M.G.; writing (original draft): J.M.G.; review and editing: R.D.J. and J.M.G.; funding acquisition: J.M.G. and M.H.; resources: R.K.; supervision: J.M.G.
Footnotes
[Supplemental material is available for this article.]
Article published online before print. Article, supplemental material, and publication date are at http://www.genome.org/cgi/doi/10.1101/gr.204834.116.
References
- Almada AE, Wu X, Kriz AJ, Burge CB, Sharp PA. 2013. Promoter directionality is controlled by U1 snRNP and polyadenylation signals. Nature 499: 360–363. [DOI] [PMC free article] [PubMed] [Google Scholar]
- Andersson R, Gebhard C, Miguel-Escalada I, Hoof I, Bornholdt J, Boyd M, Chen Y, Zhao X, Schmidl C, Suzuki T, et al. 2014. An atlas of active enhancers across human cell types and tissues. Nature 507: 455–461. [DOI] [PMC free article] [PubMed] [Google Scholar]
- Andersson R, Sandelin A, Danko CG. 2015. A unified architecture of transcriptional regulatory elements. Trends Genet 31: 426–433. [DOI] [PubMed] [Google Scholar]
- Arner E, Daub CO, Vitting-Seerup K, Andersson R, Lilje B, Drabløs F, Lennartsson A, Rönnerblad M, Hrydziuszko O, Vitezic M, et al. 2015. Transcribed enhancers lead waves of coordinated transcription in transitioning mammalian cells. Science 347: 1010–1014. [DOI] [PMC free article] [PubMed] [Google Scholar]
- Arnold CD, Gerlach D, Stelzer C, Boryń ŁM, Rath M, Stark A. 2013. Genome-wide quantitative enhancer activity maps identified by STARR-seq. Science 339: 1074–1077. [DOI] [PubMed] [Google Scholar]
- Baas D, Meiniel A, Benadiba C, Bonnafe E, Meiniel O, Reith W, Durand B. 2006. A deficiency in RFX3 causes hydrocephalus associated with abnormal differentiation of ependymal cells. Eur J Neurosci 24: 1020–1030. [DOI] [PubMed] [Google Scholar]
- Bae BI, Tietjen I, Atabay KD, Evrony GD, Johnson MB, Asare E, Wang PP, Murayama AY, Im K, Lisgo SN, et al. 2014. Evolutionarily dynamic alternative splicing of GPR56 regulates regional cerebral cortical patterning. Science 343: 764–768. [DOI] [PMC free article] [PubMed] [Google Scholar]
- Banerji J, Rusconi S, Schaffner W. 1981. Expression of a β-globin gene is enhanced by remote SV40 DNA sequences. Cell 27: 299–308. [DOI] [PubMed] [Google Scholar]
- Bienz M, Pelham HR. 1986. Heat shock regulatory elements function as an inducible enhancer in the Xenopus hsp70 gene and when linked to a heterologous promoter. Cell 45: 753–760. [DOI] [PubMed] [Google Scholar]
- Blackledge NP, Zhou JC, Tolstorukov MY, Farcas AM, Park PJ, Klose RJ. 2010. CpG islands recruit a histone H3 lysine 36 demethylase. Mol Cell 38: 179–190. [DOI] [PMC free article] [PubMed] [Google Scholar]
- Blackwood EM, Kadonaga JT. 1998. Going the distance: a current view of enhancer action. Science 281: 60–63. [DOI] [PubMed] [Google Scholar]
- Clouaire T, Webb S, Skene P, Illingworth R, Kerr A, Andrews R, Lee JH, Skalnik D, Bird A. 2012. Cfp1 integrates both CpG content and gene activity for accurate H3K4me3 deposition in embryonic stem cells. Genes Dev 26: 1714–1728. [DOI] [PMC free article] [PubMed] [Google Scholar]
- Core LJ, Martins AL, Danko CG, Waters CT, Siepel A, Lis JT. 2014. Analysis of nascent RNA identifies a unified architecture of initiation regions at mammalian promoters and enhancers. Nat Genet 46: 1311–1320. [DOI] [PMC free article] [PubMed] [Google Scholar]
- De Santa F, Barozzi I, Mietton F, Ghisletti S, Polletti S, Tusi BK, Muller H, Ragoussis J, Wei CL, Natoli G. 2010. A large fraction of extragenic RNA Pol II transcription sites overlap enhancers. PLoS Biol 8: e1000384. [DOI] [PMC free article] [PubMed] [Google Scholar]
- Deaton AM, Bird A. 2011. CpG islands and the regulation of transcription. Genes Dev 25: 1010–1022. [DOI] [PMC free article] [PubMed] [Google Scholar]
- Duttke SHC, Lacadie SA, Ibrahim MM, Glass CK, Corcoran DL, Benner C, Heinz S, Kadonaga JT, Ohler U. 2015. Human promoters are intrinsically directional. Mol Cell 57: 674–684. [DOI] [PMC free article] [PubMed] [Google Scholar]
- FANTOM Consortium and the RIKEN PMI and CLST (DGT). 2014. A promoter-level mammalian expression atlas. Nature 507: 462–470. [DOI] [PMC free article] [PubMed] [Google Scholar]
- Fenouil R, Cauchy P, Koch F, Descostes N, Cabeza JZ, Innocenti C, Ferrier P, Spicuglia S, Gut M, Gut I, et al. 2012. CpG islands and GC content dictate nucleosome depletion in a transcription-independent manner at mammalian promoters. Genome Res 22: 2399–2408. [DOI] [PMC free article] [PubMed] [Google Scholar]
- Fisch TM, Prywes R, Roeder RG. 1987. c-fos sequence necessary for basal expression and induction by epidermal growth factor, 12-O-tetradecanoyl phorbol-13-acetate and the calcium ionophore. Mol Cell Biol 7: 3490–3502. [DOI] [PMC free article] [PubMed] [Google Scholar]
- Frith MC, Valen E, Krogh A, Hayashizaki Y, Carninci P, Sandelin A. 2008. A code for transcription initiation in mammalian genomes. Genome Res 18: 1–12. [DOI] [PMC free article] [PubMed] [Google Scholar]
- Greer PL, Greenberg ME. 2008. From synapse to nucleus: calcium-dependent gene transcription in the control of synapse development and function. Neuron 59: 846–860. [DOI] [PubMed] [Google Scholar]
- Grosschedl R, Birnstiel ML. 1980. Spacer DNA sequences upstream of the T-A-T-A-A-A-T-A sequence are essential for promotion of H2A histone gene transcription in vivo. Proc Natl Acad Sci 77: 7102–7106. [DOI] [PMC free article] [PubMed] [Google Scholar]
- Guarente L. 1984. Yeast promoters: positive and negative elements. Cell 36: 799–800. [DOI] [PubMed] [Google Scholar]
- Heintzman ND, Stuart RK, Hon G, Fu Y, Ching CW, Hawkins RD, Barrera LO, Van Calcar S, Qu C, Ching KA, et al. 2007. Distinct and predictive chromatin signatures of transcriptional promoters and enhancers in the human genome. Nat Genet 39: 311–318. [DOI] [PubMed] [Google Scholar]
- Heintzman ND, Hon GC, Hawkins RD, Kheradpour P, Stark A, Harp LF, Ye Z, Lee LK, Stuart RK, Ching CW, et al. 2009. Histone modifications at human enhancers reflect global cell-type-specific gene expression. Nature 459: 108–112. [DOI] [PMC free article] [PubMed] [Google Scholar]
- Hsieh CL, Fei T, Chen Y, Li T, Gao Y, Wang X, Sun T, Sweeney CJ, Lee GS, Chen S, et al. 2014. Enhancer RNAs participate in androgen receptor-driven looping that selectively enhances gene activation. Proc Natl Acad Sci 111: 7319–7324. [DOI] [PMC free article] [PubMed] [Google Scholar]
- Jolma A, Yan J, Whitington T, Toivonen J, Nitta KR, Rastas P, Morgunova E, Enge M, Taipale M, Wei G, et al. 2013. DNA-binding specificities of human transcription factors. Cell 152: 327–339. [DOI] [PubMed] [Google Scholar]
- Kadonaga JT. 2012. Perspectives on the RNA polymerase II core promoter. Wiley Interdiscip Rev Dev Biol 1: 40–51. [DOI] [PMC free article] [PubMed] [Google Scholar]
- Kaida D, Berg MG, Younis I, Kasim M, Singh LN, Wan L, Dreyfuss G. 2010. U1 snRNP protects pre-mRNAs from premature cleavage and polyadenylation. Nature 468: 664–668. [DOI] [PMC free article] [PubMed] [Google Scholar]
- Kaikkonen MU, Spann NJ, Heinz S, Romanoski CE, Allison KA, Stender JD, Chun HB, Tough DF, Prinjha RK, Benner C, et al. 2013. Remodeling of the enhancer landscape during macrophage activation is coupled to enhancer transcription. Mol Cell 51: 310–325. [DOI] [PMC free article] [PubMed] [Google Scholar]
- Kim TK, Shiekhattar R. 2015. Architectural and functional commonalities between enhancers and promoters. Cell 162: 948–959. [DOI] [PMC free article] [PubMed] [Google Scholar]
- Kim TK, Hemberg M, Gray JM, Costa AM, Bear DM, Wu J, Harmin DA, Laptewicz M, Barbara-Haley K, Kuersten S, et al. 2010. Widespread transcription at neuronal activity-regulated enhancers. Nature 465: 182–187. [DOI] [PMC free article] [PubMed] [Google Scholar]
- Knapska E, Kaczmarek L. 2004. A gene for neuronal plasticity in the mammalian brain: Zif268/Egr-1/NGFI-A/Krox-24/TIS8/ZENK? Prog Neurobiol 74: 183–211. [DOI] [PubMed] [Google Scholar]
- Landolin JM, Johnson DS, Trinklein ND, Aldred SF, Medina C, Shulha H, Weng Z, Myers RM. 2010. Sequence features that drive human promoter function and tissue specificity. Genome Res 20: 890–898. [DOI] [PMC free article] [PubMed] [Google Scholar]
- Lenhard B, Sandelin A, Carninci P. 2012. Metazoan promoters: emerging characteristics and insights into transcriptional regulation. Nat Rev Genet 13: 233–245. [DOI] [PubMed] [Google Scholar]
- Levine M, Tjian R. 2003. Transcription regulation and animal diversity. Nature 424: 147–151. [DOI] [PubMed] [Google Scholar]
- Li G, Ruan X, Auerbach RK, Sandhu KS, Zheng M, Wang P, Poh HM, Goh Y, Lim J, Zhang J, et al. 2012. Extensive promoter-centered chromatin interactions provide a topological basis for transcription regulation. Cell 148: 84–98. [DOI] [PMC free article] [PubMed] [Google Scholar]
- Li W, Notani D, Ma Q, Tanasa B, Nunez E, Chen AY, Merkurjev D, Zhang J, Ohgi K, Song X, et al. 2013. Functional roles of enhancer RNAs for oestrogen-dependent transcriptional activation. Nature 498: 516–520. [DOI] [PMC free article] [PubMed] [Google Scholar]
- Li W, Notani D, Rosenfeld MG. 2016. Enhancers as non-coding RNA transcription units: recent insights and future perspectives. Nat Rev Genet 17: 207–223. [DOI] [PubMed] [Google Scholar]
- Lubliner S, Regev I, Lotan-Pompan M, Edelheit S, Weinberger A, Segal E. 2015. Core promoter sequence in yeast is a major determinant of expression level. Genome Res 25: 1008–1017. [DOI] [PMC free article] [PubMed] [Google Scholar]
- Maijgren S, Sur I, Nilsson M, Toftgård R. 2004. Involvement of RFX proteins in transcriptional activation from a Ras-responsive enhancer element. Arch Dermatol Res 295: 482–489. [DOI] [PubMed] [Google Scholar]
- Malik AN, Vierbuchen T, Hemberg M, Rubin AA, Ling E, Couch CH, Stroud H, Spiegel I, Farh KK, Harmin DA, et al. 2014. Genome-wide identification and characterization of functional neuronal activity–dependent enhancers. Nat Neurosci 17: 1330–1339. [DOI] [PMC free article] [PubMed] [Google Scholar]
- Melnikov A, Murugan A, Zhang X, Tesileanu T, Wang L, Rogov P, Feizi S, Gnirke A, Callan CG, Kinney JB, et al. 2012. Systematic dissection and optimization of inducible enhancers in human cells using a massively parallel reporter assay. Nat Biotech 30: 271–277. [DOI] [PMC free article] [PubMed] [Google Scholar]
- Mogno I, Vallania F, Mitra RD, Cohen BA. 2010. TATA is a modular component of synthetic promoters. Genome Res 20: 1391–1397. [DOI] [PMC free article] [PubMed] [Google Scholar]
- Moreau P, Hen R, Wasylyk B, Everett R, Gaub MP, Chambon P. 1981. The SV40 72 base repair repeat has a striking effect on gene expression both in SV40 and other chimeric recombinants. Nucleic Acids Res 9: 6047–6068. [DOI] [PMC free article] [PubMed] [Google Scholar]
- Mousavi K, Zare H, Dell'Orso S, Grontved L, Gutierrez-Cruz G, Derfoul A, Hager GL, Sartorelli V. 2013. eRNAs promote transcription by establishing chromatin accessibility at defined genomic loci. Mol Cell 51: 606–617. [DOI] [PMC free article] [PubMed] [Google Scholar]
- Ntini E, Järvelin AI, Bornholdt J, Chen Y, Boyd M, Jørgensen M, Andersson R, Hoof I, Schein A, Andersen PR, et al. 2013. Polyadenylation site–induced decay of upstream transcripts enforces promoter directionality. Nat Struct Mol Biol 20: 923–928. [DOI] [PubMed] [Google Scholar]
- Ørom UA, Derrien T, Beringer M, Gumireddy K, Gardini A, Bussotti G, Lai F, Zytnicki M, Notredame C, Huang Q, et al. 2010. Long noncoding RNAs with enhancer-like function in human cells. Cell 143: 46–58. [DOI] [PMC free article] [PubMed] [Google Scholar]
- Paralkar VR, Taborda CC, Huang P, Yao Y, Kossenkov AV, Prasad R, Luan J, Davies JO, Hughes JR, Hardison RC, et al. 2016. Unlinking an lncRNA from its associated cis element. Mol Cell 62: 104–110. [DOI] [PMC free article] [PubMed] [Google Scholar]
- R Core Team. 2014. R: a language and environment for statistical computing. R Foundation for Statistical Computing, Vienna, Austria: http://www.R-project.org/. [Google Scholar]
- Rada-Iglesias A, Bajpai R, Swigut T, Brugmann SA, Flynn RA, Wysocka J. 2010. A unique chromatin signature uncovers early developmental enhancers in humans. Nature 470: 279–283. [DOI] [PMC free article] [PubMed] [Google Scholar]
- Schaukowitch K, Joo JY, Liu X, Watts JK, Martinez C, Kim TK. 2014. Enhancer RNA facilitates NELF release from immediate early genes. Mol Cell 56: 29–42. [DOI] [PMC free article] [PubMed] [Google Scholar]
- Scruggs BS, Gilchrist DA, Nechaev S, Muse GW, Burkholder A, Fargo DC, Adelman K. 2015. Bidirectional transcription arises from two distinct hubs of transcription factor binding and active chromatin. Mol Cell 58: 1101–1112. [DOI] [PMC free article] [PubMed] [Google Scholar]
- Serfling E, Lübbe A, Dorsch-Häsler K, Schaffner W. 1985. Metal-dependent SV40 viruses containing inducible enhancers from the upstream region of metallothionein genes. EMBO J 4: 3851–3859. [DOI] [PMC free article] [PubMed] [Google Scholar]
- Shen SQ, Myers CA, Hughes AE, Byrne LC, Flannery JG, Corbo JC. 2015. Massively parallel cis-regulatory analysis in the mammalian central nervous system. Genome Res 26: 238–255. [DOI] [PMC free article] [PubMed] [Google Scholar]
- Smale ST, Kadonaga JT. 2003. The RNA polymerase II core promoter. Annu Rev Biochem 72: 449–479. [DOI] [PubMed] [Google Scholar]
- Smith RP, Taher L, Patwardhan RP, Kim MJ, Inoue F, Shendure J, Ovcharenko I, Ahituv N. 2013. Massively parallel decoding of mammalian regulatory sequences supports a flexible organizational model. Nat Genet 45: 1021–1028. [DOI] [PMC free article] [PubMed] [Google Scholar]
- Stampfel G, Kazmar T, Frank O, Wienerroither S, Reiter F, Stark A. 2015. Transcriptional regulators form diverse groups with context-dependent regulatory functions. Nature 528: 147–151. [DOI] [PubMed] [Google Scholar]
- Tang C, Shi X, Wang W, Zhou D, Tu J, Xie X, Ge Q, Xiao PF, Sun X, Lu Z. 2010. Global analysis of in vivo EGR1-binding sites in erythroleukemia cell using chromatin immunoprecipitation and massively parallel sequencing. Electrophoresis 31: 2936–2943. [DOI] [PubMed] [Google Scholar]
- Treisman R, Maniatis T. 1985. Simian virus 40 enhancer increases number of RNA polymerase II molecules on linked DNA. Nature 315: 73–75. [DOI] [PubMed] [Google Scholar]
- Wachter E, Quante T, Merusi C, Arczewska A, Stewart F, Webb S, Bird A. 2014. Synthetic CpG islands reveal DNA sequence determinants of chromatin structure. eLife 3: e03397. [DOI] [PMC free article] [PubMed] [Google Scholar]
- Webster N, Jin JR, Green S, Hollis M, Chambon P. 1988. The yeast UASG is a transcriptional enhancer in human HeLa cells in the presence of the GAL4 trans-activator. Cell 52: 169–178. [DOI] [PubMed] [Google Scholar]
- Weingarten-Gabbay S, Segal E. 2014. A shared architecture for promoters and enhancers. Nat Genet 46: 1253–1254. [DOI] [PubMed] [Google Scholar]
- White MA, Myers CA, Corbo JC, Cohen BA. 2013. Massively parallel in vivo enhancer assay reveals that highly local features determine the cis-regulatory function of ChIP-seq peaks. Proc Natl Acad Sci 110: 11952–11957. [DOI] [PMC free article] [PubMed] [Google Scholar]
- Wu H, D'Alessio AC, Ito S, Xia K, Wang Z, Cui K, Zhao K, Sun YE, Zhang Y. 2011. Dual functions of Tet1 in transcriptional regulation in mouse embryonic stem cells. Nature 473: 389–393. [DOI] [PMC free article] [PubMed] [Google Scholar]
- Zabidi MA, Arnold CD, Schernhuber K, Pagani M, Rath M, Frank O, Stark A. 2015. Enhancer–core-promoter specificity separates developmental and housekeeping gene regulation. Nature 518: 556–559. [DOI] [PMC free article] [PubMed] [Google Scholar]