

Abstract
Eukaryotic genomes are organized into chromatin domains with three-dimensional arrangements that presumably result from interactions between the chromatin constituents—proteins, DNA, and RNA—within the physical constraints of the nucleus. We used chromosome conformation capture (3C) followed by high-throughput sequencing (Hi-C) with wild-type and mutant strains of Neurospora crassa to gain insight into the role of heterochromatin in the organization and function of the genome. We tested the role of three proteins thought to be important for establishment of heterochromatin, namely, the histone H3 lysine 9 methyltransferase DIM-5, Heterochromatin Protein 1 (HP1), which specifically binds to the product of DIM-5 (trimethylated H3 lysine 9 [H3K9me3]), and DIM-3 (importin alpha), which is involved in DIM-5 localization. The average genome configuration of the wild-type strain revealed strong intra- and inter-chromosomal associations between both constitutive and facultative heterochromatic domains, with the strongest interactions among the centromeres, subtelomeres, and interspersed heterochromatin. Surprisingly, loss of either H3K9me3 or HP1 had only mild effects on heterochromatin compaction, whereas dim-3 caused more drastic changes, specifically decreasing interactions between constitutive heterochromatic domains. Thus, associations between heterochromatic regions are a major component of the chromosome conformation in Neurospora, but two widely studied key heterochromatin proteins are not necessary, implying that undefined protein factors play key roles in maintaining overall chromosome organization.
Eukaryotic chromosomes are compactly packaged within nuclei, but mechanisms for chromatin compaction and the functional significance of the resulting chromosome conformation are not well understood (Cremer and Cremer 2001, 2010; Dekker et al. 2013). Recent “chromosome conformation capture” (3C) technologies can detect closely associated chromatin regions in the nucleus (Dekker et al. 2013), and coupling 3C with massively parallel DNA sequencing (“Hi-C”) allows examination of genome-wide chromatin associations to provide insight into higher-order chromosome organization (Lieberman-Aiden et al. 2009; Dekker et al. 2013; Nagano et al. 2013). Application of Hi-C in human cell lines, fruit flies, yeasts, and plants established that genomes are indeed spatially organized, and patterns of chromatin modifications are typically correlated with the organization of genomic domains (Duan et al. 2010; Hou et al. 2012; Sexton et al. 2012; Jin et al. 2013; Nagano et al. 2013; Feng et al. 2014; Mizuguchi et al. 2014; Rao et al. 2014; Wang et al. 2015). In humans and Drosophila, silent and active genomic regions are segregated into “topologically associated domains” (TADs, also referred to as “physical domains” or “topological domains”) that correlate with transcriptional state (Lieberman-Aiden et al. 2009; Hou et al. 2012; Imakaev et al. 2012; Nora et al. 2012; Naumova et al. 2013; Rao et al. 2014; Eagen et al. 2015), but in plants and yeasts, TADs are less obvious (Duan et al. 2010; Moissiard et al. 2012; Feng et al. 2014; Mizuguchi et al. 2014). In Schizosaccharomyces pombe and Arabidopsis thaliana, interactions among heterochromatic regions appear to dominate genome organization. Although methylation of H3K9 seems important in S. pombe (Mizuguchi et al. 2014), it may be dispensable for genome organization in Arabidopsis (Feng et al. 2014). Because of these differences, further studies regarding the contributions of histone modifications to genome organization are warranted.
Constitutive heterochromatin in Neurospora crassa is characterized by A:T-rich repetitive, methylated DNA that is mostly composed of transposons relicts and contains few genes, shows little transcription, is associated with H3K9me3, and is principally found in centromere regions (Tamaru et al. 2003; Lewis et al. 2008; Smith et al. 2011). In contrast, facultative heterochromatin, which is involved in regulated gene repression, is not normally found in centromere regions, is not A:T-rich, and is marked by di- and/or trimethylation of H3K27 (H3K27me2/3) (Jamieson et al. 2013, 2015). Although both H3K9me3- and H3K27me2/3-dependent heterochromatin are required for viability and proper development of many eukaryotes (Tachibana et al. 2002; Heard 2005; Wutz 2011; Elgin and Reuter 2013; Grossniklaus and Paro 2014), including some fungi (Connolly et al. 2013), it is dispensable in others. Saccharomyces cerevisiae lacks both H3K9 and H3K27 methylation, as well as the chromodomain proteins that normally bind to these marks; whereas in S. pombe, H3K9 methylation is dispensable and H3K27 methylation is absent. Neurospora has both heterochromatin marks, but mutants lacking them are viable (Tamaru et al. 2003; Jamieson et al. 2013), rendering it an excellent system to explore the possible role of these and other features of heterochromatin in chromatin organization.
In Neurospora, H3K9me3 is catalyzed by DIM-5 as part of the DCDC (DIM-5/-7/-9, CUL4, DDB1 Complex) (Tamaru and Selker 2001; Lewis et al. 2010a,b; Adhvaryu et al. 2014). Neurospora dim-5 mutants lack detectable H3K9me3 and cytosine DNA methylation (Tamaru and Selker 2001; Tamaru et al. 2003; Lewis et al. 2008), HP1 is mislocalized but retained within the nucleus (Freitag et al. 2004), and H3K27me2/3 is redistributed to former H3K9me3 regions (Basenko et al. 2015; Jamieson et al. 2015). One Neurospora mutant defective in DNA methylation, dim-3 (Foss et al. 1993), encodes a defective importin alpha (DIM-3) with an E396K missense mutation (Klocko et al. 2015). Importin alpha has roles in nucleocytoplasmic transport, maintenance of nuclear membrane integrity, and nuclear size regulation (Gorlich and Mattaj 1996; Goldfarb et al. 2004; Hachet et al. 2004; Levy and Heald 2010), but in addition to these traditional functions, Neurospora importin alpha is required for normal targeting of DIM-5 and DIM-7 to heterochromatic regions (Klocko et al. 2015). Overall, the neomorphic dim-3 (E396K) allele results in dramatically reduced H3K9me3, reduced DNA methylation, and diminished telomeric gene silencing despite efficient nuclear transport of the heterochromatin machinery, although the detailed mechanism for this remains obscure. A strain in which dim-3 has been deleted does not survive (Klocko et al. 2015). Heterochromatin Protein-1 (HP1) binds H3K9me3, providing a scaffold for multiple heterochromatin complexes (Nielsen et al. 2002; Freitag et al. 2004; Honda et al. 2012). HP1 mutants have no detectable DNA methylation (Freitag et al. 2004); and like DCDC mutants, H3K27me2/3 is localized to former H3K9me3 regions (Basenko et al. 2015; Jamieson et al. 2015). Given the effects these proteins have on Neurospora heterochromatin formation, we examined the chromosome conformation of wild-type N. crassa by Hi-C and determined whether mutants in the pathway for constitutive heterochromatin formation resulted in altered genome organization.
Results
Centromere and subtelomere contacts dominate genome-scale Hi-C maps in wild-type Neurospora
To understand how the Neurospora genome is organized, we produced replicate Hi-C data sets from a wild-type (WT) strain and from heterochromatin mutants (Supplemental Table S1). Approximately 20 million paired-end reads were produced per replicate, allowing data analysis at a minimum resolution of 50 kb for the whole genome (≥99% of 50-kb bins have 1000 or more observations), and up to 10 kb for the strongest interactions (Supplemental Figs. S1–S3). Inspection of the WT data set revealed an inversion on linkage group (LG) VI in the latest assembly (version 12) of the N. crassa genome (Supplemental Fig. S4). Thus, all subsequent mapping and analyses were performed on a corrected version of Assembly 12. As replicate contact maps were highly reproducible, we combined replicate data sets to improve resolution (Supplemental Fig. S5).
As expected, we found an inverse relationship between contact frequency and genomic distance. Local interactions or “contacts,” defined as regions of the genome that are in close proximity, dominated genome-scale Hi-C maps and are shown as an intense red signal running from top-left to bottom-right on these maps (Fig. 1A). Linear regression on log10-transformed genomic distances and contact probabilities gave a slope of −1.16 (Supplemental Fig. S3), consistent with contact probability decaying with a power law function of distance−1.16. Strong signals for inter-chromosomal interactions between the seven centromeres were observed (orange to white “x-like” patterns aligned with the centromeres, indicated by green rectangles) and 14 subtelomeres (Fig. 1A). Although contact frequencies were highest between the cores of the centromeres and subtelomeres, interactions between domains neighboring these regions were also increased (Fig. 1A), implying that interactions within the pericentromeric and subtelomeric chromatin occur.
Figure 1.

The Neurospora genome is organized in three-dimensional space. (A) Heatmap showing observed contacts (log2) between binned 40-kb regions of the ∼43 Mb N. crassa genome (1013 bins). The seven chromosomes (linkage groups LGI–LGVII) are indicated with elongated ovals next to the heatmap; green bars mark the centromeres. Frequent local interactions emerge as intense red signals along the diagonal. Strong intra- and inter-chromosomal contacts between centromeres (white to orange “X” patterns) and subtelomeres are also evident. (B) Heatmap of the strongest intra-chromosomal contacts within LGII at 40-kb resolution after normalizing for genomic distance. H3K9me3 ChIP-seq tracks (green) are shown for reference. The black arrowhead indicates increased interactions between euchromatic flanks immediately bordering pericentromeres. The black box indicates increased interactions between the left and right subtelomeric regions, the purple arrowhead denotes interspersed heterochromatin, and the oval denotes a region with few contacts between the centromeric region and the right arm. The triangle marks the region highlighted in E. (C) Plot of the strongest intra-chromosomal contacts within LGII at 10-kb resolution after normalizing for genomic distance. Black links indicate contacts with a log2 enrichment ≥2.25. The line thickness indicates contact frequency. For this and subsequent Circos plots, H3K9me3, CenH3, and H3K27me2/3 enrichment in a WT strain are shown as green, orange, and purple histograms, respectively. Distance from the left telomere is indicated. (D) Plot of the strongest inter-chromosomal contacts at 10-kb resolution after normalizing for genomic distance. Black links indicate contacts with a log2 frequency ≥3.0. (E) Expanded heatmap of observed contacts (log2) within a ∼0.9 Mb region indicated by the triangle in B (3.55–4.45 Mb) at 10-kb resolution showing local interactions. Green arrowheads mark the enriched long-range interactions between heterochromatic regions.
We filtered out close interactions by calculating median contact frequencies at each genomic distance (“the expected” contacts) and then applying these frequencies to our observed Hi-C interaction data to determine a log2-transformed ratio of “observed versus expected” contacts (Supplemental Fig. S6, method; Supplemental Fig. S7, genome-wide observed versus expected heatmap); a map of LGII from WT (Fig. 1B) is representative of patterns on all seven chromosomes. Most striking are contacts between pericentromeric regions and the neighboring euchromatin (red signal emanating diagonally from the block of H3K9me3-enriched chromatin at ∼1 Mb, black arrowhead) and limited interactions between centromeres and chromosome arms (blue cross-like signal emanating from the same region; oval). Frequent contacts between the subtelomeres are inferred from red signals in the top-right and bottom-left corners (square). Also evident are long-range contacts between smaller regions of interspersed heterochromatin within the chromosome arms, resulting in isolated red foci aligned with H3K9me3-enriched regions (purple arrowhead highlights a strong example).
Centromeres are defined by the presence of a histone H3 variant, called CENPA in humans and CenH3 in Neurospora, where it is encoded by hH3v (Smith et al. 2011). Although Neurospora centromeric DNA is lengthy, repetitive, and A:T rich, the repetitive elements are not identical, allowing unique mapping of short sequencing reads (Smith et al. 2011). We found that all seven centromeres share similar chromatin conformation: The CenH3- and H3K9me3-enriched centromere regions are isolated from surrounding domains, and the neighboring euchromatic flanks frequently contact (Fig. 1B, black arrowhead). The boundaries of the centromere cores inferred from our Hi-C data sets correlate well with those inferred from CenH3 enrichment (Supplemental Fig. S8; Smith et al. 2011). By polymer modeling, centromeres resemble a densely packed “ball” of heterochromatin (Supplemental Fig. S9).
To illustrate the most prominent structures in the Hi-C data sets, we produced Circos plots for intra-chromosomal contacts (Fig. 1C; Supplemental Fig. S10; Krzywinski et al. 2009), in which contacts with an observed versus expected ratio (log2) ≥2.25 are displayed as black links between the two regions, with line weight and shade correlating to the strength of the domain interaction. The plot of LGII shows contacts between H3K9me3-enriched centromeric and pericentromeric regions, contacts between subtelomeres, and a network of interactions between regions of dispersed H3K9me3-marked heterochromatin. This pattern is common to all chromosomes (Supplemental Fig. S11), suggesting that heterochromatic regions dominate the genome interaction landscape. The overall pattern of intra-chromosomal interactions is also seen in a plot of inter-chromosomal contacts with an observed versus expected ratio (log2) ≥3.0 (Fig. 1D), where centromeric, subtelomeric, and interspersed heterochromatin region interactions dominate inter-chromosomal interactions.
Heterochromatic regions border chromatin ‘globules’
The association between heterochromatic regions inferred from our WT Hi-C data set suggests the existence of a heterochromatic network within the nucleus. To investigate the architecture of this network, we examined the structure of chromatin immediately surrounding dispersed heterochromatic regions. We found that blocks of heterochromatin segregate the genome into distinct gene-rich domains typically <100 kb in size, which may be comparable to previously described TADs, defined as “self-associating chromosomal domains occurring at the sub-megabase scale” (Nora et al. 2012), or “globules,” defined as “locally self-interacting domains 50–100 kb in size,” which are dependent on cohesins (Mizuguchi et al. 2014). One example occurs near the right subtelomere of LGII (Fig. 1E; Supplemental Fig. S12), where interactions between euchromatin (broad, deep orange to red triangular patterns along the bottom of the heatmap) are interrupted by H3K9me3-enriched regions. Long-range associations between H3K9me3-enriched regions are evident as intense foci at the heatmap apex (e.g., Fig. 1E, green arrowheads).
Examination of the strongest contacts made by chromatin domains enriched with the constitutive heterochromatic mark, H3K9me3 (Fig. 2A, green tracks), or the facultative heterochromatic marks, H3K27me2/3 (Fig. 2A, purple tracks), revealed a striking pattern of interactions between H3K9me3-enriched domains both within chromosomes (green links outside) and between chromosomes (green links inside). Most obvious are the interactions between all seven centromeric regions, yet many are between smaller, dispersed, heterochromatic domains. An additional, albeit weaker, web of contacts involves H3K27me2/3-enriched regions within (purple links outside) and among chromosomes (purple links inside). This is most obvious at the subtelomeric regions, where this modification is most prevalent (Fig. 2A).
Figure 2.

Predicted networks of H3K9me3-marked and H3K27me2/3-marked regions. (A) Plot of frequently observed contacts between heterochromatic regions from all seven chromosomes (LGI–LGVII) at 10-kb resolution. Green and purple links indicate frequent contacts between regions enriched with H3K9me3 or H3K27me2/3, respectively. Links inside and outside the plot show inter- and intra-chromosomal associations, respectively. The near absence of subtelomeric interactions between H3K27me2/3-enriched regions on LGV may reflect the incomplete assembly of the rDNA repeats on the LGV left arm. (B) Summary of observed levels of strong intra- and inter-chromosomal links between regions enriched with H3K9me3 (green bars) or between H3K9me3-enriched regions and regions without H3K9me3 (gray bars), generated with the script matrix2CircosK9Quant.py. (C) Summary of strong intra- and inter-chromosomal links between regions enriched with H3K27me2/3 (purple bars) or between regions enriched with H3K27me2/3 and regions without H3K27me2/3 (gray bars), generated with the script matrix2CircosK27Quant.py. (D) Distributions of ratios of interactions of like (Mark to Mark) or unlike (Mark to Any) regions from 10,000 randomly generated arrangements of strong intra- and inter-chromosomal contacts originating from H3K9me3-enriched regions (green) or H3K27me2/3-enriched regions (purple), produced by the scripts K9RandomizeInter.py, K9RandomizeIntra.py, K27RandomInter.py, and K27RandomizeIntra.py. The observed ratios of specific to nonspecific contacts for the H3K9me3 and H3K27me2/3 networks are denoted with green and purple arrows, respectively, and correspond to the plots in B and C.
To examine the significance of these networks, we compared the number of strong contacts between two H3K9me3-enriched regions (“K9-K9”) and strong contacts between an H3K9me3-enriched region and a nonenriched region (“K9 to any”), which yielded heterochromatic to nonspecific ratios of 2.7 (within chromosomes) and 53.7 (between chromosomes) (Fig. 2B); a similar analysis produced intra- (0.5) and inter-chromosomal (0.8) ratios for the H3K27me2/3 network (Fig. 2C). Thus there is indeed a strong bias for marked domains to contact other domains with the same histone marks. To verify that these heterochromatin-specific contacts do not occur at random, we simulated 10,000 possible arrangements of this chromatin network by having new links, which originated at H3K9me3- or H3K27me2/3-enriched regions and randomly terminate at another region of the genome. Heterochromatin-specific links were counted, and the ratio between specific and nonspecific contacts were calculated in each simulation (Fig. 2D). These simulations produced a distribution of inter- and intra-heterochromatin-specific contact ratios that were far below the contact ratio we observed in our WT Hi-C data set, confirming that regions with the same heterochromatic mark are more likely to interact or are in close proximity.
Strains lacking HP1 or H3K9 methylation have reduced contacts between heterochromatic flanks and subtelomeres
DIM-5 catalyzes H3K9me3 and is essential for normal formation of heterochromatic regions (Tamaru and Selker 2001; Tamaru et al. 2003), whereas HP1 binds to H3K9me3 and recruits the cytosine methyltransferase, DIM-2, to heterochromatic domains (Freitag et al. 2004; Honda and Selker 2008). HP1 forms distinct complexes to restrict spreading of DNA methylation and to deacetylate histones (Honda et al. 2010, 2012), and its absence alters the distribution of H3K27me2/3 (Basenko et al. 2015; Jamieson et al. 2015). Because heterochromatic regions dominate chromatin interactions detected by Hi-C, we tested whether strains lacking DIM-5 (Δdim-5) or HP1 (Δhpo) lose these interactions.
Surprisingly, raw contact maps obtained with Δdim-5 (Fig. 3; Supplemental Figs. S13, S14) and Δhpo (Supplemental Figs. S15–S17) are similar to the maps obtained with WT. Like in WT, we found strong centromeric and pericentromeric contacts, subtelomeric contacts, and little contact between centromeres and chromosome arms (Fig. 3A; Supplemental Figs. S14A, S15A, S17A). Observed versus expected heatmaps for Δdim-5 and Δhpo highlight dominant genomic interaction features that are independent of genomic distance, and these confirmed robust pericentromeric, telomeric, and interspersed heterochromatic contacts, and decreased euchromatic-centromeric contacts (Fig. 3B; Supplemental Figs. S14B, S15B, S17B). To focus on differences between the WT and Δdim-5 or Δhpo data sets, we calculated ratios between the observed versus expected Hi-C data sets of WT and mutant strains and displayed these in log2-transformed heatmaps (Fig. 3C; Supplemental Figs. S14C, S15C, S17C). Strikingly, in both Δdim-5 and Δhpo, the loss of H3K9me3 “decompressed” the pericentromeric regions; intra-chromosomal pericentromere interactions decreased (blue signals centered on heterochromatin blocks) (Fig. 3C; Supplemental Fig. S15C, black arrowheads). A ∼40% decrease in pericentromeric contacts in Δdim-5 and Δhpo strains was observed in the combined data for all seven chromosomes (Fig. 3D; Supplemental Figs. S15D, S18, S19A,B), whereas the number of contacts between centromeric regions and the extent of the centromere domains in Δdim-5 and Δhpo strains was unchanged (Supplemental Figs. S8, S14B, S17B). To gain insight into how chromosome conformation is influenced by loss of DIM-5 and HP1, we generated Circos plots of the differences between the Δdim-5/Δhpo and WT heterochromatin networks. Most individual inter-heterochromatic interactions in Δdim-5 and Δhpo strains were changed, primarily resulting in increased core centromere and decreased telomere contacts (Fig. 3E; Supplemental Fig. S15E). Indeed, loss of H3K9me3 decreased inter-subtelomere compaction, as contact strength was decreased by ∼40% between subtelomeres of each chromosome in Δdim-5 and Δhpo strains (Supplemental Fig. S20). Also, interspersed heterochromatic regions appeared “decompressed” in Δdim-5 and Δhpo strains, as indicated by decreases in contact strength in the flanking sequences surrounding these small heterochromatic loci (violet arrows) (Fig. 3C; Supplemental Fig. S15C). Close inspection of eight interspersed heterochromatic regions from five chromosomes (Fig. 4A,C,D), as well as a genome-wide analysis (Fig. 4B,E), highlighted this decrease in the contact frequency between regions immediately bordering heterochromatin in both mutants. The change in contact strength between heterochromatin flanks did not extend into the surrounding euchromatic globules (Supplemental Fig. S12) and did not lead to large-scale rearrangements of the heterochromatin network (Supplemental Figs. S21, S22).
Figure 3.

Reduced interactions between heterochromatin flanks in a strain lacking the H3K9 methyltransferase, DIM-5. (A) Heatmap of observed contacts (log2) within LGII in a Δdim-5 strain at 50-kb resolution. (B) Heatmap of LGII showing the ratio (log2) between the observed and expected (median at each genomic position) frequency of interactions in a Δdim-5 strain. (C) Heatmap showing the fold change (log2) in contact frequencies on LGII between the Δdim-5 and WT strains. Levels of H3K9me3 observed in the WT strain are displayed in green. Black arrowhead marks decreased pericentromeric contacts, and purple arrowheads mark decreased interactions of interspersed heterochromatic flank regions. (D) Heatmaps of the combined observed versus expected ratios of all seven centromeres in WT (top) and Δdim-5 (bottom), generated with the script plotCentromeres.py. Boxes indicate interactions between euchromatic regions bordering pericentromeres. (E) Circos plot of the largest changes in inter-chromosomal interaction frequencies in Δdim-5 versus WT strains; each data set contained 30 million reads to yield equivalent numbers of filtered reads. Regions with increased or decreased interaction frequencies are in red or blue, respectively. Line thickness corresponds to magnitude of the changes. Histograms display the WT enrichment of H3K9me3 (green), CenH3 (orange), and H3K27me2/3 (purple); the Δdim-5 strain has no H3K9me3 (Tamaru and Selker 2001) and reduced occupancy of CenH3 at most centromeres (Smith et al. 2011).
Figure 4.

Interactions between flanks of interspersed heterochromatic regions are reduced in Δdim-5 and Δhpo. (A) Heatmaps showing contact frequencies (log2) around eight interspersed heterochromatic regions in WT, Δdim-5, and Δhpo. Levels of WT H3K9me3 enrichment are shown in green. Examples were chosen to illustrate changes between mutants and WT (see also D,E). (B) Heatmaps showing the average signal surrounding all heterochromatic regions in WT, Δdim-5, and Δhpo strains, produced by script plotHetStack.py. Levels of WT H3K9me3 enrichment are shown in green. (C) The signal in box A corresponds to interactions between heterochromatin flanks and was normalized to box B and C signals to account for any differences in data depth between strains. (D) Box plot showing contact frequency quantifications (log2) of the eight examples in A for two replicates of WT, Δdim-5, and Δhpo strains, produced by script getHetFlankInteractions.py. (E) Box plot showing contact frequency quantification (log2) of all examples in the genome for two replicates of WT, Δdim-5, and Δhpo strains, produced by script getHetFlankInteractions.py.
The dim-3 strain has a radically altered chromatin conformation
The Neurospora homolog of importin alpha, DIM-3, plays a role in heterochromatin formation (Klocko et al. 2015). The neomorphic dim-3 (E396K) allele results in greatly reduced H3K9me3, moderately reduced DNA methylation, and diminished telomeric gene silencing. To determine whether Neurospora importin alpha contributes to genome organization, we performed Hi-C analysis on the dim-3 (E396K) strain (henceforth, simply called dim-3).
The Hi-C heatmap for the dim-3 strain resembles those of WT, Δdim-5, and Δhpo, revealing strong inter- and intra-centromeric and inter-subtelomeric heterochromatin interactions across all chromosomes (Fig. 5A; Supplemental Figs. S23, S24A). Heatmaps comparing observed versus expected ratios in the dim-3 data set confirmed the presence of mutually exclusive strong pericentromeric and subtelomeric interactions, whereas centromere–euchromatin interactions appeared inhibited (Fig. 5B; Supplemental Fig. S24B). Comparison of observed versus expected heatmaps between dim-3 and WT showed, however, greatly increased centromere–euchromatin interactions and substantially decreased pericentromeric and subtelomeric interactions (Fig. 5C; Supplemental Fig. S24C). Compared to WT, dim-3 data sets displayed depletion of close proximity interactions (Supplemental Figs. S12, S19, S25) leading to a smaller decay exponent (−0.83 versus −1.16 in WT) (Supplemental Fig. S3) and increased inter-chromosomal ligation products (Supplemental Fig. S26). Although this is consistent with compromised local compaction in dim-3, there is a formal possibility that the Hi-C protocol used here (Lieberman-Aiden et al. 2009; Rao et al. 2014) contributed to the differences observed between dim-3 and all other strains.
Figure 5.

Defective importin alpha (DIM-3) causes altered chromatin conformation. (A) Heatmap of observed contacts (log2) within LGII in dim-3 at 50-kb resolution. (B) Heatmap of LGII showing the ratio (log2) between the observed frequency of interaction and the median frequency at each genomic position in the dim-3 strain. (C) Heatmap showing the fold change in observed versus expected contact frequencies (log2) of LGII between the dim-3 and WT strains. WT levels of H3K9me3 are displayed in green. (D) Circos plot of the largest changes in inter-chromosomal interaction frequencies in dim-3 and WT strains. To normalize data set depths, 16.5 million read pairs were randomly selected from the WT data set and compared to the entire dim-3 data set. Regions with increased interaction frequencies are in red, whereas regions with decreased frequencies are in blue; different line thicknesses were used to convey differences in the absolute magnitude of the changes. Although WT H3K9me3 (green), CenH3 (orange), and H3K27me2/3 (purple) histograms are shown, a dim-3 strain has a large reduction of H3K9me3 (Klocko et al. 2015). (E) Circos plot displaying all strong (log2 > 3.0) inter-chromosomal chromatin interactions after normalizing for genomic distance within the dim-3 strain, as in Figure 1D. (F) Schematic depicting the division of the nuclear space into three zones (1–3) of equal area for the categorization of telomeric foci (green; TRF-1-GFP) relative to the nuclear membrane (red; ISH-1-BFP). (G) Two examples of nuclei from WT (left) and dim-3 (right) strains expressing TRF-1-GFP foci and ISH-1-BFP. Each scale bar is 1 µm. (H) Box plot showing nuclear membrane diameter (μm) of WT (dark gray; n = 324 nuclei) and dim-3 (light gray; n = 366 nuclei) strains. Mean and variance of nuclear membrane diameter for WT is 2.05 μm ± 0.1 and 2.25 μm ±0 20 for dim-3; P = 5.6 × 10⁻¹¹ (ANOVA test). (I) Graph showing the percentage of WT (dark gray; n = 324 total nuclei) or dim-3 (light gray; n = 366 total nuclei) nuclei with telomeric foci in only Zone 1 or Zone 2 (left) or containing at least one Zone 3 telomeric focus (right). Note that since dim-3 nuclei often contained multiple foci in Zone 3, this tally may underestimate the total number of decoupled telomeres. Asterisks denote significant changes (P < 0.01; nuclei with foci in Zone 1 and/or Zone 2 only P-value = 3.7 × 10⁻⁵; nuclei with foci in Zone 3 P-value = 3.9 × 10⁻¹⁰; χ2 test); P-value = 6.7 × 10⁻¹⁴ (χ2 test) of all Zone differences between WT and dim-3.
Comparison of approximately equal numbers of filtered reads from the WT and dim-3 data sets with Circos plots confirmed that almost all of the strongest inter-heterochromatic interactions were diminished in dim-3 (Fig. 5D). Quantification of all inter-chromosomal interactions revealed a large decrease in interactions between pericentromeric regions (Supplemental Fig. S18) and subtelomeric regions (Supplemental Fig. S20); intra-subtelomeric and intra-pericentromeric contacts were also depleted (Supplemental Fig. S19; cf. Supplemental Fig. S27 to Fig. 1D). In contrast, localized bundling of the centromere core and large interspersed heterochromatic regions increased in dim-3 (Supplemental Fig. S19). In addition, the number of strong inter-chromosomal contacts originating from euchromatin increased (cf. Figs. 1D, 5E). Inspection of observed versus expected interaction heatmaps also revealed increased centromere–euchromatin contacts (cf. Figs. 5B, 1B; Fig. 5C).
To gain mechanistic insight into the observed chromosome conformation changes in dim-3, we performed deconvolution microscopy on dim-3 strains expressing fluorescently labeled proteins that mark telomeres (TRF-1, the functional homolog of the human telomeric repeat binding factors 1 and 2) (Broccoli et al. 1997) and the nuclear membrane (ISH-1, a trans-nuclear membrane protein) (Taricani et al. 2001). We measured the distance between individual telomere foci and the nuclear membrane, measured nuclear volumes, and mapped telomere foci into three zones of equal area (Fig. 5F; Hediger et al. 2002; Taddei et al. 2004, 2006; Meister et al. 2010). In WT, telomeres marked by TRF-1-GFP were in 2–4 foci that localized close to the nuclear membrane (Zone 1) (Fig. 5G; Supplemental Fig. S28A). The average nuclear diameter increased in dim-3 (Fig. 5H), as did the number of telomeric foci in the central nuclear region (Zone 3) (Supplemental Fig. S28B). WT and dim-3 nuclei showed approximately the same number of telomeric bundles (Supplemental Fig. S28A), but 43% of dim-3 nuclei contained at least one Zone 3 focus, compared to only 16% in WT nuclei (Fig. 5I). This difference may underrepresent overall telomeric bundle mislocalization in dim-3, because numerous nuclei had more than one Zone 3 focus (Fig. 5G, bottom right). We conclude that chromatin conformation in dim-3 is significantly altered, with reduced inter- and intra-chromosomal heterochromatin contacts, compromised local compaction, and increased inter-chromosomal euchromatin-heterochromatin interactions, perhaps resulting from diminished telomere mooring with the nuclear membrane.
Discussion
Chromosome conformation capture in combination with high-throughput sequencing was used to define the average genome organization of WT and mutant strains of the filamentous fungus N. crassa. We show that organization of the Neurospora genome is dominated by interactions between regions of constitutive heterochromatin, which are marked by H3K9me3. Specifically, pericentromeric heterochromatin, interspersed heterochromatic regions, and subtelomeres within each chromosome interact despite being megabases apart. The same heterochromatic regions also form a network of strong inter-chromosomal contacts. Thus, genome organization in Neurospora nuclei is largely defined by “heterochromatin bundling,” as previously defined for Drosophila (Li et al. 2003). In silico modeling of the chromosome conformations based on our WT Hi-C data sets supports a “clothespin”-like structure for Neurospora chromosomes, with each centromere at one terminus of a folded chromosome and subtelomeres closer to each other than to the centromere, which is almost at the opposite end of the folded chromosome (Fig. 6A; Supplemental Figs. S9, S29). Although in some cases, centromeres and subtelomeres are modeled to be relatively close, we did not observe strong contacts between these heterochromatic regions, suggesting mechanisms exist to separate centromeres and subtelomeres.
Figure 6.
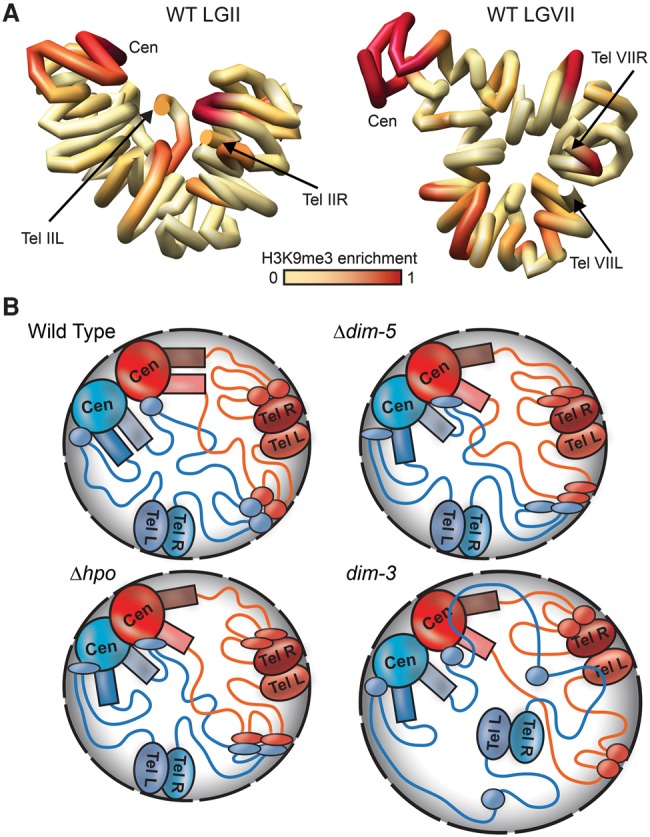
In silico chromosome modeling and schematics depicting genomic interactions in WT and mutant strains. (A) Computationally determined three-dimensional polymer models of Neurospora LGII (left) and LGVII (right) with chromosomes shown as continuous tubes. The path of each tube passes through the center of a series of 50-kb spheres, the relative conformation of which were determined using the contact frequencies in the WT Hi-C data set to set attractive or repulsive forces between each sphere and allowing the system to relax to a low energy state. The precise path of chromatin shown in these models may not be biologically relevant. Degree of WT H3K9me3 enrichment is shown in red. (B) Models for chromosome conformations in WT and heterochromatin-deficient strains for a nucleus with two chromosomes (blue and red), centromeric (CEN), pericentromeric (colored rectangles), subtelomeric (TEL), and interspersed heterochromatic (colored ovals) regions are indicated, and euchromatin is indicated as colored lines. (Top left) In a WT strain, inter- and intra-chromosomal heterochromatic regions bundle to dominate the genomic interaction landscape near the nuclear periphery (gray shaded area), with strong inter-centromeric as well as inter- and intra-chromosomal pericentromeric interactions. Although Hi-C contact data suggest subtelomeres do not frequently contact centromeres, in silico modeling (A; Supplemental Figs. S29, S30) suggests all heterochromatic regions may be in close proximity in the nucleus. (Top right) In a Δdim-5 strain, which is devoid of H3K9me3 and thus specific HP1 localization, the pericentromeric and subtelomeric regions have reduced interactions, whereas some centromeric and less compact interspersed heterochromatic regions (thin ovals) have increased contacts. (Bottom left) In a Δhpo strain, where heterochromatin retains H3K9me3 but has no HP1, the overall chromosome conformation is similar to Δdim-5. (Bottom right) In dim-3, which carries a mutated form of importin alpha that severely reduces H3K9me3 levels but retains near WT levels of HP1 (Klocko et al. 2015), telomere clusters (and some associated interspersed heterochromatic regions) become uncoupled from the nuclear periphery due to enlarged nuclear membrane diameter (black dashed outlines), thus increasing heterochromatic–euchromatic contacts and compromising the heterochromatic bundle.
Heterochromatin bundling is supported by cytological observations in Neurospora, as HP1-GFP forms only three to four heterochromatic foci that colocalize with densely staining genomic DNA (Freitag et al. 2004). It is still unclear exactly which heterochromatic regions localize to each HP1-GFP focus, but observations on the localization of GFP-labeled CenH3 (E Selker and M Freitag, unpubl.), and the centromere foundation proteins CENP-T and CENP-S (Smith et al. 2012), suggest that all centromere regions group together in Neurospora, consistent with our observation that the strongest Hi-C contacts of centromeric DNA are with other centromeric sequences. Contact frequencies between centromere pairs suggest that centromere cores associate randomly, but it is possible that slight variations in composition or length of centromeric DNA of each chromosome may influence the total number of inter-centromere contacts. Use of fluorescently tagged telomere repeat-binding protein (TRF-1-GFP) revealed 2–4 foci associated with the nuclear membrane in WT and dim-3. We observed interactions between all telomeric sequences by Hi-C, suggesting that telomeres from different chromosomes form foci in the different nuclei observed. Thus, mapping and quantifying the dynamics of subtelomeric heterochromatin associations should be interesting.
In contrast to heterochromatin bundling, few strong intra- or inter-chromosomal contacts between euchromatic regions were found. Hi-C does not distinguish between interactions that occur often but in a few nuclei and interactions that occur rarely but in almost all nuclei (Duan et al. 2010). Thus, specific enhancer–promoter interactions that help define large euchromatic domains are expected to be less prominent in Hi-C analyses of asynchronous Neurospora nuclei. Previous studies also suggest that loops bringing enhancers near to promoters may be transient (Rao et al. 2014), and although important for gene regulation, are likely insufficient to provide a structural basis for the formation of large euchromatic domains (Eagen et al. 2015). Metazoan topologically associating domains (TADs) (Nora et al. 2012) or the self-interacting “globules” described in fission yeast (Mizuguchi et al. 2014) represent the most consistent feature among cell types of various organisms and have been suggested to correspond to specific states of gene expression (Hou et al. 2012; Sexton et al. 2012; Jin et al. 2013; Nagano et al. 2013; Feng et al. 2014; Mizuguchi et al. 2014; Rao et al. 2014; Wang et al. 2015). In mammals, TADs segregate chromosomes and chromosome territories (Imakaev et al. 2012), and in S. pombe, the ∼50- to 100-kb globules are defined by the position of cohesin subunits (Mizuguchi et al. 2014). We observed larger globule-like regions, delineated by interspersed heterochromatic regions in Neurospora, and it will be interesting to learn whether cohesins are essential for organization of these globule-like domains.
Because of the dominance of heterochromatin interactions in shaping chromosome conformation in Neurospora, it was surprising that Hi-C data sets derived from Δdim-5 and Δhpo strains, which were assumed to be completely deficient in heterochromatin formation, were similar to WT. Polymer modeling suggests that chromosomes in Δdim-5 and Δhpo strains have conformations similar to those in WT (Supplemental Fig. 30). Thus, although we observed minor changes in chromosome conformation in the mutants, our results suggest that the H3K9me3 mark and its adaptor protein HP1 contribute little to overall genome organization, and unknown factors may be more important. This is not without precedent, as Arabidopsis chromosome superstructure microrchidia ATPases (ATMORC1, ATMORC6) impact heterochromatin organization without influencing cytosine DNA methylation or methylation of H3K9 or H3K27 (Moissiard et al. 2012; Feng et al. 2014). Although these proteins are not conserved in fungi, their importance in Arabidopsis suggests that genome organization can be maintained by additional factors acting upon heterochromatic regions.
Our results extend those obtained with Arabidopsis and S. pombe mutants defective in H3K9 methylation. In Arabidopsis, loss of H3K9me2 in a triple mutant of genes for histone methyltransferases (suvh4 suvh5 suvh6) showed reduced interactions between pericentromeric heterochromatic regions (Feng et al. 2014). In S. pombe, loss of the H3K9 methyltransferase (Clr4) increased contour length of centromere-proximal regions (consistent with reduced interactions between pericentromeric regions), increased contacts between centromeres and chromosome arms, and reduced contacts between telomeres (Mizuguchi et al. 2014). One difference between results obtained with S. pombe and Neurospora is the increased number of inter-chromosomal centromeric contacts in the Δdim-5 and Δhpo strains compared with decreases in such contacts in the S. pombe clr4Δ strain, suggesting internal centromeric sequences are more promiscuous with other centromeres in strains devoid of these traditional heterochromatic marks.
Our Hi-C data sets did not reveal significant collapse of centromere boundaries despite confinement of the centromere-specific histone H3, CenH3, to a smaller portion of the centromere region in Δdim-5 and Δhpo strains (Smith et al. 2011). The reduced number of CenH3-containing nucleosomes in Δdim-5 and Δhpo strains is apparently sufficient to maintain centromere identity and establish their cores, suggesting that additional proteins are required to maintain centromere size. Although centromere size appeared unchanged, we found reduced contact frequencies between pericentromeric and flanking euchromatic regions in the Δdim-5 and Δhpo strains. Because most interspersed heterochromatic regions show decreases in their contacts with flanking sequences in Δdim-5 and Δhpo strains, it seems unlikely that reduced pericentromeric flank contacts are due to diminished CenH3 placement, and instead are an effect of the indirect (Δdim-5) or direct (Δhpo) loss of HP1.
We observed substantial decreases in heterochromatic contacts in a strain carrying a defective importin alpha (DIM-3). Wild-type DIM-3 localizes to foci at the nuclear periphery (Klocko et al. 2015). Our cytological analysis showed that DIM-3 is required for normal localization of all telomeric regions to the nuclear periphery, consistent with the observed mislocalization of mutant DIM-3E396K-GFP protein and defects in subtelomeric gene silencing in dim-3 (Klocko et al. 2015). It seems reasonable that uncoupling of a telomere cluster from the nuclear membrane would compromise heterochromatic bundling, perhaps interfering with targeting of the heterochromatin machinery (Klocko et al. 2015), and result in an increase of heterochromatin–euchromatin contacts. In silico polymer modeling suggested that overall chromosome structure is maintained (Supplemental Fig. 30) despite appearing slightly more disordered, which may reflect the increase in inter-euchromatin contacts. Information from other systems showed that defects in importin alpha lead to an increase in nuclear size, attributed to diminished nucleocytoplasmic transport of lamin B3 (Levy and Heald 2010). Interestingly, Neurospora does not encode a lamin homolog. Although causality remains to be determined, it is possible that the observed increased nuclear diameter in dim-3 strains resulted in the observed changes in the chromosome conformation.
In summary, interactions between separate heterochromatic domains enriched with either H3K9me3 or H3K27me2/3 in WT appear to shape overall genome conformation. Unexpectedly, removal of H3K9me3 or its binding protein, HP1, which relays the signal for maintenance of obligate heterochromatin to other proteins, did not drastically change genome organization. In contrast, a mutant version of importin alpha, which is involved in the normal transport or localization of the H3K9 histone methyltransferase DIM-5, resulted in more significant reorganization of chromosome conformation. Our results predict the existence of additional proteins contributing directly to heterochromatin maintenance, and these proteins have critical roles in overall chromosome conformation.
Methods
Strains, culture conditions, crosslinking, and spheroplasting
WT Neurospora crassa (NMF39; 74-OR23-1VA; FGSC 2489) was obtained from the Fungal Genetics Stock Center. The Δdim-5 (N3944) (Lewis et al. 2010a), Δhpo (N5580) (Colot et al. 2006), and dim-3 (N2108; E396K missense mutation) (Klocko et al. 2015) strains were previously described. WT (N6322) and dim-3 (N6323) sibling strains expressing TRF-1-GFP or ISH-1-BFP were constructed by crossing dim-3 strain (N2108) and a strain with trf-1-gfp::hph; ish-1-bfp::hph constructs (M Uesaka and S Honda, in prep.). Culture conditions, crosslinking, and treatment of spheroplasts were standard and are described in detail in the Supplemental Material.
Hi-C library construction, deep sequencing, and data analysis
Hi-C libraries were produced as previously described (Lieberman-Aiden et al. 2009) using HindIII and spheroplasts corresponding to 3.5 µg gDNA. A detailed description of the Hi-C adaptation to Neurospora is available in the Supplemental Material. To prepare Hi-C libraries for Illumina sequencing, either Illumina TruSeq kits were used according to the manufacturer's protocol or replaced by an improved version of that protocol. Indexed paired-end Hi-C libraries were pooled and sequenced on an Illumina HiSeq 2000 at the Center for Genome Research and Biocomputing at Oregon State University as 100-nt paired-end sequencing runs or were sequenced on an Illumina HiSeq 2500 as 50-nt paired-end sequencing runs or a NextSeq500 as a 75-nt paired-end sequencing run at the University of Oregon Genomics Core Facility. Our first dim-3 replicate resulted in fewer reads passing quality filters and thus more bins without data (Supplemental Fig. S23), but the trends for the strongest interactions are identical for both dim-3 replicates when compared to WT replicates, indicating dim-3 data set reproducibility and allowing for merging of replicate data before analysis. Paired-end reads were sorted by adapter index, trimmed to 50 nt (if needed), and mapped to modified Neurospora genome assembly 12 (Supplemental Fig. S4; Galagan et al. 2003).
We provide a pipeline to describe our data processing (Supplemental Scripts.zip). The Hi-C-data processing computational environment was established on iMac computers according to previously published guidelines from the Mirny laboratory (http://mirnylab.bitbucket.org/hiclib/) (Imakaev et al. 2012). Raw reads from .fastq files were mapped with the script “01_mapBatch.py,” filtered at specified resolutions with “02_filterBatch.py,” and processed into raw arrays with “03_correctBatch.py,” which gave the raw read data set as an .hdf5 file and produces raw data heatmap images. The program “h5dictToTxt.py” converted the .hdf5 data set to a heatmap.txt file within a subfolder. The program “04_observedExpected.py” generated the observed versus expected corrected heatmaps, producing the obs-v-exp corrected .txt file and heatmap images. The heatmap.txt (raw data) and obs-v-exp.txt (observed versus expected data) array files were used as the source for all further analyses. To compare two arrays, the program “compare2ObservedExpected.py” was used, which would produce a comparison .txt file. Links for all Circos plots were generated using the program “matrix2Circos.py.” Outside of these initial processing steps, each script used for a particular analysis is named in the corresponding figure legend. Linkage Group (LG) modeling was done with the programs TADbit (http://3dgenomes.github.io/tadbit/) and IMP (https://integrativemodeling.org/) in the Python script “tadbitModel.py.” Details regarding other analyses are given in the corresponding figure legends.
Hi-C contact maps were produced and corrected to account for the unequal representation of genomic loci in Hi-C data sets according to a published method (Imakaev et al. 2012). The corrected contact maps were used in all subsequent analyses. To calculate the ratio of observed contacts to expected contacts, the median contact frequency was calculated at each genomic distance (up to a distance of ∼3.5 Mb, at which point, contact frequency had reached background levels) and used as the expected contact frequency at each respective distance (Supplemental Fig. S6). All other manipulations of the data sets and Circos plot production (Krzywinski et al. 2009) were done with Python scripts listed in the associated figure legend and provided in Supplemental Scripts.zip. ChIP-seq data (WT H3K9me3 and H3K27me3) were reported previously (GSE68897) (Jamieson et al. 2015).
Deconvolution microscopy and nuclear membrane distance analysis
Conidia resuspended in 50% glycerol were imaged on an Olympus IX71 DeltaVision microscope using a 60× objective (NA 1.42), with the 1.6× “optibar” engaged. Three-dimensional Z-stack wide-field images were captured with the DeltaVision softWoRx (GE Healthcare, version 6.5.2) software using FITC (GFP) and DAPI (BFP) filters and subjected to 15 iterations of “conservative ratio” deconvolution (more details are provided in the Supplemental Material). Closest distances from the TRF-1-GFP (telomere) center to the ISH-1-BFP (nuclear membrane; false-colored red) center were measured in 3D. Telomere foci location was categorized into three zones of equal surface area (Meister et al. 2010).
Data access
All raw Hi-C and processed data from this study have been submitted to the NCBI Gene Expression Omnibus (GEO; http://www.ncbi.nlm.nih.gov/geo/) under accession number GSE71024.
Acknowledgments
We thank Tereza Ormsby for validating the Δhpo::hph strain obtained from the Fungal Genetics Stock Center; Diana Libuda and Jackie Helm for assistance with deconvolution microscopy; Jordan Gessaman for assistance with nuclear membrane diameter statistics; and Ayumi Yokoyama for technical support. We also thank members of the Freitag and Selker laboratories for helpful comments and discussions. Funding was provided by grants from the National Institute of General Medical Sciences (NIH) to M.F. (GM097637), E.U.S. (GM035690 and GM093061), and A.D.K. (GM097821), and a Competitive Funds in Program to Disseminate Tenure Tracking System grant, MEXT, Japan, to S.H. J.M.G. was partly supported by a NASA Postdoctoral Program fellowship.
Author contributions: J.M.G., A.D.K., E.U.S., and M.F. conceived and designed the experiments; J.M.G. and A.D.K. performed the experiments; M.U. and S.H. provided strains; and J.M.G., A.D.K., E.U.S., and M.F. analyzed the data and wrote the manuscript.
Footnotes
[Supplemental material is available for this article.]
Article published online before print. Article, supplemental material, and publication date are at http://www.genome.org/cgi/doi/10.1101/gr.203182.115.
References
- Adhvaryu KK, Gessaman JD, Honda S, Lewis ZA, Grisafi PL, Selker EU. 2014. The cullin-4 complex DCDC does not require E3 ubiquitin ligase elements to control heterochromatin in Neurospora crassa. Eukaryot Cell 14: 25–28. [DOI] [PMC free article] [PubMed] [Google Scholar]
- Basenko EY, Sasaki T, Ji L, Prybol CJ, Burckhardt RM, Schmitz RJ, Lewis ZA. 2015. Genome-wide redistribution of H3K27me3 is linked to genotoxic stress and defective growth. Proc Natl Acad Sci 112: E6339–E6348. [DOI] [PMC free article] [PubMed] [Google Scholar]
- Broccoli D, Chong L, Oelmann S, Fernald AA, Marziliano N, van Steensel B, Kipling D, Le Beau MM, de Lange T. 1997. Comparison of the human and mouse genes encoding the telomeric protein, TRF1: chromosomal localization, expression and conserved protein domains. Hum Mol Genet 6: 69–76. [DOI] [PubMed] [Google Scholar]
- Colot HV, Park G, Turner GE, Ringelberg C, Crew CM, Litvinkova L, Weiss RL, Borkovich KA, Dunlap JC. 2006. A high-throughput gene knockout procedure for Neurospora reveals functions for multiple transcription factors. Proc Natl Acad Sci 103: 10352–10357. [DOI] [PMC free article] [PubMed] [Google Scholar]
- Connolly LR, Smith KM, Freitag M. 2013. The Fusarium graminearum histone H3 K27 methyltransferase KMT6 regulates development and expression of secondary metabolite gene clusters. PLoS Genet 9: e1003916. [DOI] [PMC free article] [PubMed] [Google Scholar]
- Cremer T, Cremer C. 2001. Chromosome territories, nuclear architecture and gene regulation in mammalian cells. Nat Rev Genet 2: 292–301. [DOI] [PubMed] [Google Scholar]
- Cremer T, Cremer M. 2010. Chromosome territories. Cold Spring Harb Perspect Biol 2: a003889. [DOI] [PMC free article] [PubMed] [Google Scholar]
- Dekker J, Marti-Renom MA, Mirny LA. 2013. Exploring the three-dimensional organization of genomes: interpreting chromatin interaction data. Nat Rev Genet 14: 390–403. [DOI] [PMC free article] [PubMed] [Google Scholar]
- Duan Z, Andronescu M, Schutz K, McIlwain S, Kim YJ, Lee C, Shendure J, Fields S, Blau CA, Noble WS. 2010. A three-dimensional model of the yeast genome. Nature 465: 363–367. [DOI] [PMC free article] [PubMed] [Google Scholar]
- Eagen KP, Hartl TA, Kornberg RD. 2015. Stable chromosome condensation revealed by chromosome conformation capture. Cell 163: 934–946. [DOI] [PMC free article] [PubMed] [Google Scholar]
- Elgin SC, Reuter G. 2013. Position-effect variegation, heterochromatin formation, and gene silencing in Drosophila. Cold Spring Harb Perspect Biol 5: a017780. [DOI] [PMC free article] [PubMed] [Google Scholar]
- Feng S, Cokus SJ, Schubert V, Zhai J, Pellegrini M, Jacobsen SE. 2014. Genome-wide Hi-C analyses in wild-type and mutants reveal high-resolution chromatin interactions in Arabidopsis. Mol Cell 55: 694–707. [DOI] [PMC free article] [PubMed] [Google Scholar]
- Foss HM, Roberts CJ, Claeys KM, Selker EU. 1993. Abnormal chromosome behavior in Neurospora mutants defective in DNA methylation. Science 262: 1737–1741. [DOI] [PubMed] [Google Scholar]
- Freitag M, Hickey PC, Khlafallah TK, Read ND, Selker EU. 2004. HP1 is essential for DNA methylation in Neurospora. Mol Cell 13: 427–434. [DOI] [PubMed] [Google Scholar]
- Galagan JE, Calvo SE, Borkovich KA, Selker EU, Read ND, Jaffe D, FitzHugh W, Ma LJ, Smirnov S, Purcell S, et al. 2003. The genome sequence of the filamentous fungus Neurospora crassa. Nature 422: 859–868. [DOI] [PubMed] [Google Scholar]
- Goldfarb DS, Corbett AH, Mason DA, Harreman MT, Adam SA. 2004. Importin α: a multipurpose nuclear-transport receptor. Trends Cell Biol 14: 505–514. [DOI] [PubMed] [Google Scholar]
- Gorlich D, Mattaj I. 1996. Nucleocytoplasmic transport. Science 271: 1513–1518. [DOI] [PubMed] [Google Scholar]
- Grossniklaus U, Paro R. 2014. Transcriptional silencing by Polycomb-group proteins. Cold Spring Harb Perspect Biol 6: a019331. [DOI] [PMC free article] [PubMed] [Google Scholar]
- Hachet V, Köcher T, Wilm M, Mattaj I. 2004. Importin α associates with membranes and participates in nuclear envelope assembly in vitro. EMBO J 23: 1526–1535. [DOI] [PMC free article] [PubMed] [Google Scholar]
- Heard E. 2005. Delving into the diversity of facultative heterochromatin: the epigenetics of the inactive X chromosome. Curr Opin Genet Dev 15: 482–489. [DOI] [PubMed] [Google Scholar]
- Hediger F, Neumann FR, Van Houwe G, Dubrana K, Gasser SM. 2002. Live imaging of telomeres: yKu and Sir proteins define redundant telomere-anchoring pathways in yeast. Curr Biol 12: 2076–2089. [DOI] [PubMed] [Google Scholar]
- Honda S, Selker EU. 2008. Direct interaction between DNA methyltransferase DIM-2 and HP1 is required for DNA methylation in Neurospora crassa. Mol Cell Biol 28: 6044–6055. [DOI] [PMC free article] [PubMed] [Google Scholar]
- Honda S, Lewis ZA, Huarte M, Cho LY, David LL, Shi Y, Selker EU. 2010. The DMM complex prevents spreading of DNA methylation from transposons to nearby genes in Neurospora crassa. Genes Dev 24: 443–454. [DOI] [PMC free article] [PubMed] [Google Scholar]
- Honda S, Lewis ZA, Shimada K, Fischle W, Sack R, Selker EU. 2012. Heterochromatin protein 1 forms distinct complexes to direct histone deacetylation and DNA methylation. Nat Struct Mol Biol 19: 471–477. [DOI] [PMC free article] [PubMed] [Google Scholar]
- Hou C, Li L, Qin ZS, Corces VG. 2012. Gene density, transcription, and insulators contribute to the partition of the Drosophila genome into physical domains. Mol Cell 48: 471–484. [DOI] [PMC free article] [PubMed] [Google Scholar]
- Imakaev M, Fudenberg G, McCord RP, Naumova N, Goloborodko A, Lajoie BR, Dekker J, Mirny LA. 2012. Iterative correction of Hi-C data reveals hallmarks of chromosome organization. Nat Methods 9: 999–1003. [DOI] [PMC free article] [PubMed] [Google Scholar]
- Jamieson K, Rountree MR, Lewis ZA, Stajich JE, Selker EU. 2013. Regional control of histone H3 lysine 27 methylation in Neurospora. Proc Natl Acad Sci 110: 6027–6032. [DOI] [PMC free article] [PubMed] [Google Scholar]
- Jamieson K, Wiles ET, McNaught KJ, Sidoli S, Leggett N, Shao Y, Garcia BA, Selker EU. 2015. Loss of HP1 causes depletion of H3K27me3 from facultative heterochromatin and gain of H3K27me2 at constitutive heterochromatin. Genome Res 26: 97–107. [DOI] [PMC free article] [PubMed] [Google Scholar]
- Jin F, Li Y, Dixon JR, Selvaraj S, Ye Z, Lee AY, Yen CA, Schmitt AD, Espinoza CA, Ren B. 2013. A high-resolution map of the three-dimensional chromatin interactome in human cells. Nature 503: 290–294. [DOI] [PMC free article] [PubMed] [Google Scholar]
- Klocko AD, Rountree MR, Grisafi PL, Hays SM, Adhvaryu KK, Selker EU. 2015. Neurospora importin α is required for normal heterochromatic formation and DNA methylation. PLoS Genet 11: e1005083. [DOI] [PMC free article] [PubMed] [Google Scholar]
- Krzywinski M, Schein J, Birol I, Connors J, Gascoyne R, Horsman D, Jones SJ, Marra MA. 2009. Circos: an information aesthetic for comparative genomics. Genome Res 19: 1639–1645. [DOI] [PMC free article] [PubMed] [Google Scholar]
- Levy DL, Heald R. 2010. Nuclear size is regulated by importin α and Ntf2 in Xenopus. Cell 143: 288–298. [DOI] [PMC free article] [PubMed] [Google Scholar]
- Lewis ZA, Honda S, Khlafallah TK, Jeffress JK, Freitag M, Mohn F, Schübeler D, Selker EU. 2008. Relics of repeat-induced point mutation direct heterochromatin formation in Neurospora crassa. Genome Res 19: 427–437. [DOI] [PMC free article] [PubMed] [Google Scholar]
- Lewis ZA, Adhvaryu KK, Honda S, Shiver AL, Knip M, Sack R, Selker EU. 2010a. DNA methylation and normal chromosome behavior in Neurospora depend on five components of a histone methyltransferase complex, DCDC. PLoS Genet 6: e1001196. [DOI] [PMC free article] [PubMed] [Google Scholar]
- Lewis ZA, Adhvaryu KK, Honda S, Shiver AL, Selker EU. 2010b. Identification of DIM-7, a protein required to target the DIM-5 H3 methyltransferase to chromatin. Proc Natl Acad Sci 107: 8310–8315. [DOI] [PMC free article] [PubMed] [Google Scholar]
- Li Y, Danzer JR, Alvarez P, Belmont AS, Wallrath LL. 2003. Effects of tethering HP1 to euchromatic regions of the Drosophila genome. Development 130: 1817–1824. [DOI] [PubMed] [Google Scholar]
- Lieberman-Aiden E, van Berkum NL, Williams L, Imakaev M, Ragoczy T, Telling A, Amit I, Lajoie BR, Sabo PJ, Dorschner MO, et al. 2009. Comprehensive mapping of long-range interactions reveals folding principles of the human genome. Science 326: 289–293. [DOI] [PMC free article] [PubMed] [Google Scholar]
- Meister P, Gehlen LR, Varela E, Kalck V, Gasser SM. 2010. Visualizing yeast chromosomes and nuclear architecture. Methods Enzymol 470: 535–567. [DOI] [PubMed] [Google Scholar]
- Mizuguchi T, Fudenberg G, Mehta S, Belton JM, Taneja N, Folco HD, FitzGerald P, Dekker J, Mirny L, Barrowman J, et al. 2014. Cohesin-dependent globules and heterochromatin shape 3D genome architecture in S. pombe. Nature 516: 432–435. [DOI] [PMC free article] [PubMed] [Google Scholar]
- Moissiard G, Cokus SJ, Cary J, Feng S, Billi AC, Stroud H, Husmann D, Zhan Y, Lajoie BR, McCord RP, et al. 2012. MORC family ATPases required for heterochromatin condensation and gene silencing. Science 336: 1448–1451. [DOI] [PMC free article] [PubMed] [Google Scholar]
- Nagano T, Lubling Y, Stevens TJ, Schoenfelder S, Yaffe E, Dean W, Laue ED, Tanay A, Fraser P. 2013. Single-cell Hi-C reveals cell-to-cell variability in chromosome structure. Nature 502: 59–64. [DOI] [PMC free article] [PubMed] [Google Scholar]
- Naumova N, Imakaev M, Fudenberg G, Zhan Y, Lajoie BR, Mirny LA, Dekker J. 2013. Organization of the mitotic chromosome. Science 342: 948–953. [DOI] [PMC free article] [PubMed] [Google Scholar]
- Nielsen PR, Nietlispach D, Mott HR, Callaghan J, Bannister A, Kouzarides T, Murzin AG, Murzina NV, Laue ED. 2002. Structure of the HP1 chromodomain bound to histone H3 methylated at lysine 9. Nature 416: 103–107. [DOI] [PubMed] [Google Scholar]
- Nora EP, Lajoie BR, Schulz EG, Giorgetti L, Okamoto I, Servant N, Piolot T, van Berkum NL, Meisig J, Sedat J, et al. 2012. Spatial partitioning of the regulatory landscape of the X-inactivation centre. Nature 485: 381–385. [DOI] [PMC free article] [PubMed] [Google Scholar]
- Rao SS, Huntley MH, Dur NC, Stamenova EK, Bochkov ID, Robinson JT, Sanborn AL, Machol I, Omer AD, Lander ES, et al. 2014. A 3D map of the human genome at kilobase resolution reveals principles of chromatin looping. Cell 159: 1665–1680. [DOI] [PMC free article] [PubMed] [Google Scholar]
- Sexton T, Yaffe E, Kenigsberg E, Bantignies F, Leblanc B, Hoichman M, Parrinello H, Tanay A, Cavalli G. 2012. Three-dimensional folding and functional organization principles of the Drosophila genome. Cell 148: 458–472. [DOI] [PubMed] [Google Scholar]
- Smith KM, Phatale PA, Sullivan CM, Pomraning KR, Freitag M. 2011. Heterochromatin is required for normal distribution of Neurospora crassa CenH3. Mol Cell Biol 31: 2528–2542. [DOI] [PMC free article] [PubMed] [Google Scholar]
- Smith KM, Galazka JM, Phatale PA, Connolly LR, Freitag M. 2012. Centromeres of filamentous fungi. Chromosome Res 20: 635–656. [DOI] [PMC free article] [PubMed] [Google Scholar]
- Tachibana M, Sugimoto K, Nozaki M, Ueda J, Ohta T, Ohki M, Fukuda M, Takeda N, Niida H, Kato H, et al. 2002. G9a histone methyltransferase plays a dominant role in euchromatic histone H3 lysine 9 methylation and is essential for early embryogenesis. Genes Dev 16: 1779–1791. [DOI] [PMC free article] [PubMed] [Google Scholar]
- Taddei A, Hediger F, Neumann FR, Bauer C, Gasser SM. 2004. Separation of silencing from perinuclear anchoring functions in yeast Ku80, Sir4 and Esc1 proteins. EMBO J 23: 1301–1312. [DOI] [PMC free article] [PubMed] [Google Scholar]
- Taddei A, Van Houwe G, Hediger F, Kalck V, Cubizolles F, Schober H, Gasser SM. 2006. Nuclear pore association confers optimal expression levels for an inducible yeast gene. Nature 441: 774–778. [DOI] [PubMed] [Google Scholar]
- Tamaru H, Selker EU. 2001. A histone H3 methyltransferase controls DNA methylation in Neurospora crassa. Nature 414: 277–283. [DOI] [PubMed] [Google Scholar]
- Tamaru H, Zhang X, McMillen D, Singh PB, Nakayama JI, Grewal SI, Allis CD, Cheng X, Selker EU. 2003. Trimethylated lysine 9 of histone H3 is a mark for DNA methylation in Neurospora crassa. Nat Genet 34: 75–79. [DOI] [PubMed] [Google Scholar]
- Taricani L, Tejada ML, Young PG. 2001. The fission yeast ES2 homologue, Bis1, interacts with the Ish1 stress-responsive nuclear envelope protein. J Biol Chem 277: 10562–10572. [DOI] [PubMed] [Google Scholar]
- Wang C, Liu C, Roqueiro D, Grimm D, Schwab R, Becker C, Lanz C, Weigel D. 2015. Genome-wide analysis of local chromatin packing in Arabidopsis thaliana. Genome Res 25: 246–256. [DOI] [PMC free article] [PubMed] [Google Scholar]
- Wutz A. 2011. Gene silencing in X-chromosome inactivation: advances in understanding facultative heterochromatin formation. Nat Rev Genet 12: 542–553. [DOI] [PubMed] [Google Scholar]