

Abstract
Polyploidization events such as whole-genome duplication and inter-species hybridization are major evolutionary forces that shape genomes. Although long-term effects of polyploidization have been well-characterized, early molecular evolutionary consequences of polyploidization remain largely unexplored. Here, we report the discovery of two recent and independent genome hybridizations within a single clade of a fungal genus, Trichosporon. Comparative genomic analyses revealed that redundant genes are experiencing decelerations, not accelerations, of evolutionary rates. We identified a relationship between gene conversion and decelerated evolution suggesting that gene conversion may improve the genome stability of young hybrids by restricting gene functional divergences. Furthermore, we detected large-scale gene losses from transcriptional and translational machineries that indicate a global compensatory mechanism against increased gene dosages. Overall, our findings illustrate counteracting mechanisms during an early phase of post-genome hybridization and fill a critical gap in existing theories on genome evolution.
Polyploidization events such as whole-genome duplication (WGD) and inter-species hybridization are major evolutionary forces that shape eukaryotic genomes (Dehal and Boore 2005; Scannell et al. 2007; Sémon and Wolfe 2007; Jaillon et al. 2009; Van de Peer et al. 2009). Ohno (1970) proposed an important theory that explains the enhanced evolutionary capability of polyploid genomes, stating that the emergence of functionally redundant genes would relax their evolutionary constraints and accelerate divergent evolution of their functions. This theory has been confirmed in a wide range of eukaryotes from ancient Vertebrata (Brunet et al. 2006), Saccharomycetaceae fungi (Kellis et al. 2004; Byrne and Wolfe 2007), Paramecia (McGrath et al. 2014), and Brassicaceae plants (Arabidopsis Genome Initiative 2000; Vision et al. 2000). Nonetheless, although these studies established long-term benefits of polyploidization, early consequences and mechanisms of polyploidization remain largely unexplored.
Genome hybridization, in contrast to WGD, which is a rare event, is estimated to occur in >25% of plant and 10% of animal species (Mallet 2005) and generally involves younger species. In fungi, a multitude of hybrids have given rise to species that are instrumental in industrial fermentation and critical plant and animal pathogens. Furthermore, in addition to the issue of globally increased gene dosage that is common between WGD and genome hybridization, a hybrid species has to resolve the issue of incompatible genes and proteins encoded by its two parental genomes. Recent analyses of several fungal hybrids have revealed mechanisms such as extensive loss of heterozygosity (Li et al. 2012; Louis et al. 2012; Stukenbrock et al. 2012) and gene expression reprogramming (Tirosh et al. 2009) that may help hybrid genomes stabilize. Gene conversion, which is capable of homogenizing redundant paralogs (Takuno et al. 2008; McGrath et al. 2014), can also play a role in resolving incompatibility between the two parental genomes of a hybrid. Despite these discoveries, to gain further insights into molecular consequences of post-polyploidization evolution, a comprehensive data set that permits comparisons between closely related polyploid and nonpolyploid genomes is absolutely critical.
Here, we report a discovery of two recent inter-species hybridization events within the genus Trichosporon of Basidiomycota fungi, which contains many agriculturally important and pathogenic yeasts (Kurtzman et al. 2011). Although primarily asexual, Trichosporonaceae likely possess sexual cycles (O'Gorman et al. 2009), and a possible basal member of this order has been shown as such (McLaughlin and Spatafora 2014). Their genome data enabled in-depth analyses of the early genome evolutionary processes following the two independent hybridization events.
Results
Recent and independent genome hybridizations in Trichosporon yeasts
We sequenced the genomes of Trichosporon coremiiforme, T. faecale, T. inkin, and T. ovoides and downloaded that of T. asahii strain CBS2479 (Supplemental Table S1; Yang et al. 2012). The genome sizes of T. coremiiforme and T. ovoides (40–42 Mb) relative to those of closely related T. asahii, T. faecale, and T. inkin (20–25 Mb) suggested that these two species experienced recent genome expansions. Although some basidiomycetous fungi are able to enter dikaryotic states, no dikaryons were detected via fluorescent microscopy (Supplemental Fig. S1). Gene orthology analysis revealed that ∼70% of ortholog groups in T. coremiiforme (4472 of 6260 groups) and T. ovoides (3932 of 5657 groups) each consists of two homeologs (paralogs resulting from polyploidization). Most importantly, we were able to reconstruct extensive syntenic alignments between 74% of T. coremiiforme genes and 89% of T. asahii genes and between 79% of T. ovoides genes and 98% of T. inkin genes (Supplemental Fig. S2), which altogether constituted convincing evidence that the larger genomes resulted from polyploidizations.
To determine the type of the two polyploidization events (self-duplication or inter-species hybridization), we reconstructed the two subgenomes in each of T. coremiiforme and T. ovoides and characterized their phylogenetic histories relative to other Trichosporon species. For simplicity, we named the two subgenomes A and B, with subgenome A representing the one that is evolutionarily closer to the reference nonpolyploid genomes (T. asahii for T. coremiiforme and T. inkin for T. ovoides). For T. ovoides, a homeolog copy whose sequence is more identical to that of the ortholog in T. inkin was assigned to subgenome A and the other homeolog copy was assigned to subgenome B. This produced an assignment that is >93% consistent with the scaffold structure in all but three scaffolds and identified possible large-scaled recombination events in the remaining three scaffolds (Methods). The same method was not applicable for T. coremiiforme because of high sequence identity between its subgenomes: With T. asahii as reference, T. coremiiforme subgenomes differ by <1% in terms of amino acid sequence identity level. Therefore, we instead used doubly conserved synteny structures in T. coremiiforme to identify homeologous scaffolds and assign each scaffold as a whole to a subgenome (Methods). Phylogenetic reconstructions by both maximum likelihood and maximum parsimony methods yielded a consistent tree with 100% bootstrap support for all branching points and revealed that both T. coremiiforme and T. ovoides are inter-species hybrids with independent origins (Fig. 1A). Using the well-characterized WGD in Saccharomycetaceae (Kellis et al. 2004; Scannell et al. 2006) as a calibration point, the difference in sequence divergence levels across the hybrid subgenomes (dS = 0.6753 for T. coremiiforme and 1.3763 for T. ovoides) and across the post-WGD genomes (dS = 8.2356) suggested that the Trichosporon hybridization events are at least six to 12 times more recent (Fig. 1B). These estimates correspond well with the much higher retention rates of two-copy homeologs in T. coremiiforme and T. ovoides (>70%, compared to <15% in S. cerevisiae).
Figure 1.
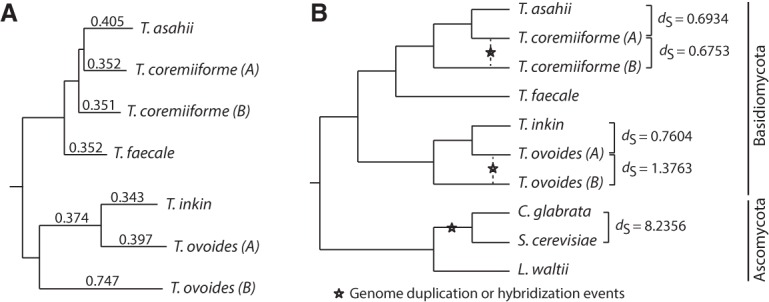
Recent hybridization events in T. coremiiforme and T. ovoides. (A) Phylogenetic tree reconstructed from more than 3000 gene ortholog groups that are present in all nonpolyploid Trichosporon genomes and remain two-copy in either T. coremiiforme or T. ovoides. Subgenome assignments (A and B) were made from (1) gene homeologous relationships, (2) sequence identities to nonhybrid orthologs, and (3) phylogenetic analyses. Subgenome A represents the one that is evolutionarily closer to either T. asahii in the case of T. coremiiforme or T. inkin in the case of T. ovoides. Sequences of genes belonging to each subgenome or genome were concatenated together and used to estimate the average substitution rates. Branch lengths are proportional to the synonymous substitution rates (dS) which are also indicated as branch labels. (B) Phylogenetic relationship between Trichosporon and selected Ascomycota fungi. Pairwise dS estimations were derived based on 822 gene ortholog groups that are present in all species and remain two-copy in both T. coremiiforme and T. ovoides (a total of 10 orthologous/homeologous genes per group). These estimates suggest that the hybridization events in Trichosporon are at least six to 12 times more recent that the genome duplication event in the Saccharomycetaceae lineage.
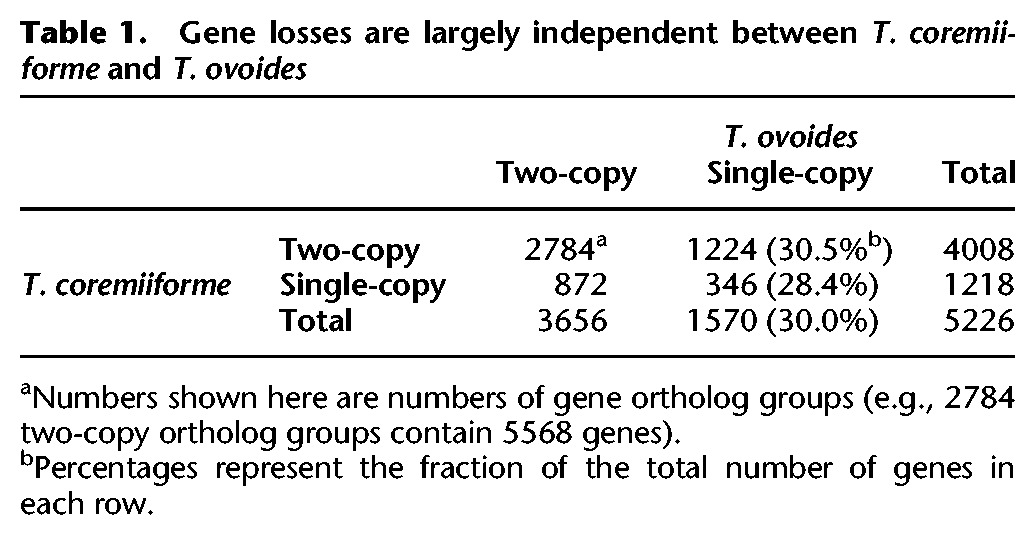
Losses of genes belonging to transcription and translation machineries
The gene-loss patterns after the two hybridization events are largely independent at the individual gene level. Regardless of whether a homeolog pair is retained as two-copy in T. coremiiforme, its gene-loss rate is consistently ∼30% in T. ovoides (Table 1), although these species are closely related and each gene-loss event might convey similar changes in fitness potentials. When mapped onto an S. cerevisiae protein complex data set (Pu et al. 2009), of 192 complexes, 27 and 44 complexes experienced multiple gene losses in T. coremiiforme and T. ovoides, respectively, with 14 complexes in common. A considerable number of transcription and translation machineries are found among these complexes (Supplemental Tables S2, S3), and they generally experience higher loss rates of their component genes than other protein complexes. In T. coremiiforme, the overall gene-loss rate among protein complexes involved with transcription and translation (43 of 192 complexes) is 33% and is significantly higher than that among other complexes (21%, permutation test P-value <1 × 10⁻⁵). A modest but similar trend was observed in T. ovoides (28% for complexes involved with transcription and translation and 26% for other complexes, permutation test P-value = 0.301). Cytoplasmic ribosomal proteins, in particular, lost a copy of 27 of 55 genes in T. coremiiforme and 16 of 59 genes in T. ovoides (Supplemental Table S4). If stoichiometry constraint—a pressure to maintain dosage balance between interacting proteins—is the driving force behind the elevated gene-loss rates in protein complexes involved with transcription and translation, gene-loss events will be concentrated among interaction partners of single-copy genes, where stoichiometry is disrupted. However, permutation tests on the protein–protein interaction networks involving these complexes revealed that this is not the case (Methods). Also, there is no difference in the levels of background sequence conservation (represented by the sequence identity level between nonhybrid orthologs in T. asahii and T. faecale) between ribosomal proteins that remain two-copy and those that have lost a copy (Mann-Whitney U test, P-value = 0.7478). Therefore, extensive losses of transcriptional and translational machineries may instead indicate a mechanism to alleviate unfavorable effects of global gene and protein overexpression caused by increased gene dosages.
Table 1.
Gene losses are largely independent between T. coremiiforme and T. ovoides
Different levels of subgenome divergences and dominances in the two hybrids
The existence of two independent hybridization events among closely related Trichosporon fungi gives us a unique opportunity to compare and contrast evolutionary consequences of hybrid genomes in these lineages. As evident from the reconstructed phylogenetic relationship, evolutionary distance between T. ovoides' subgenomes is greater than that between those of T. coremiiforme (Fig. 1A). At amino acid sequence level, T. ovoides' subgenomes are 84.7% identical, whereas T. ovoides' subgenome A and T. inkin's genome are 91.2% identical (Fig. 2A). On the other hand, amino acid sequence identity levels between the T. coremiiforme's subgenomes and T. asahii's genome are largely the same at 92%–93% (Fig. 2A), indicating a degree of resemblance between the genome hybridization in T. coremiiforme and a WGD. Such differences in subgenome divergences in T. coremiiforme and T. ovoides can have a profound influence on the gene-loss patterns in these hybrids, particularly because more diverged subgenomes likely produce more incompatible protein complexes and interactions. Indeed, we identified a strong gene-loss bias in T. ovoides (70% of gene-loss events occurred on subgenome B, binomial test P-value = 1.9 × 10−44) in contrast to a balanced gene-loss distribution in T. coremiiforme (46% of gene-loss events occurred on subgenome B) (Fig. 2B). These results were derived exclusively from gene-loss events that occurred inside doubly conserved synteny structures so as to minimize the impact of genome sequencing, assembly, and subgenome assignment qualities; the higher number of gene-loss events for T. ovoides directly resulted from higher coverage of the doubly conserved synteny structures on its genome. Losses of genes belonging to cytoplasmic ribosomal large and small subunits are also more biased in T. ovoides, with 10 of 13 or 77% loss on subgenome B (binomial test P-value = 0.0461), than in T. coremiiforme, with 10 of 16 or 62.5% loss on subgenome A (binomial test P-value = 0.2272) (Supplemental Table S4). In terms of evolutionary rates, as represented by the ratio of nonsynonymous to synonymous substitution rates (dN/dS), T. ovoides' subgenomes exhibit larger and more significant divergences than those of T. coremiiforme. The median dN/dS differences between homeologs from each subgenome is 7.4% in T. ovoides (paired Wilcoxon signed-rank test, P-value = 3.3 × 10⁻⁶) and 2.7% in T. coremiiforme (paired Wilcoxon signed-rank test, P-value = 0.01). These findings illustrate the larger discrepancy of post-hybridization evolutionary pressures on T. ovoides' subgenomes than on those of T. coremiiformes'.
Figure 2.
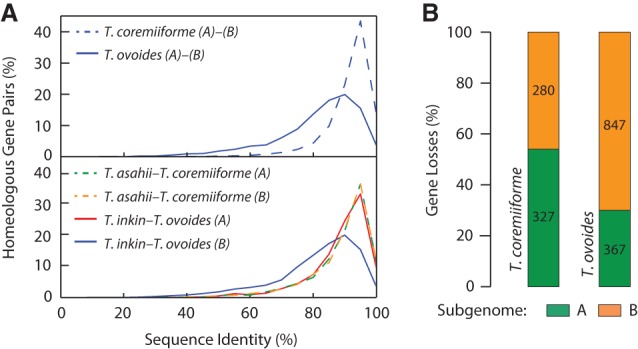
Considerable subgenome divergence in T. ovoides. (A) Distribution of amino acid sequence identity levels between homeologous genes from the two subgenomes of T. coremiiforme or T. ovoides (top) and between orthologous genes from T. coremiiforme and T. asahii or between those from T. ovoides and T. inkin (bottom). (B) Distribution of gene losses in T. coremiiforme and T. ovoides on each of their subgenomes. Only gene losses occurring inside doubly conserved synteny are included.
Global deceleration of evolutionary rates following genome hybridization
With the genome sequences of three closely related nonhybrid Trichosporon species, we quantitatively probed the impact of recent hybridization on gene evolutionary rates. Since genome hybridization is expected to relax gene evolutionary constraint, the evolutionary rates of redundant genes in the two hybrids would be higher than those of their counterparts in nonhybrid species. We defined the background evolutionary rate of each T. coremiiforme gene as the weighted average dN/dS of its orthologs in T. asahii and T. faecale (with the synonymous substitution rates dS as weights) and the background evolutionary rate of each T. ovoides gene as the dN/dS of its ortholog in T. inkin (Fig. 3A). We then calculated the fold differences between the dN/dS of genes in the two hybrids and the corresponding background dN/dS and classified these genes as either evolutionarily accelerated, neutral, or decelerated at a twofold threshold. This revealed that decelerated homeolog pairs—those whose evolutionary rates decreased after hybridization—significantly outnumber accelerated homeolog pairs (binomial test P-value = 0.0052 in T. coremiiforme and 2.24 × 10⁻⁵ in T. ovoides) (Fig. 3B). These observations were stable upon changing the fold-change threshold for calling genes as accelerated, neutral, or decelerated. Furthermore, we identified significant overlaps between evolutionarily decelerated homeolog pairs in the two hybrids, which indicate that deceleration of evolutionary rates may be a systematic response in early post-hybridization genomes (Fig. 3C). The absence of any significant enrichment for acceleration or deceleration of evolutionary rates among single-copy genes suggests that the involved mechanisms operate exclusively on redundant homeologs (Supplemental Fig. S3).
Figure 3.
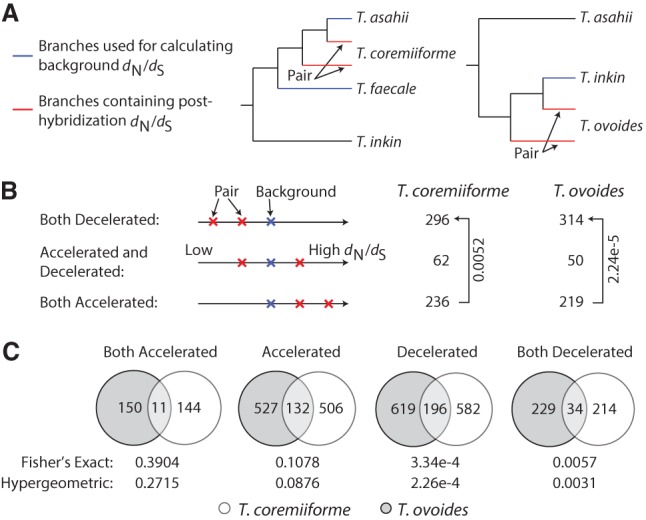
Deceleration of evolutionary rates following genome hybridization. (A) Diagram illustrating how background dN/dS are defined. Background dN/dS are calculated as the weighted average of dN/dS on the phylogenetic tree branches leading to nonpolyploid species (blue branches, weighted by branch dS). dN/dS ratios are then calculated as the ratio of dN/dS of the branches leading to hybrid species (red branches) over the background dN/dS. (B) The number of homeologous gene pairs with varying patterns of acceleration or deceleration in evolutionary rates. The threshold for calling genes as evolutionarily accelerated or decelerated is ±twofold in dN/dS ratio. Arrows and labels indicate the directions of enrichment and the binomial test P-values (under the null hypothesis that a gene pair is equally likely to become evolutionarily accelerated or decelerated). (C) Overlap of evolutionarily accelerated and decelerated homeologous gene pairs between the two hybridization events. The “accelerated” group consists of accelerated/accelerated and accelerated/neutral pairs. The “decelerated” group consists of decelerated/decelerated and decelerated/neutral pairs. The number of gene pairs in each species and the overlap size are shown. Fisher's exact test and hypergeometric test P-values are indicated below each comparison.
In general, decelerated gene evolution can be due to strengthened negative selection. If this is the case, redundant genes that are more evolutionarily decelerated might be enriched for those that have specific functions or high numbers of protein interaction partners. However, we did not observe any significant relationship between the decelerated genes and gene ontology annotations or numbers of protein interaction partners (S. cerevisiae gene annotation and protein–protein interaction data sets were used) (Methods). An alternative explanation could be that gene conversion—a mechanism capable of preserving and homogenizing homeolog sequences and functions (Takuno et al. 2008; McGrath et al. 2014)—removed nonsynonymous mutations from these genes. Because gene conversions create long identical sequence tracts between homeologs, we utilized these signatures to probe for evidence of gene conversions among hybrid homeologs (Methods). In T. ovoides, homeologs that had likely undergone gene conversions exhibited a significant degree of decelerated evolutionary rates compared to those that had not (Mann-Whitney U test, P-value = 3 × 10⁻⁴) (Supplemental Figs. S4, S5). Furthermore, we observed a threefold enrichment in the number of T. ovoides homeolog pairs that have lower sequence divergence between themselves than to their orthologous counterparts in T. inkin when only decelerated homeologs were considered (5.5% among all gene pairs versus 17.7% among decelerated homeologs) (Supplemental Fig. S4). Given that T. ovoides' subgenome A is evolutionarily much closer to T. inkin than to subgenome B (Fig. 1A), strengthened negative selection pressure alone cannot explain such enrichment. In T. coremiiforme, we detected a weaker relationship between gene conversions and decelerated evolutionary rates. This may be due to higher intrinsic levels of sequence identity between T. coremiiforme homeologs masking the evidence of gene conversion.
Convergent changes in evolutionary rates among homeolog pairs
Another curious observation was the lack of homeolog pairs with divergent changes in evolutionary rates—i.e., the pair whose one gene becomes evolutionarily accelerated, whereas the other becomes decelerated (Fig. 3B). We observed unique and consistent enrichments of homeologous genes with convergent directions of change in evolutionary rates (2.6–2.8 fold enrichments, Fisher's exact test, P-values <4.4 × 10−60 in all cases) (Fig. 4A; Methods) that are in contrast with the classical evolutionary scenario in which one homeolog copy remains under evolutionary pressure to maintain its function, whereas the other becomes less constrained. Quantitatively, homeologous genes in each hybrid exhibit significant positive correlations in their post-hybridization evolutionary rate changes (Pearson's correlation coefficient = 0.4880 in T. coremiiforme and 0.6267 in T. ovoides, permutation test P-values <0.0001) (Fig. 4B). Because these analyses were based on the changes in evolutionary rate following genome hybridization, no correlation should be expected if each homeologous gene evolves independently. Importantly, the lack of such strong positive correlations between nonhybrid T. asahii and T. faecale orthologs (Pearson's correlation coefficient = 0.1937) clearly indicates that the background evolutionary closeness between T. ovoides' and T. coremiiforme's subgenomes cannot account for these findings.
Figure 4.
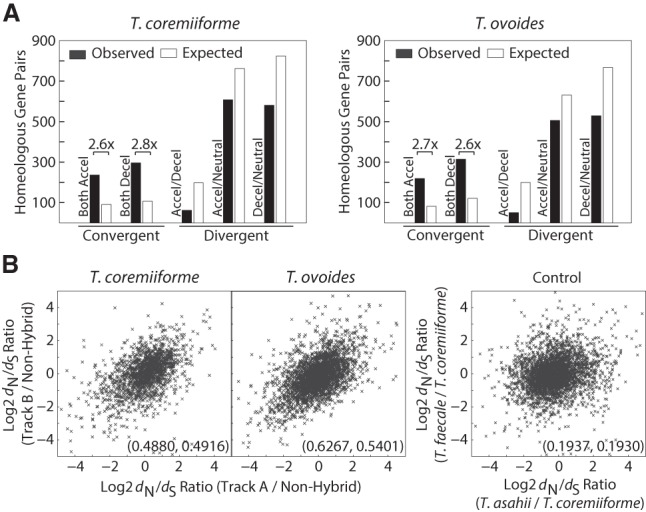
Convergent changes in evolutionary rates among hybrid homeologs. (A) Bar plots showing the enrichment of homeologous gene pairs with varying patterns of changes in evolutionary rates. The number of expected gene pairs in each class is based on the global frequency of accelerated/neutral/decelerated genes and the assumption that each gene of a homeologous pair independently became accelerated/neutral/decelerated. Only gene pairs with convergent changes (both accelerated or both decelerated) are enriched. Numbers followed by multiplication signs indicate the fold differences in gene pairs between observed and expected. (B) Scatterplots showing the correlation between dN/dS ratios of homeologous genes. Numbers in the parentheses indicate Pearson's and Spearman's correlation coefficients in that order. Control data set was created from the dN/dS ratio between T. asahii, T. faecale, and T. coremiiforme (average between subgenome A and B) as indicated. This represents the background level of correlation in evolutionary rate changes across closely related genomes but outside the context of hybridization.
Finally, we turned our attention to homeolog pairs in which both gene copies became evolutionarily accelerated. Levels of amino acid sequence conservation of accelerated homeolog pairs are significantly higher than those of others with a median of 96% average sequence identity among T. asahii, T. faecale, and T. coremiiforme, and a median of 93% between T. inkin and T. ovoides (Mann-Whitney U test, P-value = 6.3 ×10⁻¹⁰ for T. coremiiforme and 2.7 × 10⁻¹⁵ for T. ovoides) (Fig. 5A). Also, analyses of evolutionary rates show that accelerated homeologs are not evolving faster than nonaccelerated homeologs in the hybrid genomes, but that the key differences lie in their background evolutionary rates (Fig. 5B). A plausible explanation might be that conserved genes with low background evolutionary rates can tolerate larger increases in evolutionary rates (i.e., become evolutionarily accelerated) while maintaining functional integrity.
Figure 5.
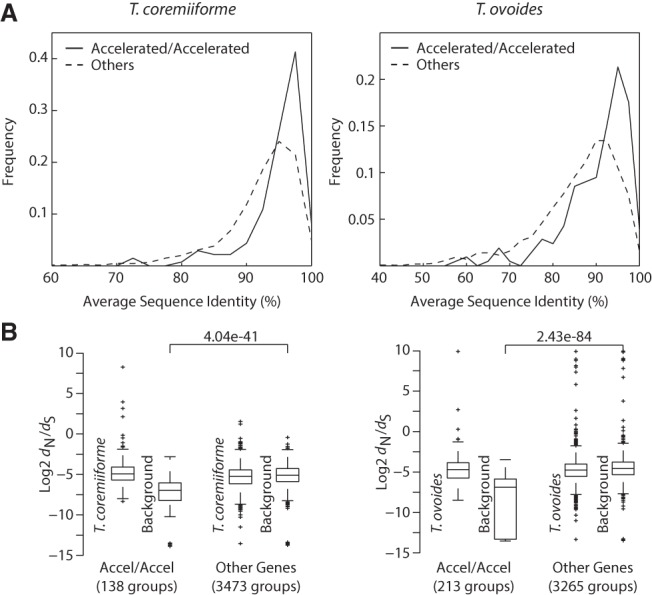
Accelerated evolution of highly conserved genes. (A) Distributions of average amino acid sequence identities taken over all pairwise comparison of genes from species surrounding each hybrid species, i.e., T. coremiiforme–T. asahii–T. faecale gene group or T. ovoides–T. inkin gene group. The comparisons are between gene ortholog groups that became evolutionarily accelerated following a hybridization event (gene groups that are present as two-copy in a hybrid species and both gene copies exhibit acceleration in evolutionary rates) and those that did not (other two-copy genes). Genes with accelerated evolutionary rates are enriched for highly conserved genes. (B) Box plots comparing dN/dS values of hybrid two-copy genes to their corresponding background. The whiskers cover ∼99.3% of the distribution. Data for the evolutionarily accelerated gene group and the rest of the genome are shown. Mann-Whitney U test P-values between the background groups are indicated: (left) T. coremiiforme with the weighted average of T. asahii and T. faecale genes as background; (right) T. ovoides genes with T. inkin genes as background.
Discussion
Here, we identified and characterized two recent and independent genome hybridization events in the Trichosporon genus of Basidiomycota fungi, in which different levels of subgenome divergence impact the degrees of subgenome dominance (Fig. 2). Frequent gene losses among transcriptional and translational machineries were observed in both hybrids (Supplemental Tables S2, S3). Although stoichiometric constraint could also explain high gene-loss rates among protein complex subunits, the lack of enrichment of gene losses between direct protein–protein interaction partners makes this hypothesis unlikely. Instead, because polyploidization introduces a drastic increase in gene dosage that has to be resolved (Gout and Lynch 2015), these gene losses may occur under a common evolutionary pressure to rapidly neutralize global mRNA and protein overexpression. Because previous studies of WGD reported that slowly evolving genes such as ribosomal proteins tend to be retained in the long term (Davis and Petrov 2004; Brunet et al. 2006; McGrath et al. 2014), the opposite tendencies found here may reflect either differences between the early and late effects of polyploidization or those between WGD and genome hybridization. We assume that the former is more likely because T. coremiiforme is almost indistinguishable from a recent WGD, and the effect of increased genes dosages would be especially severe during the early phase of post-polyploidization. The uniparental gene losses of ribosomal subunit genes (Supplemental Fig. S4) are consistent with a previous study of a young Saccharomycetaceae hybrid (Louis et al. 2012), in which uniparental losses of ribosomal RNA genes were detected. These observations may indicate a mechanism similar to nucleolar dominance, in which a hybrid genome epigenetically silences one parental set of ribosomal RNA genes. Furthermore, in addition to dosage reduction, early losses of specific ribosomal subunit paralogs can alter gene expression regulation and localization (Komili et al. 2007) and profoundly shape subsequent evolutionary landscapes.
In both Trichosporon hybrids, redundant homeologs exhibit consistent patterns of decelerated and correlated evolutionary rates (Figs. 3, 4), which indicates that homeologous genes in these hybrids share a significant degree of evolutionary homogeneity. Furthermore, a positive correlation between gene conversion and decelerated evolution (Supplemental Fig. S4) likely suggests a role of gene conversion in maintaining the functional integrity of redundant genes (Katju et al. 2008; Marais et al. 2010; Fawcett and Innan 2011). Although gene conversion often affects essential, highly constrained genes, we did not detect any significant difference in the levels of sequence conservation (represented by the sequence identity level between nonhybrid orthologs in T. asahii and T. faecale) between genes affected by gene conversion and those that were unaffected. This may be because these hybrid genomes are too young for the differences to show or because gene conversion in young hybrid genomes also plays a role in homogenizing incompatible genes. Although accelerated, divergent evolution of redundant homeologous genes following polyploidization may be advantageous for the resulting lineages, the same may not hold true for young hybrid genomes that are still unstable. Homogenization of homeologs would extend their lifetime until the genomes become stabilized (Takuno et al. 2008), consequently delaying subfunctionalization and neofunctionalization of redundant genes. Although some homeolog pairs became evolutionarily accelerated, they are restricted to highly conserved genes, and their evolutionary rates resemble those of other homeologs (Fig. 5). This suggests that these homeologs are actually under a similar degree of selective pressure as the genome averages and are not more evolutionarily relaxed.
In summary, we have illustrated key aspects of an early phase of post-hybridization genome evolution. Although it should be noted that a part of these mechanisms may be specific to the Trichosporon genus and there may be biases caused by imperfect genome sequences, assemblies, and gene ontology data sets, consistent findings were yielded for both T. coremiiforme and T. ovoides. Preservation of gene functions by deceleration and homogenization of homeolog evolutionary rates, and a global reduction of gene and protein expression by extensive gene losses from transcriptional and translation machineries, would be essential in stabilizing recently hybridized Trichosporon genomes. Accelerated and divergent evolution of homeologs—well-characterized hallmarks of post-polyploidization evolution—likely become dominant after the adverse effects of recent polyploidization have been resolved. Our findings not only establish Trichosporon yeasts as a model platform for interrogating early consequences of genome hybridization, but also highlight its multistage nature (Aury et al. 2006; Conant 2014), filling in a critical gap in the current understanding of eukaryotic genome evolution.
Methods
Genome sequencing and assembly
T. coremiiforme JCM 2938, T. ovoides JCM 9940, T. faecale JCM 2941, and T. inkin JCM 9195 strains were provided by the Japan Collection of Microorganisms at RIKEN BioResource Center. Culture and DNA extraction from freeze-dried cell masses were performed as described (Raeder and Broda 1985; Takashima and Nakase 2000). Genomic DNA was purified using Genomic-tip 100/G (Qiagen) according to the manufacturer's instructions. Paired-end DNA libraries with insert size of 200–300 bp were derived from 1 µg genomic DNA followed by fragmentation with an S2 ultrasonicator (Covaris) and sequencing with Illumina HiSeq 2500 (Illumina). Mate pair libraries with insert size of ∼3 kb were prepared with Nextera Mate Pair Sample Prep Kit (Illumina) according to the manufacturer's protocol with some modifications (Park et al. 2013) and sequenced using HiSeq 2500 to generate 151-bp paired-end reads. For T. faecale, additional mate pair libraries with insert sizes of ∼5 and 8 kb were prepared and sequenced using MiSeq to produce 301-bp paired-end reads. All mate pair reads were processed with NextClip v0.8 (Leggett et al. 2014) to trim adapter sequences. Estimated sequencing depths range from 114× for T. coremiiforme to 419× for T. faecale. ALLPATHS-LG versions 52155 (for T. faecale and T. inkin) and 52488 (for T. coremiiforme and T. ovoides) (Gnerre et al. 2011) were used to assemble the reads into scaffolds with default parameters. Library generation, sequencing, and assembly were performed at the Genome Network Analysis Support Facility, RIKEN CLST (Yokohama, Japan). Assembly quality was assessed using CEGMA version 2.5 (Parra et al. 2009) and REAPR version 1.0.18 (Supplemental Table S1; Hunt et al. 2013). CEGMA was run with default parameters. REAPR analyses were performed using identical sets of reads that were used by ALLPATHS-LG. The smaltmap and pipeline modules were run with default parameters. The perfectfrombam module was run with the following parameters: min insert = 100, max insert = 500, repetitive max qual = 3, perfect min qual = 4, and perfect min alignment score = 150. For T. asahii, the published genome for strain CBS 2479 (Yang et al. 2012) was used. The genome sequence data was also used in a separate study that focuses on fungal systematics (Takashima et al. 2015).
Gene annotation
Protein-coding genes on each draft genome were predicted using GeneMark-ES version 2 (Ter-Hovhannisyan et al. 2008) with default settings. The hidden Markov model for GeneMark was first trained on T. asahii CBS 2479 genome and then applied to other genomes. Genes of all sizes were predicted, but only those that translate to at least 100 amino acids in length were retained for further analyses. Performance of GeneMark was evaluated by two methods. First, we compared our prediction of T. asahii CBS 2479 genes to those included with the published genome. Overall, similar numbers of genes were predicted (7996 here versus 8068 published) with 7429 BLASTP matches with E-values <1 × 10⁻⁵ and 7000 matches with >80% amino acid sequence identity. Second, we compared the list of genes predicted by GeneMark to those made by AUGUSTUS version 2.5.5 (Stanke et al. 2008). The built-in gene structure model in AUGUSTUS that was trained with data from Cryptococcus neoformans, a Basidiomycota fungus in the same order as Trichosporonaceae, was used. Across T. faecale, T. coremiiforme, T. inkin, and T. ovoides, both methods generated similar lists of genes with 0.8%–8.8% differences in the numbers of genes predicted, 90%–92% BLASTP matches with >80% sequence identity, and 95%–97% BLASTP matches with E-values <1 × 10⁻⁵. Additionally, GeneMark produced slightly higher numbers of reciprocal best hits between Trichosporon and C. neoformans genes than AUGUSTUS did (54.68% of C. neoformans genes for AUGUSTUS and 55.85% for GeneMark).
Ortholog group assignment
Ortholog relationship assignments between Trichosporon species were first performed pairwise at the amino acid sequence level using inParanoid version 4.1 (Remm et al. 2001). Then, the results were merged into all-species ortholog groups using MultiParanoid (Alexeyenko et al. 2006). Ortholog groups containing one gene from T. asahii, at most one gene from T. inkin and T. faecale, and at most two genes from T. coremiiforme and T. ovoides were selected for further analyses. At this stage, a total of 7637 ortholog groups were obtained. Also, inParanoid was used to map orthologous relationships between genes from T. asahii, Saccharomyces cerevisiae, Candida glabrata, and Lachancea waltii. Protein sequences for C. neoformans, S. cerevisiae, C. glabrata, and L. waltii were downloaded from the National Center for Biotechnology Information (NCBI), the Saccharomyces Genome Database, the Candida Genome Database, and the Yeast Gene Order Browser database (http://ygob.ucd.ie/), respectively.
Synteny structure reconstruction
Synteny relationships between Trichosporon species were reconstructed by the aid of Gene Order Browser (GOB; source code provided by the author) (Byrne and Wolfe 2005). The list of predicted genes' ortholog group assignments were used as inputs for GOB. Gene order in T. asahii genome was used as reference for aligning T. faecale and T. coremiiforme genes, and gene order in T. inkin genome was used as reference for aligning T. ovoides genes. A syntenic segment was defined as a contiguous region of conserved gene orders on T. coremiiforme or T. ovoides genome with no larger than 20-kb gaps in between consecutive genes. An overlap between two syntenic segments was defined as doubly conserved syntenic segment (Kellis et al. 2004). Extensive synteny structures were identified for both T. asahii–T. coremiiforme and T. inkin–T. ovoides pairs, each involving >88% coverage of nonpolyploid and >73% of post-polyploid genomes (Supplemental Fig. S2). Because the 20-kb gap threshold corresponds roughly to the length of six to seven consecutive genes (based on Trichosporon genome statistics) and may cause underdetection of synteny breaks, we also reconstructed synteny structure using a tighter 10-kb gap threshold. As evident in Supplemental Figure S2, the genome coverages of synteny structure decreased by <1% in hybrid genomes and <5% in nonhybrid genomes. Hence, the impact of synteny break misidentification is minimal at the 20-kb gap threshold.
Subgenome assignment
Two subgenome reconstruction methods were considered. The first method is a synteny-based method that assumes that each assembled scaffold belongs to a subgenome. Doubly conserved synteny structures are used to define pairs of homeologous scaffolds, and subsequent phylogenetic analyses are used to assign each of the paired scaffolds into subgenomes. The second method is a reference genome–based method that relies on nonhybrid genomes as reference points (T. asahii for T. coremiiforme and T. inkin for T. ovoides). Each gene of a homeolog pair is assigned to one of the two subgenomes based on its sequence similarity to the nonhybrid ortholog.
For T. coremiiforme, the reference genome–based method produced an interspersed pattern of subgenome assignments, and so we investigated the level of sequence similarity between T. coremiiforme and T. asahii. Whole-genome alignments were performed using LAST version 658 (Kiełbasa et al. 2011) with T. asahii genomes as database and T. coremiiforme as query. Rareness limit for initial matches (-m parameter, default = 10) was set at 100 to increase sensitivity. E-score threshold of 1 × 10⁻¹⁰ was applied during post-processing of LAST's output. Only alignments that map one region from T. asahii genome to exactly two regions of lengths at least 1000 bases on different scaffolds in T. coremiiforme were considered. This revealed that two subgenomes of T. coremiiforme are almost equidistant from T. asahii with a median difference in sequence identities of only 0.97%—a likely reason behind the interspersed subgenome assignment pattern made by the reference genome–based method.
Hence, for T. coremiiforme, only the synteny-based method could to be used. To ensure high confidence, only doubly conserved synteny containing at least 10 pairs of genes were considered in the reconstruction process. This resulted in 33 homeologous scaffold pairs involving 34 distinct scaffolds being identified. Next, overlapping scaffold pairs were merged—for example, if scaffold A is homeologous to scaffolds B, C, and D, and scaffold B is homeologous to scaffolds E and F, then we can infer that scaffolds A, E, and F belong to one subgenome, whereas scaffolds B, C, and D belong to the other. However, this merging process did not connect all 33 scaffold pairs into a unique subgenome assignment. Although we could infer that (1) scaffolds 0, 6, 7, 8, 12, 13, and 17 of T. coremiiforme are homeologous to scaffolds 2, 9, 14, 18, 19, 20, 21, 23, 24, 28, 33, and 36, and (2) scaffolds 1, 22, 26, 27, and 29 of T. coremiiforme are homeologous to scaffolds 3, 10, and 15, we could not tell which of the first two subgenomes corresponds to which of the latter two subgenomes. Subsequent phylogenetic analyses were required to ultimately determine that scaffolds 0, 6, 7, 8, 12, 13, and 17 are on the same subgenome as scaffolds 3, 10, and 15.
For T. ovoides, the median difference in sequence identities among each of its two subgenomes to T. inkin is 7%, and both reconstruction methods were applicable. The synteny-based method produced a subgenome assignment covering 28 distinct scaffolds, and the reference genome–based method produced an assignment covering 46 distinct scaffolds, including all 28 covered by the former. In 25 of 28 scaffolds covered by both methods, the two assignments agreed on 93% of the genes (5466 of 5875 genes). In the other three scaffolds, strong evidence for chromosomal recombinations was observed. In scaffold 5, the reference genome–based method assigned 162 genes to one subgenome and 423 genes to the other (a 27% to 73% ratio). However, when gene order was taken into account, we found that 93% of the first 143 genes on this scaffold were assigned to one subgenome and 93% of the other 442 genes were assigned to the other subgenome. Similar results were found for scaffold 6, in which 95% of its first 296 genes were assigned to one subgenome and 94% of the remaining 237 genes were assigned to the other; in scaffold 13, 98% of its first 120 genes were assigned to one subgenome, and 95% of the remaining 111 genes were assigned to the other. Because the reference genome–based method produced a subgenome assignment with higher scaffold coverage, a good agreement with synteny-based reconstruction, and capability to capture chromosomal recombination, we selected T. ovoides subgenome assignments produced by this method for subsequent analyses.
Gene-loss analysis
To probe the distribution of gene losses between subgenomes of T. coremiiforme or T. ovoides with high confidence, only gene losses that occurred within doubly conserved syntenic segments were counted. This consideration minimized the impact of genome misassembly and collapse of repetitive regions as those errors tend to disrupt doubly conserved synteny structure. Based on subgenome assignments, the numbers of gene losses on syntenic segments corresponding to the same subgenome were then added together. This covered 607 gene losses in T. coremiiforme and 1214 in T. ovoides (Fig. 2B). The difference in gene counts is due to higher coverage of synteny structure and subgenome reconstruction in T. ovoides. For each single-copy gene that does not belong to a doubly conserved syntenic segment, we assign its subgenome using the majority subgenome assignment of neighboring genes. In T. coremiiforme, because each scaffold was assigned to a subgenome as a whole, all single-copy genes on a scaffold were assigned to the same subgenome. In T. ovoides, we assigned a single-copy gene to the majority subgenome assignment of up to 20 homeologous genes surrounding it (up to 10 upstream genes and 10 downstream genes). If fewer than 10 genes are present on either side, only those genes would be included. In case of a tie or when there are no nearby homeologous genes (e.g., in region with heavy gene losses), that single-copy gene was labeled as of unknown origin.
Phylogenetic reconstruction
Initial phylogenetic analyses to determine the tree topology were performed in MEGA version 6 build# 6140226 (Tamura et al. 2013) using both Maximum Likelihood (ML) and Maximum Parsimony (MP) methods and PhyML version 3.1 (Guindon and Gascuel 2003; Guindon 2010). Amino acid sequences of 2623 gene ortholog groups that are present in all five Trichosporon species and remain as two-copy in both T. coremiiforme and T. ovoides were aligned using MUSCLE (Edgar 2004), and the results were mapped to their nucleotide sequences. Aligned sequences belonging to the same species or subgenomes (in the case of T. coremiiforme and T. ovoides) were concatenated together. Each isolated subgenome pair in T. coremiiforme (see “Subgenome assignment”) was analyzed separately at this stage. The Jukes-Cantor substitution model and the Subtree-Pruning-Regrafting (SPR) method were used. Bootstrap count was set to 100 in MEGA (as the software crashed at 1000 bootstrap value) and 1000 in PhyML. Designating the subgenomes of T. coremiiforme and T. ovoides, which are evolutionarily closer to T. asahii and T. inkin, respectively, as the subgenome A and the other as B, both MEGA and PhyML produced the following tree topology with 100% bootstrap support: ((T. ovoides B, (T. ovoides A, T. inkin)), (T. faecale (T. coremii. B, (T. coremii. A, T. asahii)))). This tree topology was used in all subsequent analyses. Neither changing the nucleotide substitution model (in both MEGA and PhyML) nor switching between codon and nucleotide model (in MEGA) affected the topology and bootstrap support of the resulting phylogenetic trees.
Synonymous and nonsynonymous substitution rate calculations
PAML version 4.8 (Yang 2007) was used to calculate phylogenetic trees along with branch-specific substitution rates. First, we tested the molecular clock hypothesis of equal evolutionary rates for the Trichosporon tree using the likelihood ratio tests on the ML trees estimated with and without molecular clock assumption. The test statistic is 114.50 with a degree of freedom of 7–2 = 5, and so the molecular clock assumption was rejected (P-value <1 × 10⁻⁷). In all cases hereafter, PAML was used without the clock assumption (clock = 0). The corresponding section of the Trichosporon phylogenetic tree topology characterized above, ((T. ovoides B, (T. ovoides A, T. inkin)), (T. faecale (T. coremii. B, (T. coremii. A, T. asahii)))), was used as input for each ortholog group. For example, for an ortholog group containing two homeologous genes in T. coremiiforme and one gene each in T. inkin, T. faecale, and T. asahii, the tree topology (T. inkin, (T. faecale (T. coremii. B, (T. coremii. A, T. asahii)))) was specified. We restricted our analyses to 4951 high-confidence ortholog groups which are present in all three nonhybrid Trichosporon species. Among these, 3768 ortholog groups are present as two-copy in T. coremiiforme, 1126 groups are present as single-copy in T. coremiiforme, 3478 groups are present as two-copy in T. ovoides, and 1399 groups are present as single-copy in T. ovoides. Sequence alignment for genes in each ortholog group was made with MUSCLE at the amino acid sequence level, and the result was mapped to their nucleotide sequences. The codeml module of PAML was used with the following parameters: F3X4 codon frequency model, no molecular clock, jones.dat empirical amino acid substitution model, and different dN/dS ratio for each branch. From each ML tree generated by codeml, we took the dN and dS values of the branches directly leading to a nonhybrid species or a subgenome of a hybrid species as the dN and dS estimates for that gene. For example, given the following codeml output:
dS tree:
((((TAsahii: 0.304562, TCoremiiformeA: 0.269537): 0.000837, TCoremiiformeB: 0.260308): 0.087016, TFaecale: 0.249978): 0.960206, TInkin: 0.171225);
dN tree:
((((TAsahii: 0.002948, TCoremiiformeA: 0.010789): 0.001026, TCoremiiformeB: 0.009370): 0.002769, TFaecale: 0.003763): 0.047983, TInkin: 0.000017).
The dN and dS estimates for the T. asahii gene here would be 0.002948 and 0.304562, respectively. Once all estimates were obtained, a filter dS ≤ 2 was applied to remove ortholog groups whose synonymous substitutions may be oversaturated from further analyses. Ultimately, we obtained dN and dS estimates for 7150 T. coremiiforme two-copy genes (3575 pairs), 1080 T. coremiiforme single-copy genes, 6028 T. ovoides two-copy genes (3014 pairs), and 1267 T. ovoides single-copy genes.
Estimation of the ages of Trichosporon hybridization events
The whole-genome duplication event in Saccharomycetaceae fungi (Kellis et al. 2004) was used as a calibration point for estimating relative ages of the two hybridization events in the Trichosporon lineage. First, orthologous relationships between Trichosporon genes and genes from S. cerevisiae, C. glabrata, and L. waltii were identified using inParanoid. Amino acid sequences of 822 gene ortholog groups—which are present in all eight species and are present as two-copy in T. coremiiforme and T. ovoides—were aligned using MUSCLE, and the resulting alignments were mapped to their corresponding nucleotide sequences. Then, the map-aligned nucleotide sequences of genes belonging to the same species or the same subgenome of a hybrid species were concatenated together. Although it would be preferable to directly compare the levels of sequence divergence between homeolog pairs in Trichosporon hybrids to those between duplicated gene pairs in S. cerevisiae and C. glabrata, low duplicated gene retention rates in Saccharomycetaceae (<15%) combined with low coverages of ortholog mapping between distant fungal lineages inhibited such analysis. Instead, we had to use the level of sequence divergences between S. cerevisiae, C. glabrata, and L. waltii as rough representatives for the timing of the Saccharomycetaceae genome duplication event. The codeml module of PAML was used to calculate pairwise sequence divergence (runmode = −2) shown in Figure 1B. The input tree topology was fixed as (((T. ovoides B, (T. ovoides A, T. inkin)), (T. faecale (T. coremii. B, (T. coremii. A, T. asahii)))), (L. waltii, (S. cerevisiae, G. glabrata)))—the combination of Trichosporon tree topology determined above and the known relationship between Saccharomycetaceae fungi. This yielded estimated divergence levels between T. coremiiforme subgenomes as dS = 0.6753, between T. ovoides subgenomes as dS = 1.3763, between S. cerevisiae and G. glabrata as dS = 8.2356, and between S. cerevisiae-G. glabrata and L. waltii as dS = 68.0845. Hence, the timing of hybridization events in Trichosporon are about at least six to 12 times younger than the whole-genome duplication event in Saccharomycetaceae, and could be up to 50 to 100 times younger.
Evolutionary rate analyses
dN/dS values were used to represent the evolutionary rates of genes. In order to probe the changes in dN/dS following each genome hybridization event, dN/dS of the phylogenetic tree branches leading to nonpolyploid species were used to define the “background evolutionary rates.” For T. coremiiforme, the background evolutionary rates were calculated as the weighted-average of dN/dS of the branches leading to T. faecale and T. asahii (with dS as weights, this is equivalent to the ratio of average dN over average dS of the two branches). For T. ovoides, the dN/dS of the branch leading to T. inkin was directly used as its background. Changes in evolutionary rates were then defined as the log (base 2) ratios of dN/dS of the phylogenetic tree branches leading to T. coremiiforme or T. ovoides over their corresponding background dN/dS. A twofold threshold was used to classify genes as evolutionarily “decelerated,” “accelerated,” or “neutral.”
To evaluate the degree of correlation of evolutionary rates between the two subgenomes of each Trichosporon hybrid, two analyses were performed. First, based on the frequency of “decelerated,” “accelerated,” and “neutral” genes in each species, an expected distribution of homeolog pairs with each of the six possible combinations—decelerated/decelerated, decelerated/accelerated, decelerated/neutral, accelerated/accelerated, accelerated/neutral, and neutral/neutral—was computed. Enrichment of each group was determined as the fold differences between observed and expected homeolog pair counts. Fisher's exact tests for the enrichments of decelerated/decelerated, or accelerated/accelerated, homeolog pairs were performed on 2 × 2 tables containing the frequencies of decelerated and nondecelerated genes, or accelerated/nonaccelerated genes, on subgenome A and B, respectively. Second, the correlation coefficients of changes in dN/dS between homeologous genes were compared to coefficients derived from sets of 10,000 randomized gene pairing (permutation test), and the coefficient was calculated using the dN/dS ratios of T. faecale and T. asahii over T. coremiiforme (Fig. 4B). The latter data set represents a baseline correlation of changes in evolutionary rates across closely related genomes outside the context of genome hybridization.
Gene conversion detection
We used GENECONV v1.81a (Sawyer 1989) to detect gene conversion between two-copy genes. Sequence alignment of each ortholog group consisting of a reference gene in nonpolyploid species (T. asahii or T. inkin) and two genes in post-hybrid species (T. coremiiforme or T. ovoides) was performed using MUSCLE and used as input for GENECONV. Permutation test parameters for GENECONV were set at 10,000 permutations and a maximum P-value of 0.05. Overall, 2623 ortholog groups were analyzed. At P-value of 0.05, gene conversions were detected in 496 and 178 homeolog pairs from T. coremiiforme and T. ovoides, respectively. After adjusting for multiple-testing via Bonferroni correction, the number of detected gene conversions became 160 and 34, respectively.
Protein complex and protein–protein interaction analyses
The protein complex data set for S. cerevisiae was downloaded from http://wodaklab.org/cyc2008/ (Pu et al. 2009), which consists of 408 manually curated complexes identified in small-scale experiments. Of these, 201 complexes could be mapped to some T. coremiiforme or T. ovoides genes. Mitochondria-related complexes (seven complexes whose names start with “mitochondrial”) and duplicated complexes (two complexes: SLIK [Saga-like] complex which contains the same set of genes as the SAGA complex, and H+ transporting ATPase Golgi which contains the same set of genes as H+ transporting ATPase vacuolar) were then removed. The final complex count is 192 complexes, consisting of 1091 T. coremiiforme genes and 1094 T. ovoides genes. To classify whether a protein complex is involved with transcription and translation processes, we performed literature searches on all 192 complexes and annotated 43 complexes as such. The numbers of T. coremiiforme and T. ovoides single-copy and two-copy genes that belong to each complex were calculated, and complexes with multiple single-copy genes were shown in Supplemental Tables S2, S3. For T. coremiiforme, 27 complexes contain multiple single-copy genes, and 11 of these are involved with transcription and translation processes. For T. ovoides, 44 complexes contain multiple single-copy genes, and 17 of these are involved with transcription and translation processes. The overlap between two species consists of 14 complexes, eight of which are involved with transcription and translation processes. To test the significances of gene losses from protein complexes, we performed permutation tests (up to 10,000 permutations) by randomly shuffling ortholog gene group states (single-copy and two-copy). These tests therefore preserve the global gene-loss rates and control the discrepancy in protein complex sizes. Protein complexes involved in transcription and translation experienced significantly more gene losses (32.65% gene-loss rate) than other complexes (20.89% gene-loss rate) in T. coremiiforme (permutation test P-value <1 × 10⁻⁵). In T. ovoides, the difference is modest, with 28.29% gene-loss rate for complexes involved in transcription and translation compared to 26.23% for other complexes (permutation test P-value = 0.301).
The protein interaction data set for S. cerevisiae was downloaded from the Saccharomyces Genome Database (Cherry et al. 2012) at http://downloads.yeastgenome.org/curation/literature/interaction_data.tab, in July 2014. Self-loop and duplicated interactions between the same protein pairs were removed. Three subnetworks of the protein–protein interaction data set were considered: the network containing 192 protein complexes defined above (4742 interactions), the network containing 38 components of the cytoplasmic ribosomal large subunit (270 interactions), and the network containing 26 components of the cytoplasmic ribosomal small subunit (121 interactions). Network permutation using the edge-switching algorithm (Rao et al. 1996) was performed 1000 times for the calculation of P-value. In each network, the number of interactions between single-copy genes was used as the test statistic to probe the extent of stoichiometry preservation. The rationale is that because the majority (>70%) of genes exist as two-copy in these hybrid species, evolutionary pressures to maintain stoichiometric balance would be strongest surrounding each single-copy gene, and gene losses should occur more often among direct interaction partners of single-copy genes. However, we detected no such signal in these analyses. Besides the case of cytoplasmic ribosomal small subunit in T. ovoides with permutation test P-value = 0.292 (seven interactions between single-copy genes, 5.81 interactions on average among randomized networks), the number of interactions between single-copy genes in all other networks were less than expected (permutation test P-values range from 0.5 to 0.7).
Gene ontology enrichment
T. asahii genes were first mapped to S. cerevisiae genes using inParanoid as described above. In total, 2797 genes could be mapped. Gene ontology (GO) annotation for S. cerevisiae genes was downloaded from UniProt Knowledgebase in March 2014. Adding the C. neoformans gene annotation data set did not improve annotation coverage. GO enrichment analyses were performed using DAVID (Huang et al. 2009a,b). DAVID analyses were performed using the set of 2797 S. cerevisiae orthologs of T. asahii genes as the background gene set. Enrichment analyses for the sets of decelerated/decelerated and accelerated/accelerated homeolog pairs in T. coremiiforme and T. ovoides were performed. No significant enrichments were detected at a false discovery rate threshold of 1%.
Data access
Assembled genome sequences from this study have been submitted to the NCBI Whole Genome Shotgun database (WGS; http://www.ncbi.nlm.nih.gov/Traces/wgs/) under accession numbers JXYK00000000 (T. faecale), JXYL00000000 (T. coremiiforme), JXYM00000000 (T. inkin), and JXYN00000000 (T. ovoides). Raw sequence reads are available at NCBI BioProject (http://www.ncbi.nlm.nih.gov/bioproject/) under accession numbers PRJDB3698 (T. faecale), PRJDB3697 (T. coremiiforme), PRJDB3701 (T. inkin), and PRJDB3702 (T. ovoides).
Acknowledgments
The authors thank members of the Iwasaki laboratory at the University of Tokyo and the anonymous reviewers for helpful comments on this research. This work was supported by the Japan Society for the Promotion of Science (KAKENHI 23710231 and 26-04382), the Japan Science and Technology Agency (CREST), the Ministry of Education, Culture, Sports, Science, and Technology in Japan (KAKENHI 221S0002, Genome Information Upgrading Program of the National BioResource Project, and Cell Innovation Program), the Canon Foundation, and the Institute for Fermentation, Osaka.
Author contributions: S.S. performed data analyses. M.T., R.M., M.O., and T.S. conducted laboratory experiments and produced genome sequence data. S.S. and W.I. wrote the manuscript with contributions from the coauthors. W.I. directed and supervised the research.
Footnotes
[Supplemental material is available for this article.]
Article published online before print. Article, supplemental material, and publication date are at http://www.genome.org/cgi/doi/10.1101/gr.205948.116.
References
- Alexeyenko A, Tamas I, Liu G, Sonnhammer EL. 2006. Automatic clustering of orthologs and inparalogs shared by multiple proteomes. Bioinformatics 22: e9–e15. [DOI] [PubMed] [Google Scholar]
- Arabidopsis Genome Initiative. 2000. Analysis of the genome sequence of the flowering plant Arabidopsis thaliana. Nature 408: 796–815. [DOI] [PubMed] [Google Scholar]
- Aury JM, Jaillon O, Duret L, Noel B, Jubin C, Porcel BM, Ségurens B, Daubin V, Anthouard V, Aiach N, et al. 2006. Global trends of whole-genome duplications revealed by the ciliate Paramecium tetraurelia. Nature 444: 171–178. [DOI] [PubMed] [Google Scholar]
- Brunet FG, Roest Crollius H, Paris M, Aury JM, Gibert P, Jaillon O, Laudet V, Robinson-Rechavi M. 2006. Gene loss and evolutionary rates following whole-genome duplication in teleost fishes. Mol Biol Evol 23: 1808–1816. [DOI] [PubMed] [Google Scholar]
- Byrne KP, Wolfe KH. 2005. The Yeast Gene Order Browser: Combining curated homology and syntenic context reveals gene fate in polyploid species. Genome Res 15: 1456–1461. [DOI] [PMC free article] [PubMed] [Google Scholar]
- Byrne KP, Wolfe KH. 2007. Consistent patterns of rate asymmetry and gene loss indicate widespread neofunctionalization of yeast genes after whole-genome duplication. Genetics 175: 1341–1350. [DOI] [PMC free article] [PubMed] [Google Scholar]
- Cherry JM, Hong EL, Amundsen C, Balakrishnan R, Binkley G, Chan ET, Christie KR, Costanzo MC, Dwight SS, Engel SR, et al. 2012. Saccharomyces Genome Database: the genomics resource of budding yeast. Nucleic Acids Res 40: D700–D705. [DOI] [PMC free article] [PubMed] [Google Scholar]
- Conant GC. 2014. Comparative genomics as a time machine: how relative gene dosage and metabolic requirements shaped the time-dependent resolution of yeast polyploidy. Mol Biol Evol 31: 3184–3193. [DOI] [PubMed] [Google Scholar]
- Davis JC, Petrov DA. 2004. Preferential duplication of conserved proteins in eukaryotic genomes. PLoS Biol 2: E55. [DOI] [PMC free article] [PubMed] [Google Scholar]
- Dehal P, Boore JL. 2005. Two rounds of whole genome duplication in the ancestral vertebrate. PLoS Biol 3: e314. [DOI] [PMC free article] [PubMed] [Google Scholar]
- Edgar RC. 2004. MUSCLE: multiple sequence alignment with high accuracy and high throughput. Nucleic Acids Res 32: 1792–1797. [DOI] [PMC free article] [PubMed] [Google Scholar]
- Fawcett JA, Innan H. 2011. Neutral and non-neutral evolution of duplicated genes with gene conversion. Genes (Basel) 2: 191–209. [DOI] [PMC free article] [PubMed] [Google Scholar]
- Gnerre S, Maccallum I, Przybylski D, Ribeiro FJ, Burton JN, Walker BJ, Sharpe T, Hall G, Shea TP, Sykes S, et al. 2011. High-quality draft assemblies of mammalian genomes from massively parallel sequence data. Proc Natl Acad Sci 108: 1513–1518. [DOI] [PMC free article] [PubMed] [Google Scholar]
- Gout JF, Lynch M. 2015. Maintenance and loss of duplicated genes by dosage subfunctionalization. Mol Biol Evol 32: 2141–2148. [DOI] [PMC free article] [PubMed] [Google Scholar]
- Guindon S. 2010. Bayesian estimation of divergence times from large sequence alignments. Mol Biol Evol 27: 1768–1781. [DOI] [PubMed] [Google Scholar]
- Guindon S, Gascuel O. 2003. A simple, fast, and accurate algorithm to estimate large phylogenies by maximum likelihood. Syst Biol 52: 696–704. [DOI] [PubMed] [Google Scholar]
- Huang DW, Sherman BT, Lempicki RA. 2009a. Bioinformatics enrichment tools: paths toward the comprehensive functional analysis of large gene lists. Nucleic Acids Res 37: 1–13. [DOI] [PMC free article] [PubMed] [Google Scholar]
- Huang DW, Sherman BT, Lempicki RA. 2009b. Systematic and integrative analysis of large gene lists using DAVID bioinformatics resources. Nat Protoc 4: 44–57. [DOI] [PubMed] [Google Scholar]
- Hunt M, Kikuchi T, Sanders M, Newbold C, Berriman M, Otto TD. 2013. REAPR: a universal tool for genome assembly evaluation. Genome Biol 14: R47. [DOI] [PMC free article] [PubMed] [Google Scholar]
- Jaillon O, Aury JM, Wincker P. 2009. “Changing by doubling”, the impact of Whole Genome Duplications in the evolution of eukaryotes. C R Biol 332: 241–253. [DOI] [PubMed] [Google Scholar]
- Katju V, LaBeau EM, Lipinski KJ, Bergthorsson U. 2008. Sex change by gene conversion in a Caenorhabditis elegans fog-2 mutant. Genetics 180: 669–672. [DOI] [PMC free article] [PubMed] [Google Scholar]
- Kellis M, Birren BW, Lander ES. 2004. Proof and evolutionary analysis of ancient genome duplication in the yeast Saccharomyces cerevisiae. Nature 428: 617–624. [DOI] [PubMed] [Google Scholar]
- Kiełbasa SM, Wan R, Sato K, Horton P, Frith MC. 2011. Adaptive seeds tame genomic sequence comparison. Genome Res 21: 487–493. [DOI] [PMC free article] [PubMed] [Google Scholar]
- Komili S, Farny NG, Roth FP, Silver PA. 2007. Functional specificity among ribosomal proteins regulates gene expression. Cell 131: 557–571. [DOI] [PMC free article] [PubMed] [Google Scholar]
- Kurtzman CP, Fell JW, Boekhout T. 2011. The yeasts, a taxonomic study, 5th ed., Vol. 3 Elsevier, Amsterdam. [Google Scholar]
- Leggett RM, Clavijo BJ, Clissold L, Clark MD, Caccamo M. 2014. NextClip: an analysis and read preparation tool for Nextera long mate air libraries. Bioinformatics 30: 566–568. [DOI] [PMC free article] [PubMed] [Google Scholar]
- Li W, Averette AF, Desnos-Ollivier M, Ni M, Dromer F, Heitman J. 2012. Genetic diversity and genomic plasticity of Cryptococcus neoformans AD hybrid strains. G3 (Bethesda) 2: 83–97. [DOI] [PMC free article] [PubMed] [Google Scholar]
- Louis VL, Despons L, Friedrich A, Martin T, Durrens P, Casarégola S, Neuvéglise C, Fairhead C, Marck C, Cruz JA, et al. 2012. Pichia sorbitophila, an interspecies yeast hybrid, reveals early steps of genome resolution after polyploidization. G3 (Bethesda) 2: 299–311. [DOI] [PMC free article] [PubMed] [Google Scholar]
- Mallet J. 2005. Hybridization as an invasion of the genome. Trends Ecol Evol 20: 229–237. [DOI] [PubMed] [Google Scholar]
- Marais GA, Campos PR, Gordo I. 2010. Can intra-Y gene conversion oppose the degeneration of the human Y chromosome? A simulation study. Genome Biol Evol 2: 347–357. [DOI] [PMC free article] [PubMed] [Google Scholar]
- McGrath CL, Gout JF, Johri P, Doak TG, Lynch M. 2014. Differential retention and divergent resolution of duplicate genes following whole-genome duplication. Genome Res 24: 1665–1675. [DOI] [PMC free article] [PubMed] [Google Scholar]
- McLaughlin DJ, Spatafora JW. 2014. Systematics and evolution. Springer, Berlin Heidelberg, Germany. [Google Scholar]
- O'Gorman CM, Fuller H, Dyer PS. 2009. Discovery of a sexual cycle in the opportunistic fungal pathogen Aspergillus fumigatus. Nature 457: 471–474. [DOI] [PubMed] [Google Scholar]
- Ohno S. 1970. Evolution by gene duplication. Springer, New York. [Google Scholar]
- Park N, Shirley L, Gu Y, Keane TM, Swerdlow H, Quail MA. 2013. An improved approach to mate-paired library preparation for Illumina sequencing. Methods Next Generation Seq 1 10.2478/mngs-2013-0001. [DOI] [Google Scholar]
- Parra G, Bradnam K, Ning Z, Keane T, Korf I. 2009. Assessing the gene space in draft genomes. Nucleic Acids Res 37: 289–297. [DOI] [PMC free article] [PubMed] [Google Scholar]
- Pu S, Wong J, Turner B, Cho E, Wodak SJ. 2009. Up-to-date catalogues of yeast protein complexes. Nucleic Acids Res 37: 825–831. [DOI] [PMC free article] [PubMed] [Google Scholar]
- Raeder U, Broda P. 1985. Rapid preparation of DNA from filamentous fungi. Lett Appl Microbiol 1: 17–20. [Google Scholar]
- Rao AJ, Jana R, Bandyopadhya S. 1996. A Markov chain Monte Carlo method for generating random (0, 1)-matrices with given marginals. Indian J Stat 58: 225–242. [Google Scholar]
- Remm M, Storm CE, Sonnhammer EL. 2001. Automatic clustering of orthologs and in-paralogs from pairwise species comparisons. J Mol Biol 314: 1041–1052. [DOI] [PubMed] [Google Scholar]
- Sawyer S. 1989. Statistical tests for detecting gene conversion. Mol Biol Evol 6: 526–538. [DOI] [PubMed] [Google Scholar]
- Scannell DR, Byrne KP, Gordon JL, Wong S, Wolfe KH. 2006. Multiple rounds of speciation associated with reciprocal gene loss in polyploid yeasts. Nature 440: 341–345. [DOI] [PubMed] [Google Scholar]
- Scannell DR, Butler G, Wolfe KH. 2007. Yeast genome evolution—the origin of the species. Yeast 24: 929–942. [DOI] [PubMed] [Google Scholar]
- Sémon M, Wolfe KH. 2007. Consequences of genome duplication. Curr Opin Genet Dev 17: 505–512. [DOI] [PubMed] [Google Scholar]
- Stanke M, Diekhans M, Baertsch R, Haussler D. 2008. Using native and syntenically mapped cDNA alignments to improve de novo gene finding. Bioinformatics 24: 637–644. [DOI] [PubMed] [Google Scholar]
- Stukenbrock EH, Christiansen FB, Hansen TT, Dutheil JY, Schierup MH. 2012. Fusion of two divergent fungal individuals led to the recent emergence of a unique widespread pathogen species. Proc Natl Acad Sci 109: 10954–10959. [DOI] [PMC free article] [PubMed] [Google Scholar]
- Takashima M, Nakase T. 2000. Four new species of the genus Sporobolomyces isolated from leaves in Thailand. Mycoscience 41: 357–369. [Google Scholar]
- Takashima M, Manabe RI, Iwasaki W, Ohyama A, Ohkuma M, Sugita T. 2015. Selection of orthologous genes for construction of a highly resolved phylogenetic tree and clarification of the phylogeny of Trichosporonales species. PLoS One 8: e0131217. [DOI] [PMC free article] [PubMed] [Google Scholar]
- Takuno S, Nishio T, Satta Y, Innan H. 2008. Preservation of a pseudogene by gene conversion and diversifying selection. Genetics 180: 517–531. [DOI] [PMC free article] [PubMed] [Google Scholar]
- Tamura K, Stecher G, Peterson D, Filipski A, Kumar S. 2013. MEGA6: molecular evolutionary genetics analysis version 6.0. Mol Biol Evol 30: 2725–2729. [DOI] [PMC free article] [PubMed] [Google Scholar]
- Ter-Hovhannisyan V, Lomsadze A, Chernoff YO, Borodovsky M. 2008. Gene prediction in novel fungal genomes using an ab initio algorithm with unsupervised training. Genome Res 18: 1979–1990. [DOI] [PMC free article] [PubMed] [Google Scholar]
- Tirosh I, Reikhav S, Levy AA, Barkai N. 2009. A yeast hybrid provides insight into the evolution of gene expression regulation. Science 324: 659–662. [DOI] [PubMed] [Google Scholar]
- Van de Peer Y, Maere S, Meyer A. 2009. The evolutionary significance of ancient genome duplications. Nat Rev Genet 10: 725–732. [DOI] [PubMed] [Google Scholar]
- Vision TJ, Brown DG, Tanksley SD. 2000. The origins of genomic duplications in Arabidopsis. Science 290: 2114–2117. [DOI] [PubMed] [Google Scholar]
- Yang Z. 2007. PAML 4: phylogenetic analysis by maximum likelihood. Mol Biol Evol 24: 1586–1591. [DOI] [PubMed] [Google Scholar]
- Yang RY, Li HT, Zhu H, Zhou GP, Wang M, Wang L. 2012. Draft genome sequence of CBS 2479, the standard type strain of Trichosporon asahii. Eukaryot Cell 11: 1415–1416. [DOI] [PMC free article] [PubMed] [Google Scholar]