Abstract
Muscle fiber composition correlates with insulin resistance, and exercise training can increase slow-twitch (type I) fibers and, thereby, mitigate diabetes risk. Human skeletal muscle is made up of three distinct fiber types, but muscle contains many more isoforms of myosin heavy and light chains, which are coded by 15 and 11 different genes, respectively. Laser capture microdissection techniques allow assessment of mRNA and protein content in individual fibers. We found that specific human fiber types contain different mixtures of myosin heavy and light chains. Fast-twitch (type IIx) fibers consistently contained myosin heavy chains 1, 2, and 4 and myosin light chain 1. Type I fibers always contained myosin heavy chains 6 and 7 (MYH6 and MYH7) and myosin light chain 3 (MYL3), whereas MYH6, MYH7, and MYL3 were nearly absent from type IIx fibers. In contrast to cardiomyocytes, where MYH6 (also known as α-myosin heavy chain) is seen solely in fast-twitch cells, only slow-twitch fibers of skeletal muscle contained MYH6. Classical fast myosin heavy chains (MHC1, MHC2, and MHC4) were present in variable proportions in all fiber types, but significant MYH6 and MYH7 expression indicated slow-twitch phenotype, and the absence of these two isoforms determined a fast-twitch phenotype. The mixed myosin heavy and light chain content of type IIa fibers was consistent with its role as a transition between fast and slow phenotypes. These new observations suggest that the presence or absence of MYH6 and MYH7 proteins dictates the slow- or fast-twitch phenotype in skeletal muscle.
Keywords: muscle, muscle fiber type, myosin heavy chains, laser capture microdissection
the technical challenges of human skeletal muscle fiber type identification have evolved over the past three decades (8). The typical normal adult has roughly equal amounts of slow- and fast-twitch fibers, designated type I and II fibers. In addition, a variable portion of the type II fibers is mixed, containing both fast- and slow-twitch fiber markers, called type IIa fibers, whereas type II fibers that contain only the fast-twitch phenotype are designated type IIx in humans. Exercise training can cause modest shifts in fiber composition from one of these types to a contiguous type, with the relationship being type I to IIa to IIx or type IIx to IIa to I. The tail end of each myosin heavy chain is attached to the tail of another myosin heavy chain, and each of these forms a complex with two myosin light chains. Many heavy and light chain complexes are intertwined to form the thick filaments of each sarcomere. Thin filaments are composed of actin, troponin, and tropomyosin. The myosin heavy chains contain ATPase, which is essential for shortening of the contractile apparatus in the sarcomere, resulting in muscle-generated movement of a body part. The pH optimum of the ATPase has been classically the histochemical technique for identifying fast, slow, and mixed fibers. However, for more than a decade, monoclonal antibodies that correlated with the ATPase designation of fast, slow, and mixed fibers by bright-field or immunohistochemical methods have been used (2). The widely used fast and slow myosin monoclonal antibodies were obtained from mice immunized with only partially purified human skeletal muscle myosin antigens. More recently, antibodies that were raised against specific individual myosin heavy and light chain proteins became commercially available.
The 15 human genes that code myosin heavy chains are designated MYH1, MYH2, MYH3, MYH4, MYH6, MYH7, MYH7B, MYH8, MYH9, MYH10, MYH11, MYH12, MYH13, MYH14, MYH15, and MYH16 (17). MYH9, MYH10, and MYH11 are expressed primarily in smooth muscle. At least eight separate genes that code myosin light chains, MYL1, MYL2, MYL3, MYL4, MYL5, MYL6, MYL6B, and MYLPF, have been identified, and at least three of these have a second isoform (3).
Our initial investigation of the expression of myosin heavy and light chains using laser capture microdissection (LCM) to obtain specific fiber type samples from human vastus lateralis biopsies yielded some unexpected results. These observations led us to question which isoforms of myosin heavy and light chains are actually characteristic of “fast” or “slow” fibers in human skeletal muscle. We used immunoblots, mass spectroscopic (MS) proteomics, and next-generation sequencing of muscle homogenates and of LCM-generated samples of individual fiber types from normal control subjects and subjects with extremely different muscle fiber composition to approach this question by evaluating muscle specimens from subjects with diverse and extremely different fiber compositions. The hypothesis that drove these studies was that fibers of each type would have consistent myosin heavy and light chains that are characteristic of the fiber type. This is the first report that the abundance of different myosin heavy and light chains corresponds to different muscle fiber types.
MATERIALS AND METHODS
Subjects.
All the subjects participated in previous projects. Each of the muscle biopsies has been studied in detail, and nearly all have been part of published reports (5, 9–15). Forty-six subjects with pre- and postexercise training muscle biopsies were included. Sixteen of these were lean control subjects, and 30 were metabolic syndrome subjects. Of these, 19 were women and 27 were men. Other subjects included in our muscle biopsy repository include control and metabolic syndrome subjects who did not participate in an intervention, distance runners, type 1 and type 2 diabetes patients, and elderly subjects. All these latter groups include equal numbers of men and women. The average age of 104 subjects representing 174 biopsies was 42 (range 22–87) yr. Each human research protocol was approved by the East Tennessee State University Institutional Review Board, and all subjects provided written consent.
Reagents.
Anti-GLUT4 antibodies (07-1404), slow myosin heavy chain (MAB1628) monoclonal antibodies, and myosin heavy chain-specific antibodies MYH2 (MABT25) and MYH7 (MAB1548) were obtained from Millipore (Billerica, MA); anti-fast myosin (ab91506) and ATP synthase (ab110273) from Abcam (Cambridge, MA); antibodies against GLUT5 (GT52-A) from Alpha Diagnostic (San Antonio, TX); antibodies for MYH1 (SAB2104768), MYH4 (SAB4301129), and MYH6 (HPA001349) and MYL1 (SAB1409338) and MYL3 (SAB1410809) from Sigma-Aldrich (St. Louis, MO); monoclonal anti-myosin (skeletal-fast)-alkaline phosphatase (A4335) from Sigma; peroxidase-conjugated rabbit anti-mouse antibodies from Jackson Immunoresearch Labs (West Grove, PA); and Vector red substrate kits (SK-5100) and Vector SG peroxidase substrate kits (SK-4700) from Vector Laboratories (Burlingame, CA).
Muscle biopsies.
Muscle biopsies were taken from the vastus lateralis by needle biopsy under suction after an overnight fast and 2 h of quiet recumbency, as previously described (5). Portions of virtually all muscle biopsies had been retained at −85°C since the original protocols. Each biopsy was stored in three different ways: one piece was placed directly in liquid nitrogen, one piece was mounted on cork for cryostat sectioning and frozen in a slurry of isopentane cooled over liquid nitrogen, and slides that contained multiple transversely cut sections were stored for immunohistochemistry and LCM.
Quantification of muscle fiber type composition.
Fiber composition was determined using methods described by Behan and et al. (2). These techniques employ fast and slow myosin monoclonal antibodies and bright-field microscopy. Behan et al. showed that ATPase pH optimum studies gave the same designation of the type I, IIa, and IIx fibers (types 1, 2a, and 2b by their codes). We have extensively confirmed the equivalence of the method of Behan and et al. and ATPase pH optimum in our laboratory. All sections were coded and then quantified independently by two observers who were unaware of which subject was represented by the image. Fiber content is based on a count of the number of fibers of each type in images from stained slides.
LCM.
The Arcturus microdissection instrument with the Veritas microdissection system (Life Technologies, Waltham, MA) was used to obtain pure samples of one muscle fiber type. Muscle biopsy specimens for sectioning had been mounted on cork and frozen in a slurry of freezing isopentane and subsequently stored at −80°C until processed. A Leica cryostat was used to cut 10-μm-thick sections, which were mounted on polyethylene naphthalate membrane glass slides (Life Technologies). The slides containing the muscle sections were kept at −80°C until the morning of LCM cutting. Slides for MS analysis sample procurement were stained according to the method of Behan et al. (2) for bright-field identification of fiber type, as previously described (13). Because the bright-field staining for fiber identification resulted in RNA degradation, it was necessary to stain alternate sections and use stained sections to identify by morphology the corresponding fiber type in the unstained slide from which the desired piece was taken. This procedure, although time-consuming, was necessary to obtain the quality RNA needed to generate the next-generation sequencing data. Each sample of one fiber type (types I, IIa, and IIx) contained ∼300 transversely cut fibers, which represented a total of 2.0 mm2. For each subject, LCM was used to obtain specimens, including representative 2.0-mm2 segments that included all fiber types (designated “whole”), from slides. Figure 1 displays images of a muscle section before and after collection of a type I fiber.
Fig. 1.
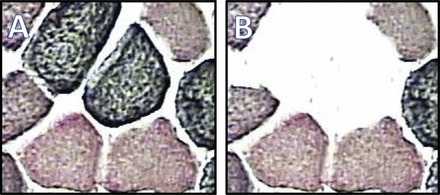
Laser capture microdissection (LCM) of skeletal muscle fibers in transversely cut sections. A and B: stained muscle sections before (A) and after (B) harvesting of 2 type I fibers. Sectioning and 2-antibody staining techniques are described in materials and methods. In A, 4 dark fibers are type I, 2 pink fibers are type IIx, and 4 purple fibers are type IIa. Horizontal maximum dimension of the central fiber was 75 μm.
Next-generation sequence data.
Next-generation sequencing data were provided through the Tennessee Higher Education Commission Molecular Biology Resource Center at the University of Tennessee Health Science Center in Memphis. RNA sequencing was subjected to analysis on a bioanalyzer (Agilent RNA 6000 Pico) and determined to have a RNA integrity number of >6.0. Then 5 ng of total RNA were used to prepare double-stranded cDNA using the Ovation V2 system (NuGEN). Thereafter, 500 ng of the double-stranded cDNA were used to prepare libraries for sequencing using the Ion Plus Fragment Library Kit for the AB Library Builder system. Libraries were subjected to five cycles of amplification, analyzed on an Agilent high-sensitivity DNA chip, and then pooled using the quantification data from this chip. Library pools were quantified by real-time PCR utilizing the Ion Library Quantification Kit and used to prepare spheres on an Ion One Touch 2 system. Libraries immobilized on these spheres were then sequenced on an Ion Torrent Proton P1 V2 chip (Life Technologies, Thermo Fisher Scientific, Waltham, MA).
Protein identification and quantification by MS.
LCM fiber type samples were reduced, alkylated with iodoacetamide, and trypsin-digested for MS, as previously described (6). Aliquots of the pooled muscle homogenates and fiber type samples were electrophoresed using SDS-PAGE. A scalpel was used to excise and cut gel bands at specified molecular weights into small (∼1 × 1 mm2) pieces. The gel pieces were destained, disulfide bonds were reduced, unmodified thiol groups were alkylated, and proteins were digested overnight with trypsin using the In-Gel Tryptic Digestion Kit (Pierce, Rockford, IL) according to the manufacturer's instructions. After digestion, the liquid containing the peptides was transferred to a 1.5-ml tube. For further extraction of peptides, the gel pieces were covered with extraction buffer consisting of 5:50:45 (vol/vol/vol) formic acid-acetonitrile-water for 10 min, and the liquid was collected. The liquid containing the peptides was completely dried using a DNA Speed Vac concentrator (Thermo Fisher Scientific, Asheville, NC). Peptides were rehydrated with 0.1% formic acid and further purified using zip tips (ZipTipU-C18, Millipore) according to the manufacturer's instructions. Peptides eluted from zip tips were transferred to vial inserts. The peptides in the vial inserts were completely dried using the Speed Vac concentrator and then rehydrated in a volume of 8 μl of 0.1:20:79.9 (vol/vol/vol) formic acid-acetonitrile-water. A volume of 2 μl was injected into a C18 PicoFrit column (New Objective, Woburn, MA). The column was first equilibrated in 98:2 (vol/vol) solvent A (0.1% formic acid in water)-solvent B (0.1% formic acid in acetonitrile) and then eluted at a pump flow rate of 160–250 μl/min with a gradient of 2–40% solvent B over 60 min and then eluted in 98% solvent B for 30 min. Eluted peptides were analyzed by electrospray ionization LTQ-XL ion trap MS (Thermo Scientific, Waltham, MA). MS data were acquired using data-dependent acquisition with a series of one full scan followed by five MS/MS scans to record the five most intense ions. The dynamic exclusion duration was 30 ms. Proteins were identified from each MS raw data file using the SEQUEST search algorithm and the Swiss-Prot/UniProt database through the Proteome Discoverer browser (version 1.2, Thermo Fisher Scientific) set to a signal-to-noise threshold of 1.5, precursor mass tolerance of 1,400 millimass units, and fragment mass tolerance of 0.8 Da. The amount of each identified myosin heavy or light chain was determined using the total number of peptide spectrum matches identified by Proteome Discover. Table 1 lists the gene symbols and the corresponding accession numbers. Quantification by the total number of spectrum matches for each protein was justified as described by Griffen et al. (4), because the abundance of myosin heavy or light chains having similar molecular weights were being compared relative to each other. Fragment ion (MS/MS) intensities were also collected from Proteome Discoverer search results, and comparisons of the relative amount of myosin heavy or light chains were similar to those obtained with the number of peptide spectrum matches (data not shown).
Table 1.
Myosin gene symbols and accession numbers
| Accession No. |
|||
|---|---|---|---|
| Gene Symbol | Comments | Gene | Protein |
| MYH1 | MHC-IIX/D | NM_005963 | GI:4808815 |
| MYH2 | MHC-IIA | NM_017534 | GI:153791586 |
| MYH3 | Embryonic | NM_002470 | GI:34844 |
| MYH4 | MHC-IIB | NM_017533 | GI:215274129 |
| GI:224471840 | |||
| MYH6 | Cardiac-α, α−MHC | NM_002471 | GI:297024 |
| MYH7 | Cardiac-β, β−MHC | NM_000257 | GI:115496169 |
| MYH7B | NM_020884 | GI:27529913 | |
| MYH8 | Perinatal | NM_002472 | GI:189034 |
| MYH9 | Nonmuscle myosin IIa | NM_002473 | GI:12667788 |
| MYH10 | Nonmuscle myosin IIb | NM_005964 | GI:367460087 |
| MYH11 | Smooth muscle myosin II | NM_002474 | GI:13124879 |
| MYH13 | Extraocular | NM_003802 | GI:110624781 |
| MYH14 | MHC-7B | NM_001077186 | GI:327478526 |
| MYH15 | MyHC-15 extraocular | NM_014981 | GI:150010558 |
| MYH16 | MyHC-M jaw muscle | NM_002147 | GI:10438291 |
| MYL1 | Fast muscle, alkali | NM_079420.2 | GI:17986273 |
| NM_079422 | GI:17986275 | ||
| MYL2 | Slow, cardiac-β, mutant = hypertrophic cardiomyopathy | NM_000432.2 | GI:94981553 |
| MYL3 | Slow, alkali, mutant = hypertrophic cardiomyopathy | NM_000258.2 | GI:4557777 |
| MYL4 | Alkali, embryonic, adult atria | NM_002476.2 | GI:4557038 |
| NM_001002841 | GI:4557038 | ||
| MYL5 | NM_002477 | GI:4505305 | |
| MYL6 | Alkali, smooth muscle, nonmuscle | NM_021019 | GI:17986258 |
| MYL6B | Alkali, slow muscle, nonmuscle | NM_002475 | GI:4505303 |
| MYL7 | Atrial | NM_021223 | GI:10864037 |
| MYL9 | Modulates ATPase, calcium binds, activated by MYLK | NM_006097 | GI:29568111 |
| MYL12A | NM_006471 | GI:530424791 | |
| MYL12B | NM_001144944 | GI:15809016 | |
| MYLK | Ig superfamily, calcium/calmodulin-dependent kinase; telokin is duplicate of enzyme region, promoter in 3′-UTR | NM_053025 | GI:116008192 |
| MYLK2 | Skeletal muscle only, fast predominantly, calcium/calmodulin-dependent kinase | NM_033118 | GI:14993776 |
| MYLK3 | NM_0182493 | GI:146219832 | |
| MYLK4 | NM_001012418 | GI:124376290 | |
| MYLPF | Myosin light chain-phosphorylatable fast muscle | NM_013292.3 | GI:28372499 |
Immunoblots.
Immunoblots to assess the content of targeted proteins were performed using muscle homogenates or LCM samples, as previously described (5). Images were generated using G:BOX (Bio-Rad) and quantified using Quantity One software (Bio-Rad).
RESULTS
Key muscle proteins quantified by immunoblots vary depending on the muscle type I fiber content.
Six different muscle samples of a wide variety of type I fiber content were chosen for this series of studies. Figure 2 displays immunoblots from SDS-PAGE of these six samples with type I fiber content from 76% to 12%. Slow and fast myosin MAbs were used in the immunohistochemical quantification of fiber type content. MYH6- and MYH7-specific antibodies show band intensities across the blot consistent with slow myosin MAb. In contrast, fast myosin MAb and antibodies against MYH4, MYH2, and MYH1 show increasing band intensities from left to right in Fig. 2. MYH1 bands show similar intensities across all subjects. MYL3 and MYL1 also show relative intensities consistent with the distribution of fast and slow myosin MAbs; i.e., MYL1 is fast, and MYL3 is slow. Three additional antibodies were used to show consistency with the fiber content estimate. The presence of ATP synthase is known to correlate with the quantity of mitochondria, and the band intensity of ATP synthase progressively decreases from the highest in the 76% type I fiber sample to the lowest in the 12% type I fiber sample. GLUT5 shows consistent highest expression in type II fibers, as described in our previous studies (12, 15), and the band intensities of GLUT5 in Fig. 2 are consistent with GLUT5 having the lowest expression at the 76% type I content. GLUT4 appears to be distributed almost equally across the full spectrum of type I fiber content.
Fig. 2.
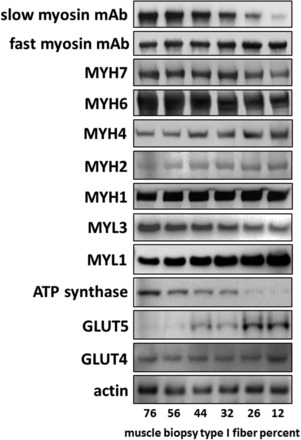
Western blots showing protein expression across a range of muscle type I fiber content. Muscle specimen homogenates from 6 subjects with differing muscle fiber content were subjected to PAGE using a 4–12% acrylamide gradient gel with 5 or 20 μg of protein per lane, depending on the antibody to be used. Percent type I fibers was determined using the fast and slow myosin monoclonal antibodies with bright-field images, as described in materials and methods. Specifications of the antibodies are listed in materials and methods. Actin content demonstrated consistent sample protein loading across the spectrum of differing type I fiber content. MYH, myosin heavy chain; MYL, myosin light chain.
Contrast myosin heavy and light chain expression quantified by MS across a wide variety of fiber composition in muscle biopsies from diverse subjects.
Seven muscle specimens that represent a wide spectrum of type I fiber content from extremes of 82% in an elite runner and 12% in a prediabetic metabolic syndrome subject were chosen. Each specimen was homogenized, 20 μg of protein were subjected to SDS-PAGE, and the 220- and 15- to 25-kDa bands were excised and processed for MS. Unique peptides were identified and quantified for myosin heavy and light chains, as shown in Fig. 3. Patterns of expression of the myosin heavy chains across these diverse muscle compositions were dramatically different from the highest to the lowest type I fiber content. Above 50% type I fibers, MYH7 protein (pink) predominated. Below 44% type I fibers, a combination of MYH1 (black), MYH2 (red), MYH3 (green), MYH4 (yellow), and MYH6 (blue) proteins represented more than half of the myosin heavy chains. For myosin light chains, a combination of MYL3 (light green) and MYL2 cardiac (cross-hatched orange) predominated at high type I fiber content, but below 50% type I fibers, MYL1 (brown) and MYL2 skeletal muscle (clear orange) predominated.
Fig. 3.
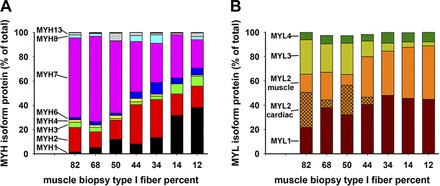
Mass spectroscopy (MS)-determined content of myosin heavy and light chains in muscle biopsy specimens from subjects with a wide spectrum of type I fiber content. Muscle from 7 subjects was subjected to PAGE, and bands of 220- and 15- to 25-kDa relative mobility were cut and analyzed by MS. These subjects are different from those of Fig. 2. A: proportion of expressed myosin heavy chain isoforms. B: proportion of myosin light chain isoforms. In A, black indicates MYH1, red indicates MYH2, green indicates MYH3, yellow indicates MYH4, blue indicates MYH6, and pink indicates MYH7; unlabeled light blue and gray stacks indicate MYH8 and MYH13, respectively. In B, brown indicates MYL1, orange indicates MYL2, light green indicates MYL3, and green indicates MYL4; MYL2 is divided into “MYL2 cardiac” (cross-hatched orange) and “MYL2 muscle.”
Figure 4 shows immunoblots of LCM-collected specific muscle fiber type samples from six normal control subjects, each quantified separately. The fiber composition of the subjects averaged 44 ± 1% type I, 23 ± 3% type IIa, and 32 ± 3% type IIx. The blots were each probed with antibodies against a heavy chain and a light chain that have shown contrasting expression between type I and type IIx fibers. Figure 4, B and C, shows digital image analysis of the band intensities of immunoblots from these six volunteers. Figure 4B shows a pattern of higher content of MYH7, MYH6, and MYL3 in type I fibers. In contrast to the major differences seen with MYH7 antibody, these data show similar intensity of MYH1, MYH2, and MYH4 signals across the three fiber types. These data show higher expression of MYL1 in type IIa fibers.
Fig. 4.
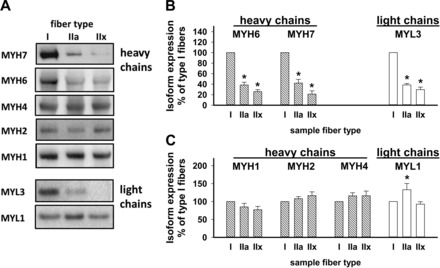
Specific fiber type expression of MYH1, MYH2, MYH4, MYH6, MYH7, MYL1, and MYL3 proteins quantified by Western blotting. LCM was used to collect 2.0-mm2 samples of each of 3 fiber types from muscle sections from each subject stained using the 2-monoclonal antibody bright-field method of Behan et al. (2). A: each lane of the Bis-Tris 4–12% gradient gel (Life Technologies) contained the entire 2.0-mm2 LCM specimen. Images were obtained from blots from different subjects prepared in the same way each time. Blots were routinely probed with α-actin antibodies to verify that protein loading was consistent across the gel lanes (data not shown). B and C: results of the image analysis of ≥2 sets of LCM samples from each of the 6 control subjects. Type I fibers consistently expressed more MYH6, MYH7, and MYL3 than type IIa and IIx fibers. Type IIx fibers tended to express more MYH2 and MYH4 proteins, but the difference from type I fibers was not statistically significant. *Significantly different (P < 0.05) from type I (by paired t-test).
The potential for cross-contamination of one fiber type to another is minimized by the LCM technique. For samples for RNA collection, sections alternating between stained and unstained were used, because the staining technique resulted in substantial RNA degradation. Comparison of stained and unstained sections for LCM collection of MS samples showed that staining did not affect the protein expression data. For this reason, we used stained sections for the collection of fiber samples for protein identification studies, because fiber type was consistently clearly identifiable and sample collection required fewer sections and less operator time. We believe that there was little or no cross-contamination of specific fiber type samples.
Human muscle fiber-specific expression of myosin heavy and light chain mRNAs.
A series of samples of type I, IIa, and IIx fibers were collected by LCM from muscle sections from a single normal control subject. In addition, a similar area of mixed fibers that represented the whole muscle combination of fiber types was collected. This subject's fiber composition was 46% type I, 36% type IIa, and 19% type IIx, as quantified on multiple bright-field antibody-stained slides. Each sample came from a total cross-sectional area of 2.0 mm2 of 10-μm-thick sections, representing ∼300 transversely cut fiber slices. Each fiber type sample was selected from unstained sections by the alternate-stained-section technique (see materials and methods). The LCM-collected samples were used for RNA analysis and MS analysis shown in Fig. 5.
Fig. 5.
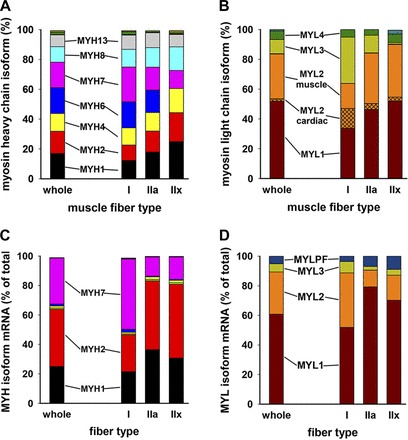
LCM-collected fibers express a mixture of fast and slow myosins. Fiber-specific samples were collected by LCM in triplicate, homogenized, trypsinized, and subjected to MS. A and B: relative amounts of uniquely identified isoform fragments for myosin heavy and light chains. Major isoforms are shown next to the corresponding color. Small amounts of MYH14, MYH15, and MYH16 were detected and are represented as small stacks at the top of the bars in A. Similarly, in B, small amounts of phosphorylatable myosin light chain are displayed as unlabeled blue stacks at the top of the “whole” and IIx bars. In B, MYL2 expression is divided into “MYL2 cardiac” (cross-hatched) and “MYL2 muscle” within the orange color stack. C and D: data from corresponding samples subjected to next-generation sequencing (see materials and methods). Data represent 4 samples obtained by LCM from sections of a muscle specimen from a normal control subject. RNA was isolated from ∼300 transversely cut fibers making up a total cross-sectional area of 2.0 mm2.
Myosin heavy and light chains from type I, IIa, or IIx muscle fibers were detected by MS (Fig. 5, A and B). Each sample was subjected to PAGE, and gel bands were excised at 220 and 15–25 kDa and processed for MS analysis for myosin heavy and light chains, respectively. Identification of proteins in gel slices was particularly important for identification of the light chains, because MS measures the most abundant peptides in each sample. Since smaller proteins have a smaller number of peptide fragments, many more of the peptides from lower-molecular-weight proteins (such as myosin light chains) were identified when samples were not diluted by large numbers of peptide fragments from the many large-molecular-weight proteins seen in muscle homogenates. Figure 5, A and B, shows the relative amounts of the myosin heavy and light chains. The protein distribution is quite different from the mRNA relative expression data (see below; Fig. 5, C and D). In Fig. 5A, the MYH7 (pink) gene protein product is the most highly expressed in type I fibers, but MYH7 protein is seen in all three fiber types. MYH1 (black), MYH2 (red), and MYH4 (yellow) protein products account for 70% of the type IIx fiber heavy chain content; MYH1 is the most highly expressed gene in type IIa and IIx fibers. MYH6 protein (blue), also called cardiac α-myosin heavy chain, is seen in type I and IIa, but not type IIx, fibers (Fig. 5A). Myosin light chain data (Fig. 5B) show that MYL1 (brown) is the predominant myosin light chain in all three fiber types, with higher abundance in type IIa and IIx fibers. Immunoblots from Fig. 2 correlate MYL1 protein abundance with fast muscle type. Figure 2 also shows that MYL3 protein was expressed more highly in slow muscle type, and “slow” MYL3 (light green in Fig. 5B) abundance is higher in type I fibers as expected. MYL2 proteins were identified by MS as three MYL2 types: MYL2 skeletal muscle, MYL2 cardiac, and MYL2 atrial. MYL2 cardiac (cross-hatched orange) is most highly expressed in type I fibers, whereas MYL2 skeletal muscle (non-cross-hatched orange) is more highly expressed in type II fibers. Trace amounts of MYL2 atrial are rarely detected (data not shown).
RNA was collected as described above, and RNA was converted to cDNA by reverse transcriptase and amplified before fragmenting and sequencing. The next-generation sequencing results are shown in Fig. 5C for myosin heavy chain genes and in Fig. 5D for myosin light chain genes. The representative whole muscle sample is designated “total.” In these assays, trace amounts of mRNA for MYH3 (green), MYH4 (yellow), and MYH6 (blue) were observed. MYH1 (black), MYH2 (red), and MYH7 (pink) account for >90% of the mRNA identified. MYH7 represents the majority of myosin heavy chain gene expression in type I fibers. MYH2 mRNA represents >50% of the myosin heavy chain gene expression in type IIx fibers and ∼50% in the type IIa fibers. In Fig. 5D, MYL1 (brown) is the most highly expressed gene across the three fiber types, but MYL2 (orange) and MYL3 (light green) are expressed more in type I fibers.
Myosin heavy chain content of type IIx fibers is consistent in muscle of very different overall fiber composition.
LCM-collected specific fiber content samples were obtained from microscope slides for each muscle specimen over a wide spectrum of type I fiber content. Each fiber sample was electrophoresed in SDS-PAGE, and gel bands were collected for MS analysis. The hypothesis that drove these studies was that fibers of each type would have consistent myosin heavy and light chains that are characteristic of the fiber type.
Data from MS analysis of heavy and light chain isoforms in LCM-purified fiber samples from each subject are shown in Fig. 6. We found that type IIx fiber content of myosin heavy and light chain isoforms was fairly consistent (Fig. 6, C and F), regardless of the proportion of type IIx fibers across the spectrum of fiber composition in the subjects shown in Fig. 3. The myosin isoform content of type I fibers (Fig. 6, A and D) was somewhat more variable but consistently contained >50% MYH6 and MYH7. Figure 7 shows a summary of the data from Fig. 6. The bars labeled “high” represent the average expression of myosin heavy chain isoforms for the subjects with 82%, 68%, and 50% type I fibers; the “low” bars are the mean data from the LCM-obtained fiber samples of the subjects with 34%, 14%, and 12% type I fibers in the intact muscle. Type IIx fibers contained similar portions of MYH1, MYH2, MYH4, and MYH8 (90–98%), independent of the percentage of the fibers present in the original muscle biopsy. Type I fibers contained 56% and 59% of the combination of MYH6 (blue) and MYH7 (pink) isoforms in the high and low groups, respectively. Myosin heavy chain isoform content of type IIa fibers resembled that of type I fibers in the high group and resembled that of type IIx fibers in the low group.
Fig. 6.
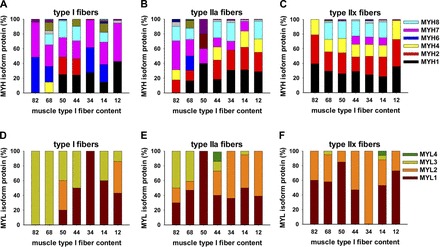
LCM-obtained muscle fiber-specific samples from diverse subjects show content of myosin heavy and light chain isoforms in type I, IIa, and IIx fibers. Colored bars show individual subject biopsy fiber type samples analyzed by MS to quantify myosin heavy and light chain isoforms. Data were obtained from slides of muscle biopsies from the same individuals that were used in whole muscle MS studies in Fig. 3.
Fig. 7.
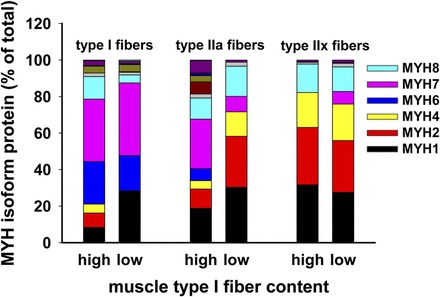
Specific fiber specimens show that only type IIx fiber has consistent myosin heavy chains content across a variety of type I fiber content muscle biopsies. Muscle sections from each of the specimens across a wide spectrum of type I fiber content shown in Figs. 3 and 6 were subjected to LCM to obtain pure fiber type samples. The hypothesis that type I fibers would have a specific and characteristic myosin heavy and light chain content whether the total number of type I fibers was predominant or in the minority was refuted. This is most clear when the extremes are compared (12% vs. 82% type I fiber content), where type IIx fibers are similar, but type I fibers at the extremes are more variable, although the content of MYH6 and MYH7 is the same. Unlabeled stack colors at the top of each bar represent small amounts of MYH13, MYH14, MYH15, and MYH16.
DISCUSSION
Muscle from volunteers with high type I fiber content contained a predominance of MYH7 mRNA and protein, whereas muscle with very low type I fiber content contained more MYH1 and MYH2 mRNA and protein. Content of myosin heavy and light chain proteins was quantified in individual fiber type samples from these subjects. The “fast-twitch” isoforms MYH1, MYH2, and MYH4 were similarly expressed across all three human fiber types, I, IIa, and IIx. However, MYH7 and MYH6 were essentially absent in type IIx fibers, present in IIa fibers, and predominant in type I fibers.
Vanderburg and Clarke (16) recently reported the use of LCM to isolate RNA from specific fibers of rat gastrocnemius, but the use of LCM to identify myosin isoforms in human muscle has not been reported. Vanderburg and Clarke identified fiber type by pH dependency of ATPase and were able to isolate high-quality RNA to be used in quantitative PCR analysis of atrophy-related genes. Most of their LCM equipment and tissue sectioning and RNA isolation techniques were similar to ours. However, in our laboratory, RNA isolated from stained sections was frequently degraded, causing us to perform the more laborious technique of sequential alternate section staining when RNA was to be isolated from the LCM-collected samples.
Skeletal muscle fiber type composition is important for reasons beyond athletic performance because of its connection with insulin resistance and diabetes. In a recent retrospective data analysis of 50 participants who underwent euglycemic clamps and muscle biopsies, we reported a positive correlation between the percentage of type I muscle fibers and insulin responsiveness (13). Nyholm et al. (7) reported a similar correlation nearly 20 years ago.
Exercise-induced shift in skeletal muscle fiber composition is a complex process that involves turning off genes that maintain the proportion of myosin heavy and light chains that make up the contractile apparatus of the initial fiber and activating genes that code for a different mixture of myosins that constitute the new fiber characteristics. In addition to the change in myosin heavy and light chains that form the contractile complexes, other systems, including mitochondrial numbers and the protein synthetic pathways involved in fiber hypertrophy, are substantially modified. Endurance training of healthy young men activates AMP-dependent protein kinase and increases peroxisome proliferator-activated receptor-γ coactivator-1α in muscle, driving an increase in mitochondria (1). In contrast, resistance training in normal subjects causes phosphorylation and activation of mammalian target of rapamycin and, subsequently, S6K1, initiating protein translation and, eventually, resulting in fiber hypertrophy (1).
We found that many myosin isoforms are expressed at varying amounts across all three fiber types, but a select few are not present in type IIx fibers. The perinatal myosin heavy chain MYH8 is seen in all fibers across all of our subjects with a wide spectrum of muscle fiber composition. MYH8 protein represents an average of 12% of the total myosin heavy chain proteins. MYH1 is also present across the three fiber types in all subjects but is higher in type IIx fibers and lower in type I fibers. Type IIx fibers in all subjects, regardless of the type IIx percentage of the total fiber count, contain very consistent proportions of MYH1 (30%), MYH2 (30%), and MYH4 (20%), which, together with MYH8, account for 95% of the type IIx content of myosin heavy chains. A dominant combination of MYH6 and MYH7 is characteristic of type I fibers, accounting for 58% of the total myosin heavy chain proteins. Little or no MYH6 or MYH7 is expressed in type IIx fibers in our subjects.
Do the many myosin isoforms in skeletal muscle determine the classical fiber types? The model we propose may explain this puzzle. We suggest that many of the myosin heavy chain isoforms expressed in skeletal muscle play little or no role in determining the fiber types. Rather, the type I fiber ATPase pH optimum of 4.6 is attributed to a complex of MYH6 and MYH7, accompanied by MYL3. Even though MYH1, MYH2, MYH4, and MYH8 may be present in type I or IIx fibers, they may not play a role in the specificity of the fiber type determination. We speculate that the fiber type IIx ATPase pH optimum of 9.4 is the default in the absence of MYH6 and MYH7. The pH optimum of 9.4 in fast-twitch fibers is determined by a complex of MYH1, MYH2, MYH4, and MYH8, together with MYL2, a skeletal muscle isoform in which no slow-twitch isoforms are present. Type IIa fibers, which are characterized by a mixture of the two colors from the two monoclonal antibodies in the method of Behan et al. (2), contain both of these complexes, which are characteristic of type I or IIx fibers. Each thick filament of the sarcomere comprises multiple molecules of myosin heavy chains, probably intertwined, like a rope. We propose that the fiber-specific characteristic ATPase pH 9.4 staining that distinguishes type II fibers histologically is due to the content of one or more of MYH1, MYH2, MYH4, and MYH8 proteins and that the presence of MYH6 and MYH7 shifts the pH optimum to 4.3.
These data suggest that MYH1, MYH2, and MYH4 proteins are “generic” and are present in all fiber types. These predominate in individuals with very few type I fibers, simply because there are more type IIx fibers, each of which has a higher content of MYH1, MYH2, and MYH4. In contrast, type IIx fibers contain little or no MYH6 or MYH7 protein, suggesting that MYH6 and MYH7 are characteristic of type I fibers or of the type IIa fibers that are transitioning between type IIx and type I.
Myosin light chain data are analogous to the heavy chain data. MYL1 has its highest expression in type IIx fibers but is present in nearly all type IIa and I fibers. MYL3 protein is almost nonexistent in type IIx fibers, is expressed in some type IIa samples, but is present in almost every type I fiber sample, regardless of the overall fiber composition of the subject from whom the LCM sample was obtained. This suggests that MYL3 is also essential for the slow-twitch phenotype of type I fibers.
We propose that the default muscle fiber type phenotype is “fast-twitch.” To convert from type IIx to type I, a muscle cell must express MYH6, MYH7, and MYL3 and transition through the mixed type IIa fiber phenotype. Conversely, for a type IIa fiber to become type IIx, it must stop producing MYH6, MYH7, and MYL3 proteins.
GRANTS
These studies were funded in part by National Institutes of Health Grants DK-080488 and CO6 RR-0306551 to East Tennessee State University and by grants from the East Tennessee State University Research Development Committee.
DISCLOSURES
No conflicts of interest, financial or otherwise, are declared by the authors.
AUTHOR CONTRIBUTIONS
C.A.S., W.L.S., M.F.B., and M.H.S. developed the concept and designed the research; C.A.S., W.L.S., M.E.H., M.F.B., H.K.H., A.L.G., and M.H.S. performed the experiments; C.A.S., W.L.S., M.F.B., H.K.H., A.L.G., and M.H.S. analyzed the data; C.A.S., W.L.S., M.F.B., H.K.H., and M.H.S. interpreted the results of the experiments; C.A.S. prepared the figures; C.A.S. drafted the manuscript; C.A.S., W.L.S., M.E.H., M.F.B., H.K.H., A.L.G., and M.H.S. edited and revised the manuscript; C.A.S., W.L.S., M.E.H., M.F.B., H.K.H., A.L.G., and M.H.S. approved the final version of the manuscript.
ACKNOWLEDGMENTS
The authors thank undergraduate and graduate students from the Department of Exercise and Sport Science and students from the Quillen College of Medicine who assisted in previous projects that were the sources of the materials studied in this report. The authors also thank research nurses Mary Ward and Susie Whittaker, who contributed to these prior studies.
REFERENCES
- 1.Baar K. Training for endurance and strength: lessons from cell signaling. Med Sci Sports Exerc 38: 1939–1944, 2006. [DOI] [PubMed] [Google Scholar]
- 2.Behan WM, Cossar DW, Madden HA, McKay IC. Validation of a simple, rapid, and economical technique for distinguishing type 1 and 2 fibres in fixed and frozen skeletal muscle. J Clin Pathol 55: 375–380, 2002. [DOI] [PMC free article] [PubMed] [Google Scholar]
- 3.Fodor WL, Darras B, Seharaseyon J, Falkenthal S, Francke U, Vanin EF. Human ventricular/slow twitch myosin alkali light chain gene characterization, sequence, and chromosomal location. J Biol Chem 264: 2143–2149, 1989. [PubMed] [Google Scholar]
- 4.Griffin NM, Yu J, Long F, Oh P, Shore S, Li Y, Koziol JA, Schnitzer JE. Label-free, normalized quantification of complex mass spectrometry data for proteomic analysis. Nat Biotechnol 28: 83–89, 2010. [DOI] [PMC free article] [PubMed] [Google Scholar]
- 5.Layne AS, Nasrallah S, South MA, Howell ME, McCurry MP, Ramsey MW, Stone MH, Stuart CA. Impaired muscle AMPK activation in the metabolic syndrome may attenuate improved insulin action after exercise training. J Clin Endocrinol Metab 96: 1815–1826, 2011. [DOI] [PMC free article] [PubMed] [Google Scholar]
- 6.Mukherjee S, Rodriguez-Canales J, Hanson J, Emmert-Buck MR, Tangrea MA, Prieto DA, Blonder J, Johann DJ Jr. Proteomic analysis of frozen tissue samples using laser capture microdissection. Methods Mol Biol 1002: 71–83, 2013. [DOI] [PubMed] [Google Scholar]
- 7.Nyholm B, Qu Z, Kaal A, Pedersen SB, Gravholt CH, Andersen JL, Saltin B, Schmitz O. Evidence of an increased number of type IIb muscle fibers in insulin-resistant first-degree relatives of patients with NIDDM. Diabetes 46: 1822–1828, 1997. [DOI] [PubMed] [Google Scholar]
- 8.Schiaffino S. Fibre types in skeletal muscle: a personal account. Acta Physiol (Oxf) 199: 451–463, 2010. [DOI] [PubMed] [Google Scholar]
- 9.Stuart CA, Howell ME, Baker JD, Dykes RJ, Duffourc MM, Ramsey MW, Stone MH. Cycle training increased GLUT4 and activation of mammalian target of rapamycin in fast twitch muscle fibers. Med Sci Sports Exerc 42: 96–106, 2010. [DOI] [PMC free article] [PubMed] [Google Scholar]
- 10.Stuart CA, Howell ME, Cartwright BM, McCurry MP, Lee ML, Ramsey MW, Stone MH. Insulin resistance and muscle insulin receptor substrate-1 serine hyperphosphorylation. Physiol Rep 2: 1–8, 2014. [DOI] [PMC free article] [PubMed] [Google Scholar]
- 11.Stuart CA, Howell ME, Zhang Y, Yin D. Insulin-stimulated translocation of glucose transporter (GLUT) 12 parallels that of GLUT4 in normal muscle. J Clin Endocrinol Metab 94: 3535–3542, 2009. [DOI] [PMC free article] [PubMed] [Google Scholar]
- 12.Stuart CA, Howell ME, Yin D. Overexpression of GLUT5 in diabetic muscle is reversed by pioglitazone. Diabetes Care 30: 925–931, 2007. [DOI] [PubMed] [Google Scholar]
- 13.Stuart CA, McCurry MP, Marino A, South MA, Howell ME, Layne AS, Ramsey MW, Stone MH. Slow-twitch fiber proportion in skeletal muscle correlates with insulin responsiveness. J Clin Endocrinol Metab 98: 2027–2036, 2013. [DOI] [PMC free article] [PubMed] [Google Scholar]
- 14.Stuart CA, South MA, Lee ML, McCurry MP, Howell ME, Ramsey MW, Stone MH. Insulin responsiveness in metabolic syndrome after eight weeks of cycle training. Med Sci Sports Exerc 45: 2021–2029, 2013. [DOI] [PMC free article] [PubMed] [Google Scholar]
- 15.Stuart CA, Yin D, Howell MEA, Dykes RJ, Laffan JJ, Ferrando AA. Hexose transporter mRNAs for GLUT4, GLUT5, and GLUT12 predominate in human muscle. Am J Physiol Endocrinol Metab 291: E1067–E1073, 2006. [DOI] [PubMed] [Google Scholar]
- 16.Vanderburg CR, Clarke MS. Laser capture microdissection of metachromatically stained skeletal muscle allows quantification of fiber type specific gene expression. Mol Cell Biochem 375: 159–170, 2013. [DOI] [PubMed] [Google Scholar]
- 17.Weiss A, McDonough D, Wertman B, Acakpo-Satchivi L, Montgomery K, Kucherlapati R, Leinwand L, Krauter K. Organization of human and mouse skeletal myosin heavy chain gene clusters is highly conserved. Proc Natl Acad Sci USA 96: 2958–2963, 1999. [DOI] [PMC free article] [PubMed] [Google Scholar]


