

Abstract
OBJECTIVES
To describe the development of the Pittsburgh Fatigability Scale (PFS) and establish its reliability and concurrent and convergent validity against performance measures.
DESIGN
Cross-sectional.
SETTING
University of Pittsburgh, Pittsburgh, Pennsylvania.
PARTICIPANTS
Scale development sample: 1,013 individuals aged 60 and older from two registries; validation sample: 483 adults aged 60 and older from the Baltimore Longitudinal Study of Aging (BLSA).
MEASUREMENTS
The scale development sample and BLSA participants self-administered an initial 26-item perceived fatigability scale. BLSA participants also completed measures of performance fatigability (perceived exertion from a standard treadmill task and performance deterioration from a fast-paced long-distance corridor walk), a 6-m usual-paced corridor walk, and five timed chair stands.
RESULTS
Principal components analysis with varimax rotation reduced the 26-item scale to the 10-item PFS. The PFS showed strong internal consistency (Cronbach’s alpha 0.88) and excellent test–retest reliability (intraclass correlation 0.86). In the validation sample, PFS scores, adjusted for age, sex, and race, were greater for those with high performance fatigability, slow gait speed, worse physical function, and lower fitness, with differences between high and low fatigability ranging from 3.2 to 5.1 points (P < .001).
CONCLUSION
The 10-item PFS physical fatigability score is a valid and reliable measure of perceived fatigability in older adults and can serve as an adjunct to performance- based fatigability measures for identifying older adults at risk of mobility limitation in clinical and research settings.
Keywords: fatigue, fatigability, performance measures, validation, mobility
Perceived global fatigue, the overall subjective lack of physical or mental energy, is associated with poor mobility, functional limitations, and mortality.1–7 Prevalence rates for perceived global fatigue vary widely, from 5% to 68% depending on the assessment tool, characteristics of the study population, and the cut points used to differentiate fatigued from nonfatigued persons. 1,3,8,9 The considerable variation in prevalence rates make it difficult to assess fatigue in older adults or to understand its role in the disablement pathway.
The concept of fatigability classifies fatigue in relation to a defined activity of a specific intensity and duration. This conceptualization offers a potentially less-biased, more-objective approach to measuring the degree to which fatigue limits someone physically.1,2 This is especially important in studies of older adults, who in an effort to reduce or avoid fatigue, may modify their exertion level (e.g., slow down or shorten task duration) to maintain a tolerable effort (engage in self-pacing).2,10
There is no validated self-report tool to measure perceived fatigability in older adults.2 A few scales measure fatigue levels of older adults in the context of activity participation, but none specifically normalize activities in terms of intensity and duration.11–14 Two performance-based measures of fatigability, one that assesses performance deterioration over a standardized walking distance of 400-m and another that assesses perceived exertion after a 5-minute treadmill walk, have recently been validated,15,16 but these tests require trained staff and an in-person assessment, which can be costly and time consuming and may be too challenging for very old or frail adults.
This report describes the development of the Pittsburgh Fatigability Scale (PFS) and establishes its reliability, concurrent validity against two measures of performance fatigability, and its convergent validity for mobility, physical function, and fitness.
METHODS
Initial 26-Item Scale and Instructions for Administration
A 26-item perceived fatigability scale (Table 2) was initially developed with the a priori intention of using factor analysis to reduce the number of items. Items were chosen from four activity categories to minimize floor and ceiling effects: social (n = 4), sedentary (≤1.5 metabolic equivalents (METS), n = 7), lifestyle or light-intensity (1.6–2.9 METS, n = 6), and moderate to high-intensity (≥3.0 METS, n = 9). Initial activities were selected because of high frequency of participation in the Health, Aging and Body Composition Study17 and the Lifestyle Interventions and Independence for Elders Pilot Study.18 Wording was based on the Community Healthy Activities Model Program for Seniors physical activity questionnaire19 and the Situational Fatigue Scale.13
Table 2.
Pittsburgh Fatigability Scale Items, Varimax Rotated Component Loadings for the Physical Fatigability Score to Reduce the 26-Items to 10-Items, Percentages of Variance Explained and Frequency of Performing Each Activity
| Components and Items | Loading | Variance Explained | Reporting Performing Activity in Past Month, % |
|---|---|---|---|
| Moderate- to high-intensity activity (≥3 METS) | 26.8 | ||
| High-intensity activity for 30 minutesa | 0.852 | 31.0 | |
| Moderate- to high-intensity strength training for 30 minutesa | 0.851 | 27.7 | |
| Brisk or fast walk for 1 houra | 0.838 | 17.2 | |
| Dancing for 30 minutes | 0.774 | 11.1 | |
| Heavy gardening or yard work for 1 houra | 0.762 | 53.6 | |
| Brisk or fast walk for 30 minutes | 0.750 | 45.7 | |
| Heavy or major household activity for 30 minutes | 0.741 | 37.0 | |
| Moderate-intensity activity for 30 minutes | 0.692 | 45.5 | |
| Moderate household activity for 30 minutes | 0.424 | 89.2 | |
| Social activity | 17.2 | ||
| Participating in a social activity for 1 houra | 0.717 | 93.8 | |
| Hosting a social event for 1 houra | 0.685 | 44.4 | |
| Attending a club or group meeting for 1 hour | 0.621 | 74.9 | |
| Attending a concert, lecture, movie or sporting event for 2 hours | 0.616 | 74.1 | |
| Sedentary activity (≤1.5 METS) | 14.7 | ||
| Watching TV for 2 hoursa | 0.810 | 89.6 | |
| Sitting quietly for 1 houra | 0.799 | 71.7 | |
| Reading for 1 hour | 0.688 | 94.0 | |
| Doing paperwork for 1 hour | 0.653 | 92.0 | |
| Having a verbal conversation for 1 hour | 0.602 | 84.2 | |
| Using a computer for 1 hour | 0.577 | 80.0 | |
| Driving a vehicle for 1 hour | 0.345 | 80.6 | |
| Lifestyle or light-intensity activity (1.6–2.9 METS) | 12.3 | ||
| Leisurely walk for 30 minutesa | 0.742 | 81.4 | |
| Light household activity for 1 houra | 0.734 | 91.4 | |
| Leisurely walk for 1 hour | 0.607 | 44.7 | |
| Light-intensity activity for 30 minutes | 0.522 | 99.6 | |
| Shopping for 1 hour | 0.442 | 89.4 | |
| Light-intensity strength training for 30 minutes | 0.185 | 47.4 |
METS = metabolic equivalents.
Items included in final 10-item Pittsburgh Fatigability Scale.
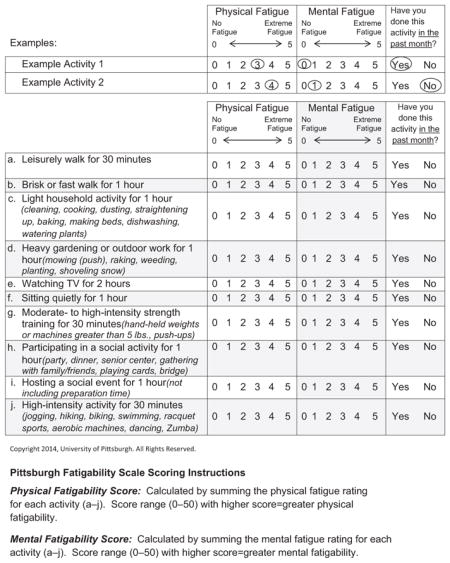
Respondents provided answers to three questions for each activity. The first two were to rate the level of physical and mental fatigue from 0 (no fatigue) to 5 (extreme fatigue) that they expected to feel immediately after completing each activity. The third asked “Did you do this activity in the past month?” The instructions asked respondents to rate physical and mental fatigue even if they had not performed the activity in the past month, and participants were prompted to pay careful attention to the intensity and duration of each activity.
Scale Development and Validation Samples
One thousand thirteen adults aged 60 and older were recruited from two registries maintained at the University of Pittsburgh to complete the initial 26-item scale and submit it through the mail. To assess reliability, respondents were invited to repeat the scale approximately 4 weeks later.
Participants (n = 483) aged 60 and older enrolled in the Baltimore Longitudinal Study of Aging (BLSA) also completed the 26-item scale as part of their regularly scheduled 2- to 3-day comprehensive visit, which included a battery of physical performance measures.
Performance Fatigability and Physical Performance Measures Collected in the Validation Sample
Two validated measures of performance fatigability—perceived exertion after a standard task and performance deterioration15—were measured in the BLSA validation sample. Perceived exertion was determined after a 5-minute treadmill walk at 1.5 miles per hour (0.67 m/s) and 0% grade. Immediately after the walk, participants assessed their rating of perceived exertion using the Borg scale (range 6–20;20 high fatigability ≥10, low fatigability ≤915). Performance deterioration (slowing down) was assessed during a 400-m long-distance corridor walk (LDCW), done as quickly as possible.15 The walk included ten 40-m lap segments for which split times were recorded. Participants whose Lap 9 time was at least 6.5% slower than the Lap 2 time or who were unable to complete the 400-m walk were classified as having high performance deterioration.15
Mobility was defined as the fastest (m/s) of two usual-paced 6-m walking tests, with slow gait speed classified as less than 1.0 m/s.21 Physical function was measured according to time needed to complete five chair stands, with worse physical function defined as the highest quartile (>13.58 seconds). Time to complete the 400-m walk from the fast-paced component of the LDCW was used as a measure of fitness, with participants in the highest quartile (≥307.1 seconds) classified as having lower fitness.22,23
Potential Confounders
Sociodemographic factors reported on the questionnaire for both samples included age, sex, and race, coded as black or nonblack for analyses. Behavioral factors thought to affect fatigability, including body mass index (weight in kg/height in m2), reported walking difficulty, use of an assistive device, health rating, medical history, and current physical activity level, were also ascertained according to self-report.
Statistical Analyses
Principal component factor analysis with a varimax rotation was used to reduce the number of items for the final PFS. The reduced 10-item PFS was scored by summing all activity items for physical and mental fatigue separately, yielding physical and mental fatigability scores ranging from 0 to 50, with higher scores indicating greater fatigability. This article focuses on the validation of physical fatigability only, so PFS score refers to the physical fatigability score.
Linear regression was used to examine the proportion of variance in the 26-item scale that the final PFS explained. Reliability (internal consistency) of the final PFS was measured using Cronbach’s alpha. Test–retest reliability (intraclass correlation coefficient) was examined for those who agreed to participate in the reproducibility study and had returned complete data for a second PFS within 30 days of the first (n = 352, mean ± standard deviation 26.0 ± 2.8 days).
Least squared means (standard error) adjusted for age, sex, and race were used to examine the concurrent (how the scale correlates with a previously validated measure) and convergent (degree to which two measures that theoretically should be related are in fact related) validity of the ability of the PFS to differentiate between individuals with high and low performance fatigability, faster and slower gait speed, better and worse physical function, and better and worse fitness. Separate logistic regression models were used to generate receiver operating characteristic curves to determine how well the PFS correctly classified someone as having high performance fatigability, slow gait speed, worse physical function, or lower fitness.
The interaction term between the number of “no” responses and PFS score in relation to performance fatigability was tested to determine whether the number of “no” responses to the question “Did you do this activity in the past month” affected the convergent validity of the PFS score. In addition, the relationship between the number of “no” responses and PFS scores stratified according to high and low perceived exertion was examined.
The final analytical sample for the scale development cohort was 740, with 73% of the total sample (n = 1,013) returning a completed 26-item scale. For the BLSA validation cohort, the final analytical sample was 467, with 3% having incomplete data for the final PFS. Analyses were conducted using SAS version 9.2 (SAS Institute, Inc., Cary, NC).
RESULTS
Demographic Characteristics of the Scale Development and Validation Samples
Population characteristics for the scale development and validation samples are presented in Table 1. The BLSA validation sample was slightly older, had fewer women and more blacks, was less likely to report use of a cane or have difficulty walking one-quarter of a mile, and had a higher frequency of current physical activity level at the moderate level and above than the scale development sample (P < .05).
Table 1.
Participant Characteristics of the Scale Development and Validation Samples
| Characteristic | Scale Development Sample, n = 740 | Validation Sample, n = 467 |
|---|---|---|
| Age, mean ± SD | 71.9 ± 6.4 | 74.3 ± 8.2 |
| Female, n (%) | 739 (58.7) | 240 (51.4) |
| White, n (%) | 703 (95.0) | 323 (66.2) |
| Body mass index, kg/m2, mean ± SD | 27.2 ± 5.0 | 27.4 ± 4.6 |
| Self-report of good or better health rating, n (%) | 664 (90.5) | — |
| Self-report of current treatment for depression, n (%) | 53 (7.5) | — |
| Self-report of current treatment for cancer, n (%) | 80 (10.8) | — |
| Use of cane, n (%) | 70 (9.5) | 27 (5.6) |
| Difficulty walking one-quarter of a mile, n (%) | 215 (29.1) | 26 (5.6) |
| Self-report of current moderate to vigorous physical activity, n (%) | 327 (45.3) | 271 (58.0) |
SD = standard deviation.
Establishment of the 10-Item PFS
Four components with eigenvalues greater than 1 were extracted from the initial factor analysis after varimax rotation, which accounted for 71.0% of the variance (Table 2). The rotated pattern was used for item reduction according to the following steps. For the moderate- to high-intensity activities, three items had loading factors greater than 0.80 (high-intensity activity for 30 minutes, moderate- to high-intensity strength training for 30 minutes, brisk or fast walking for 1 hour). Because this domain explained the most variance (26.8%), a fourth item from this factor was included. Heavy gardening or yard work for 1 hour was selected over dancing for 1 hour because it was more frequently performed (53.6%) than dancing (11.1%). Visual inspection of the loading factors for the other three domains revealed clear breakpoints (Table 2), and two items from each were included: social activities (participating in a social activity for 1 hour, hosting a social event for 1 hour), sedentary activities (watching television for 2 hours, sitting quietly for 1 hour), and lifestyle or light-intensity activities (leisurely walk for 30 minutes, light household activity for 1 hour). Regression analysis revealed that the 10-item PFS physical fatigability score explained 95.3% of the variance in the 26-item PFS physical fatigability score. The final 10-item PFS (Appendix) showed strong internal consistency, with a Cronbach’s alpha of 0.88 and excellent test–retest reliability, with an intraclass correlation of 0.86.
Validation of PFS Against Performance Fatigability, Mobility, Physical Function, and Fitness
Age-, sex-, and race-adjusted PFS scores were significantly greater for those exhibiting high fatigability, with the largest difference (5.1 points) for high perceived exertion (P < .001) (Table 3). Furthermore, area under the curve (AUC) values (Table 3) indicated good overall discrimination of the PFS score for correctly classifying persons with high performance fatigability (AUCs 0.68–0.73, P < .001).
Table 3.
Concurrent and Convergent Validity of the Pittsburgh Fatigability Scale Physical Fatigability Score with Performance Fatigability, Mobility, Physical Function, and Fitness
| Performance Measure | Adjusted Physical Fatigability Score Mean (Standard Error)a | Adjusted Mean Difference | P-Value | Area Under the Receiver Operating Characteristic Curve (95% Confidence Interval) | |
|---|---|---|---|---|---|
| Yes | No | ||||
| High perceived exertion (n = 123, 27%)b | 18.3 (1.7) | 13.2 (1.5) | 5.1 | <.001 | 0.73 (0.68–0.79) |
| High performance deterioration (n = 82, 18.1%)c | 17.3 (1.8) | 14.2 (1.6) | 3.1 | <.001 | 0.68 (0.61–0.74) |
| Slow gait speed (n = 101, 21.9%)d | 17.3 (1.7) | 13.8 (1.6) | 3.5 | <.001 | 0.76 (0.68–0.84) |
| Worse physical function (n = 111, 25%)e | 16.6 (1.7) | 13.3 (1.6) | 3.2 | <.001 | 0.67 (0.61–0.73) |
| Lower fitness (n = 117, 25%)f | 17.4 (1.6) | 12.3 (1.6) | 5.1 | <.001 | 0.74 (0.69–0.80) |
Adjusted for age, sex, and race.
Defined as rating of perceived exertion ≥10 at the end of 5-minute treadmill walk at 0.67 m/s.
Defined as ≥6.5% slower lap time between Laps 9 and 2 from the long-distance corridor walk.
Usual gait-speed <1.0 m/s from fastest of two 6-m walks.
Highest quartile (>13.58 s) of time to complete five chair stands.
Highest quartile (≥307.1 s) of time to complete fast-paced 400-m walk.
PFS scores, adjusted for age, sex, and race, were also significantly greater for those with slow gait speed, worse physical function, and lower fitness, with differences ranging from 3.2 to 5.1 points (P < .001) (Table 3). The AUC values also confirmed the good discrimination of the PFS score to correctly classify these older adults, with AUCs ranging from 0.67 to 0.76 (P < .001).
There was no significant effect of the interaction between PFS score and total number of “no” responses (P = .76) on perceived exertion. In addition, there was no relationship between the number of “no” responses and PFS score when stratified according to high (P = .94) and low (P = .20) perceived exertion.
DISCUSSION
The 10-item PFS appears to be a valid and reliable measure of perceived fatigability in older adults. In the validation sample, total PFS physical fatigability score was closely associated with reported exertion at the end of a standard task and with measures of walking performance. PFS score was strongly associated with a validated performance- based measure of physical fitness—the 400-m component of the LDCW.
These findings support the concept that greater fatigability during higher-demand tasks is a reflection of poorer fitness, which scales of global or general fatigue would not detect because of their inherent pitfall of self-pacing bias. For example, two older adults may report the same fatigue level over the past week despite one leading a very active lifestyle while the other is sedentary and functionally impaired. Although they may rate their tiredness or energy level (perceived global fatigue level) the same, the stimulus required to initiate fatigue differs dramatically. Fatigue can be better understood from a pathophysiological perspective only when the intensity and duration of fatigue-inducing activity is considered.
There is a need to assess fatigue more objectively in older populations, and the advancement of the concept of fatigability represents a major step forward.1,2 The PFS improves upon and overcomes deficiencies in existing self-report tools such as the Situational Fatigue Scale,13 on which the PFS was modeled. The Situational Fatigue Scale was validated in a sample aged 18 to 60 (mean 31.1), includes activities that older adults do not commonly perform (e.g., jogging, playing ball), and does not normalize activities to an intensity level.13 Other measures of fatigability 15,16,24 are performance-based, thus requiring in-person visits, dedicated space, and staff, which may not be practical for many research and clinical settings. Thus, the self-report, self-administered PFS provides a strong and useful alternative measure of fatigability when it is not feasible to capture performance-based fatigability.
Strengths of the PFS are that it includes activities that older adults commonly perform that span from sedentary to moderate- and high-intensity. Plus, all activities are normalized to a specific intensity and duration. An important feature of the PFS is that all persons, even those who have not performed a particular activity recently, are asked to estimate how they feel or would feel if they attempted the activity. This element also helps to minimize bias due to selective reduction in activity participation. Whether performing an activity would affect scale validity was tested, and it was found that the number of “no” responses (“imagining” fatigue levels) had no effect on the convergent validity of the PFS. It is recommended that this feature of the scale be retained until further longitudinal validation is performed. Finally, because perceived fatigability is a multidimensional construct,25 the ability to distinguish physical from mental fatigability would fill another important gap in knowledge.2 It was that found the same 10 items from the physical fatigability scale score also loaded the highest for mental fatigability. Future work will address approaches to validate the mental fatigability scale.
A limitation of this work is that the scale development sample came from older adult research registries, which may be prone to selection and response bias and thus may not be representative of the general older adult population. Also, there was a lack of minority participation in the scale development sample, but the validation sample, which included more than 30% blacks, mitigated this. Furthermore, 27% of returned 26-item scales had missing data, which was not surprising given the large quantity of items and the unknown cognitive status of those that participated through the mail in the scale development sample. In contrast, the validation sample of BLSA participants who attended a clinic visit had only 3% of scales with missing data. Nevertheless, the form developed for the final 10-item scale has been simplified, with clearer graphics and instructions for use as a self-administered tool. Whenever possible, research staff should also carefully review returned forms with respondents for completeness.
In summary, the PFS is a brief, simple tool designed to measure perceived fatigability in older adults that demonstrates high concurrent and convergent validity against measures of performance fatigability, mobility, physical function, and fitness. The PFS can facilitate future work examining the effects of perceived fatigability on outcomes in epidemiological studies, as well as intervention trials, especially those aimed at increasing physical activity. Furthermore, this scale will aid in investigating how fatigability fits in the disablement pathway, particularly how it relates to functional decline. Finally, the PFS can serve as an adjunct to performance-based fatigability measures for identifying older adults at risk of mobility limitation in clinical and research settings.
Acknowledgments
The authors would like to thank the Pittsburgh Claude D. Pepper Older Americans Independence Center Research Registry and the University of Pittsburgh University Center for Social and Urban Research Gerontology Research Registry for approving access to their mailing lists. We also would like to express our thanks to Dr. Basil Eldadah for advancing the concept of fatigability and inspiring us to develop this fatigability scale and to Brittney Lange-Maia, MPH, and Phoebe Handler, BA, BSN, for their important contributions toward the development of this scale. Presented at the Gerontological Society of America Annual Meeting, San Diego, California, November 2012.
This research was funded by Pittsburgh Claude D. Pepper Older Americans Independence Center Developmental Pilot Grant NIH P30 AG024826 and the Intramural Research Program, National Institute on Aging.
APPENDIX. PITTSBURGH FATIGABILITY SCALE
The following questions ask you to indicate the level of physical and mental fatigue (i.e., tiredness, exhaustion) you expect or imagine you would feel immediately after completing each of the ten listed activities.
For each activity (a–j) please circle responses for both physical and mental fatigue between 0 and 5, where “0” equals no fatigue at all and “5” equals extreme fatigue.
In the last column indicate if you have done the activity in the past month. If you answer “No,” please make your best guess for the fatigue questions (see Example 2 below). Please fill out all three columns for every activity even for those that you do not do. Also pay careful attention to the duration (e.g., 30 minutes) and intensity (e.g., moderate, brisk) of each activity.
Footnotes
Conflict of Interest: None.
Author Contributions: Glynn, Santanasto: study concept and design, acquisition of participants and data, analysis and interpretation of data, critical review of manuscript. Simonsick: study concept and design, acquisition and interpretation of data, critical review of manuscript. Boudreau, Beach, Schulz, Newman: study concept and design, interpretation of data, critical review of manuscript.
Sponsor’s Role: None.
References
- 1.Alexander NB, Taffet GE, Horne FM, et al. Bedside-to-bench conference: Research agenda for idiopathic fatigue and aging. J Am Geriatr Soc. 2010;58:967–975. doi: 10.1111/j.1532-5415.2010.02811.x. [DOI] [PMC free article] [PubMed] [Google Scholar]
- 2.Eldadah BA. Fatigue and fatigability in older adults. PM R. 2010;2:406–413. doi: 10.1016/j.pmrj.2010.03.022. [DOI] [PubMed] [Google Scholar]
- 3.Moreh E, Jacobs JM, Stessman J. Fatigue, function, and mortality in older adults. J Gerontol A Biol Sci Med Sci. 2010;65A:887–895. doi: 10.1093/gerona/glq064. [DOI] [PubMed] [Google Scholar]
- 4.Vestergaard S, Nayfield SG, Patel KV, et al. Fatigue in a representative population of older persons and its association with functional impairment, functional limitation, and disability. J Gerontol A Biol Sci Med Sci. 2009;64A:76–82. doi: 10.1093/gerona/gln017. [DOI] [PMC free article] [PubMed] [Google Scholar]
- 5.Hardy SE, Studenski SA. Fatigue and function over 3 years among older adults. J Gerontol A Biol Sci Med Sci. 2008;63A:1389–1392. doi: 10.1093/gerona/63.12.1389. [DOI] [PMC free article] [PubMed] [Google Scholar]
- 6.Mänty M, de Leon CF, Rantanen T, et al. Mobility-related fatigue, walking speed, and muscle strength in older people. J Gerontol A Biol Sci Med Sci. 2012;67A:523–529. doi: 10.1093/gerona/glr183. [DOI] [PubMed] [Google Scholar]
- 7.Hardy SE, Studenski SA. Fatigue predicts mortality in older adults. J Am Geriatr Soc. 2008;56:1910–1914. doi: 10.1111/j.1532-5415.2008.01957.x. [DOI] [PMC free article] [PubMed] [Google Scholar]
- 8.Liao S, Ferrell BA. Fatigue in an older population. J Am Geriatr Soc. 2000;48:426–430. doi: 10.1111/j.1532-5415.2000.tb04702.x. [DOI] [PubMed] [Google Scholar]
- 9.Junghaenel DU, Christodoulou C, Lai J-S, et al. Demographic correlates of fatigue in the US general population: Results from the Patient-Reported Outcomes Measurement Information System (PROMIS) initiative. J Psychosom Res. 2011;71:117–123. doi: 10.1016/j.jpsychores.2011.04.007. [DOI] [PMC free article] [PubMed] [Google Scholar]
- 10.Willis WT, Ganley KJ, Herman RM. Fuel oxidation during human walking. Metabolism. 2005;54:793–799. doi: 10.1016/j.metabol.2005.01.024. [DOI] [PubMed] [Google Scholar]
- 11.Avlund K, Era P, Davidsen M, et al. Item bias in self-reported functional ability among 75-year-old men and women in three Nordic localities. Scand J Soc Med. 1996;24:206–217. doi: 10.1177/140349489602400313. [DOI] [PubMed] [Google Scholar]
- 12.Tiesinga LJ, Dassen TW, Halfens RJ. DUFS and DEFS: Development, reliability and validity of the Dutch Fatigue Scale and the Dutch Exertion Fatigue Scale. Int J Nurs Stud. 1998;35:115–123. doi: 10.1016/s0020-7489(98)00005-4. [DOI] [PubMed] [Google Scholar]
- 13.Yang CM, Wu CH. The situational fatigue scale: A different approach to measuring fatigue. Qual Life Res. 2005;14:1357–1362. doi: 10.1007/s11136-004-5680-0. [DOI] [PubMed] [Google Scholar]
- 14.Fieo RA, Mortensen EL, Rantanen T, et al. Improving a measure of mobility- related fatigue (The Mobility-Tiredness Scale) by establishing item intensity. J Am Geriatr Soc. 2013;61:429–433. doi: 10.1111/jgs.12122. [DOI] [PMC free article] [PubMed] [Google Scholar]
- 15.Simonsick EM, Schrack JA, Glynn NW, et al. Assessing fatigability in mobility-intact older adults. J Am Geriatr Soc. 2014;62:347–351. doi: 10.1111/jgs.12638. [DOI] [PMC free article] [PubMed] [Google Scholar]
- 16.Schnelle JF, Buchowski MS, Ikizler TA, et al. Evaluation of two fatigability severity measures in elderly adults. J Am Geriatr Soc. 2012;60:1527–1533. doi: 10.1111/j.1532-5415.2012.04062.x. [DOI] [PMC free article] [PubMed] [Google Scholar]
- 17.Brach JS, Simonsick EM, Kritchevsky S, et al. The association between physical function and lifestyle activity and exercise in the Health, Aging and Body Composition Study. J Am Geriatr Soc. 2004;52:502–509. doi: 10.1111/j.1532-5415.2004.52154.x. [DOI] [PubMed] [Google Scholar]
- 18.Katula JA, Kritchevsky SB, Guralnik JM, et al. Lifestyle Interventions and Independence for Elders pilot study: Recruitment and baseline characteristics. J Am Geriatr Soc. 2007;55:674–683. doi: 10.1111/j.1532-5415.2007.01136.x. [DOI] [PubMed] [Google Scholar]
- 19.Stewart AL, Mills KM, King AC, et al. CHAMPS physical activity questionnaire for older adults: Outcomes for interventions. Med Sci Sports Exerc. 2001;33:1126–1141. doi: 10.1097/00005768-200107000-00010. [DOI] [PubMed] [Google Scholar]
- 20.Borg G. Borg’s Perceived Exertion and Pain Scales. Champaign, IL: Human Kinetics; 1998. [Google Scholar]
- 21.Cesari M, Kritchevsky SB, Penninx BW, et al. Prognostic value of usual gait speed in well-functioning older people—results from the Health, Aging and Body Composition Study. J Am Geriatr Soc. 2005;53:1675–1680. doi: 10.1111/j.1532-5415.2005.53501.x. [DOI] [PubMed] [Google Scholar]
- 22.Simonsick EM, Montgomery PS, Newman AB, et al. Measuring fitness in healthy older adults: The Health ABC Long Distance Corridor Walk. J Am Geriatr Soc. 2001;49:1544–1548. doi: 10.1046/j.1532-5415.2001.4911247.x. [DOI] [PubMed] [Google Scholar]
- 23.Simonsick EM, Fan E, Fleg JL. Estimating cardiorespiratory fitness in healthy older adults: Treadmill validation of the Long Distance Corridor Walk. J Am Geriatr Soc. 2006;54:127–132. doi: 10.1111/j.1532-5415.2005.00530.x. [DOI] [PubMed] [Google Scholar]
- 24.Buchowski MS, Simmons SF, Whitaker LE, et al. Fatigability as a function of physical activity energy expenditure in older adults. Age (Dordr) 2013;35:179–187. doi: 10.1007/s11357-011-9338-x. [DOI] [PMC free article] [PubMed] [Google Scholar]
- 25.Ream E, Richardson A. Fatigue: A concept analysis. Int J Nurs Stud. 1996;33:519–529. doi: 10.1016/0020-7489(96)00004-1. [DOI] [PubMed] [Google Scholar]