Abstract
We have examined real-time, in situ hybridization detection of target DNA (tDNA) in a buffer solution and in urine using 8 μm-thick lead magnesium niobate–lead titanate (PMN–PT) piezoelectric plate sensors (PEPSs) about 1.1–1.2 mm long and 0.45 mm wide with improved 3-mercaptopropyltrimethoxysilane (MPS) insulation and a new multiple-parabola (>50) resonance peak position fitting algorithm. With probe DNA (pDNA) immobilized on the PEPS surface and by monitoring the first width extension mode (WEM) resonance frequency shift we detected tDNA in real time at concentration as low as 1 × 10⁻¹⁹ M in urine (100 zM) with a signal to noise ratio (SNR) of 13 without DNA isolation and amplification at room temperature in 30 min. The present multiple-parabola fitting algorithm increased the detection of SNR by about 10 times compared to those obtained using the raw data and by about 5 times compared to those obtained using single parabola fitting. The detection was validated by in situ follow-up detection and subsequent visualization of fluorescent reporter microspheres (FRMs) coated with reporter DNA complementary to the tDNA but different from the probe pDNA.
1 Introduction
Cell-free DNA was first discovered by Mandel and Metais1 in 1948 and became increasingly more important when mutant ras gene fragments were discovered in the blood of patients.2,3 Since then, circulating DNA in the blood has been studied extensively for its diagnostic and prognostic association with various cancers such as bladder cancer,4,5 breast cancer,6–9 cervical cancer,10,11 colorectal cancer,12–16 hepatocellular carcinoma,17–20 lung cancer,21–25 lymphoma,26–28 melanoma,29–36 ovarian cancer,37,38 pancreatic cancer,39,40 and prostate cancer.41–46 The passage of circulating DNA through the kidney barrier has been overlooked due to the selectivity of the nephron, and DNA fragments observed in urine have been mostly thought to have originated from organs and tissues of the urogenital tract. More recently, it has been found that low-molecular weight (LMW) DNA fragments from a distant organ could pass through kidneys.47,48 The current standard method for detecting DNA is polymerase chain reaction (PCR). For transrenal DNA detection, PCR has limitations on the amplicon size49 and potential inhibitions by co-isolated factors. Furthermore, the effectiveness of PCR could also be limited by DNA isolation techniques which are mostly utilized for isolating nuclear DNA from intact cells,48 not particularly suitable for isolating short transrenal DNA fragments.36,48,50 It would be desirable to have a real-time, label-free method that can detect transrenal DNA fragments in urine that does not depend on the DNA isolation techniques and is not limited by the lengths of the DNA fragments.
Current genetic detection technologies under development rely on fluorescence,51–53 quartz crystal microbalance (QCM),54,55 electrochemical,56 binding of nano-metal particles,57 surface plasmon resonance (SPR),58 silicon-based microcantilever sensors as well as piezoelectric microcantilever sensors. For DNA detection, nanoparticle amplified QCM exhibited a concentration sensitivity of 1 pM.59 Nanoparticle enhanced SPR exhibits a concentration sensitivity of 10–100 aM.60 The electrochemical methods involving nanofibers and nanotubes also exhibited a concentration sensitivity of about 30 fM.61 Nanowires62–66 and nanotubes67,68 exhibited concentration sensitivity ranging from 100 fM to 1 fM. Microcantilevers coupled to nano-metal particles exhibited 0.01 nM concentration sensitivity.69 Although methods such as QCM, SPR, silicon-based microcantilever sensors as well as lead zirconate titanate (PZT) piezoelectric microcantilver sensors (PEMS)70,71 were label-free, the sensitivity was still many orders of magnitude away from the attomolar (10−18 M) requirement.72 Similarly, the 10−16 M sensitivity achieved by magnetic bead isolation coupled with electrochemical enhancement was not sufficient.73 Nano-scale mechanical imaging by atomic force microscopy (AFM) can differentiate unhybridized single-stranded DNAs (ssDNAs) from hybridized double-stranded DNAs (dsDNAs) at attomolar sensitivity but it required a sophisticated instrument.74 Although a GaN nanowire extended-gate field-effect-transistor could detect attomolar concentrations of the target DNA (tDNA) in situ53 the detection signal (0.2 V) at 10−18 M was not very different from that (0.3 V) at 10−6 M making it unsuitable for DNA quantification. Streptavidin horseradish peroxidase functionalized carbon nanotubes could detect DNA at 10−18 M however it required labeling and was not in situ75 while label-free carbon nanotube impedance biosensors could only detect DNA at 100 aM, not sufficient for clinical applications.76 Electrochemical biosensors have been shown to reach attomolar sensitivity. However, they required electrocatalysis77 or magnetic beads amplification78 and were thus not label-free or real-time.
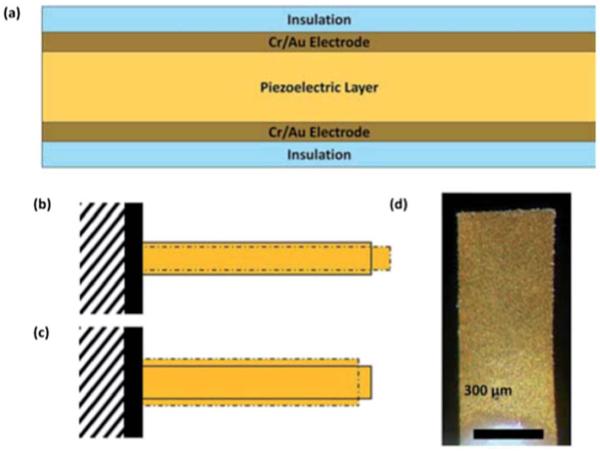
The lead magnesium niobate–lead titanate (Pb(Mg1/3Nb2/3)O3)0.65–(PbTiO3)0.35 (PMN–PT) piezoelectric plate sensor (PEPS) is a new type of piezoelectric sensor consisting of solely a PMN–PT freestanding film 8 μm in thickness79 thinly coated with a gold electrode on the two major surfaces and encapsulated with a thin 3-mercaptopropyltrimethoxysilane (MPS) electrical insulation layer (Fig. 1a). A receptor specific to a biomarker is immobilized on the surface of the electrical insulation layer. Binding of the target biomarker to the receptor on the PEPS surface shifts the PEPS length-extension-mode (LEM) (Fig. 1b) or width-extension mode (WEM) (Fig. 1c) resonance peak frequency, f. Detection of a target protein or target DNA (tDNA) marker is achieved by directly immersing a PEPS in the biological fluid and monitoring the LEM or WEM resonance frequency shift, Δf, in real-time. What is unique about PMN–PT PEPS is that the detection of f is a result of binding stress induced polarization switching within the PMN–PT layer,80 which was typically three orders of magnitude higher than that could be accounted for by the mass change alone.81 As a result, PMN–PT PEPS has shown an unprecedented concentration sensitivity of 1.6 aM (960 copies per ml) in in situ tDNA detection without the need for amplification.80 The reason we had different LEM and WEM modes was that we made PEPS longer than its width for ease of handling and ease of making. Ideally, one would explore WEM for detection because the higher frequency of WEM could offer better sensitivity. Although, in theory, one could use either the LEM or WEM peak for detection, in past practice, only the LEM peak was usable in liquid. The reason was that the width of the WEM peak was closely related to the transverse electromechanical coupling constant, −k31.81 The better the piezoelectric performance of the PMN–PT layer the wider the WEM peak. For a −k31 of about 0.32 the Q value – the ratio of the peak frequency to the width at half the peak height – would be about 10.81 Such a wide WEM peak at around 3.5 MHz coupled with imperfect electrical insulation and insufficient signal processing made tracking any meaningful peak position shift difficult. Recently, Soylu et al. has found that coating MPS at pH = 9 and with a trace amount of water reduced the conductivity of the insulation layer by three orders of magnitude.82 With such improvement, it may be possible to track the WEM peak position change with an improved peak position fitting algorithm. The advantage of using a WEM peak for detection is that the resonance frequency of a WEM peak is many times higher than that of the LEM peak. As a result, one may be able to further lower the detection concentration limit.
Fig. 1.
A schematic of (a) the cross-section of a piezoelectric plate sensor (PEPS), (b) the first length extension mode (LEM), (c) width extension mode (WEM) vibration of a PEPS where the solid bars illustrate the initial position of the PEPS and the dashdotted shapes illustrate the extended positions, and (d) a top-view optical micrograph.
The goal of this study is to investigate how one can use a WEM peak of a PMN–PT PEPS with improved electrical insulation to detect short DNA fragments spiked in urine using a multiple-parabola peak position fitting approach. The hypothesis was that by fitting the WEM peak to more than one parabola with varying numbers of data points and by averaging the fitted peak positions one would be able to reduce the noise level for more meaningful tracking of the WEM peak frequency shift due to target DNA binding. We used 1762T/1764A Hepatitis B virus double mutation (HBV-DM) as the model tDNA as it was used in the previous study by an LEM peak with 1.6 aM sensitivity.80 HBV-DM is a hepatitis B viral DNA variant comprised of adenine-1762 to thymine transversion and guanine-1764 to adenine transition which has been previously shown to be a risk factor for the development of hepatocellular carcinoma (HCC).83,84 A high percentage (>60%) of HCC patients had HBV-DM in their sera.85,86 We show that by fitting the WEM peak to an average of 50 parabolas we could increase the signal (S) to noise (N) ratio, SNR, by more than 10 times over the raw data and more than 5 times over single-parabola fitting and allowed meaningful tracking of the WEM peak frequency shift in real-time in situ detection of HBV-DM in urine with 100 zM (60 copies per ml) sensitivity without the need for DNA isolation or amplification.
2 Experimental
2.1 PEPS fabrication
Two PEPS (PEPS A and PEPS B) were used in this study. PEPS A was 1.2 mm long and 0.45 mm wide and PEPS B was 1.1 mm long and 0.45 mm wide. The geometry of the sensor, about 1 mm long and 0.5 mm wide, was a compromise between ease of fabrication and sensitivity. Presently, the PEPS were fabricated manually. While making the PEPS smaller can increase the LEM and WEM frequencies and potentially further enhance the detection sensitivity it would be hard to accomplish manually. However, it should be noted that with presently available tools and automation, in the future, it is possible to make smaller PEPS. Briefly, PEPS A and PEPS B were fabricated from PMN–PT freestanding films 8 μm thick that were coated with 110 nm thick Cr/Au electrodes by thermal evaporation (Thermionics VE 90) and cut into 2.5 mm by 0.45 mm strips with a wire saw (Princeton Scientific Precision, Princeton, NJ). Gold wires 10 μm in diameter were glued to the top and bottom electrodes of each strip using a conductive glue (XCE3104XL, Emerson and Cuming Company, Billerica, MA). The rear end of the strip was fixed on a glass substrate with a nonconductive glue (Loctite 1C Hysol Epoxy Adhesive) to form the PEPS geometry. It was then poled at 15 kV cm−1 at 90 °C for 60 min in an incubator (Digital Control Steel Door Incubator 10–180E, Quincy Lab). The dielectric constant of the PEPS was measured using an electrical impedance analyzer (Agilent 4294A) to be about 1800 with a loss factor of 2.5–3.7% at 1 kHz.
2.2 Electrical insulation
A PEPS was electrically insulated to stabilize the resonance peaks for in-liquid detection by a new 3-mercaptopropyl-trimethoxysilane (MPS) (Sigma-Aldrich Co. LLC.) solution coating scheme involving improved MPS cross-linking at pH = 9.0 and with water.82 First, the PEPS was cleaned in a Piranha solution (two parts of 98% sulfuric acid (Fisher) with one part of 30% hydrogen peroxide (Fisher)) for 1 min, followed by rinsing with water and ethanol. Before coating the PEPS with MPS at pH = 9.0, we dipped the PEPS in 50 ml of 0.01 mM MPS solution in ethanol (Fisher) with 0.5% of de-ionized (DI) water for 30 min to promote hydrolysis followed by rinsing with water and ethanol. It was then subject to 5 12 h of MPS coating in 50 ml of a 0.1% MPS solution with 0.5% of DI water in ethanol at pH = 9.0 (adjusted by adding KOH (Fisher)). For each 12 h of MPS coating, the PEPS was always rinsed with water and ethanol first before being immersed in a fresh 0.1% MPS solution at pH = 9.0 with 0.5% water. At the end of the 5th round of MPS coating, the PEPS was rinsed with DI water and ethanol before further coating with receptors for detection. After insulation, the resonance spectra of the PEPS were recorded using a portable AIM 4170C impedance analyzer (Array Solutions).
2.3 Resonance peak frequency determination
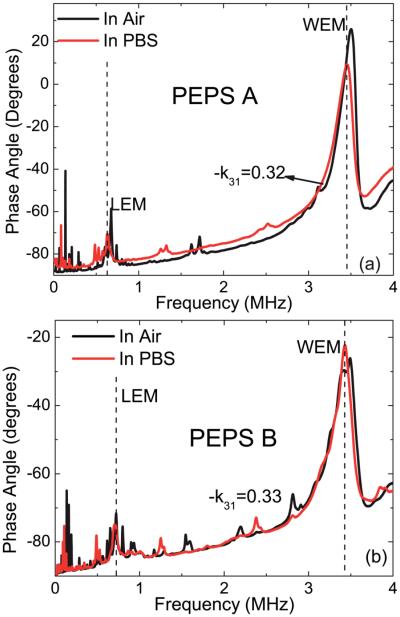
The phase-angle-versus-frequency resonance spectra of PEPS A and PEPS B in air (black) and in phosphate buffer saline (PBS) solution (red) are shown in Fig. 2a and b. Note that PEPS A had a −k31 = 0.32 and PEPS B had a −k31 = 0.33 and the WEM peaks of PEPS A and PEPS B were both at around 3.5 MHz with a Q of around 10, reminiscent of the high −k31 of both PEPSs. Also note that the baselines of the in-air and in-PBS spectra of the PEPSs were less than 1–2° apart, indicative of the effectiveness of the new insulation scheme.
Fig. 2.
In-air (black) and in-PBS (red) phase angle-versus-frequency resonance spectra of PEPS A (a) and PEPS B (b).
For detection, phase angle-versus-frequency resonance spectra of a PEPS were recorded continuously using the AIM 4170C electrical impedance analyzer controlled by a laptop with a custom program written in MatLab. After each resonance-spectrum scan, the MatLab program recorded, analyzed the obtained spectrum, and determined the peak frequency as described below. A resonance peak frequency shift, Δf, versus time plot on the computer screen was refreshed after each resonance spectrum scan in real-time. The program also used the obtained peak frequency shift to adjust the start and stop frequencies for the next resonance-spectrum scan such that the next expected resonance frequency was roughly at the center of the frequency window. To determine the peak frequency, the raw resonance spectrum (black full squares in Fig. 3) was first smoothed by weighted-linear-least-square local regression as illustrated by the red curve in Fig. 3. The smoothed curve was then fitted to multiple (about 50) parabolas each with a different frequency range centered at the apparent peak frequency of the smoothed curve. As an example, one of the fitted parabolas is shown as the blue curve in Fig. 3 with its peak position denoted by the blue triangle. Each parabola generated a fitted peak frequency. The final fitted peak frequency was the average of all the fitted parabola peak frequencies with outliers87 excluded.
Fig. 3.
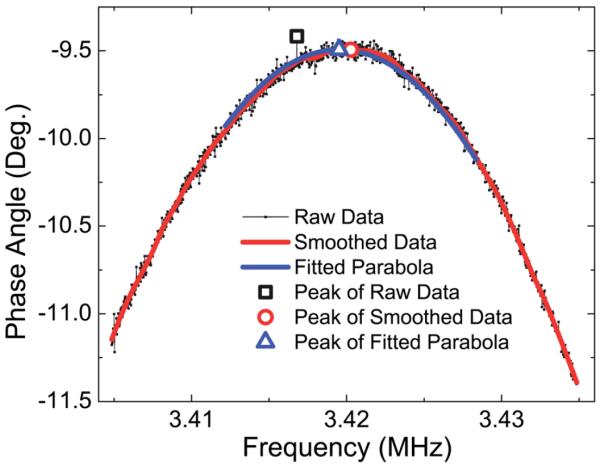
Phase angle versus frequency resonance spectra where the raw data and the smoothed data are represented by the black full squares and the red curve, respectively, a parabola fitting using 540 data points is shown as the blue curve. The peak position of the raw data, that of the smoothed data and that of the fitted parabola are shown as the large black full square, red full circle and blue triangle, respectively.
2.4 Target DNA, probe DNA, and reporter DNAs
The tDNA used was the same 200-nucleotide (nt) long single-stranded DNA (Integrated DNA Technologies) as used in the previous study80 containing the nucleotide sequence of the Hepatitis B virus genome (GeneBank Accession #X04615) centered around the 1762T/1764A double mutation. Part of the sequence of the tDNA that contained the double mutation is shown in Table 1 where the two mutation sites were underlined. The probe DNA (pDNA) was a 16 nt long synthetic single-stranded DNA (Sigma) complementary to the 16 nt sequence of the tDNA centered at the double mutation site as shown in Table 1. The pDNA had a biotin with a 12-polyethyleneglycol (PEG) spacer at the 5′ end. The melting temperature of the pDNA to the tDNA was 47 °C as estimated under the experimental conditions88 and listed in Table 1.
Table 1.
The sequences of tDNA, pDNA, upstream urDNA and downstream drDNA and the melting temperature, Tm, of the tDNA with pDNA, that of the tDNA with urDNA, and that of the tDNA with drDNA
| Type of DNA | Sequence (5′ to 3′) | Tm (°C) |
|---|---|---|
| tDNAa | 5′…GGTTAATGATCTTTGT…3′ | — |
| pDNA | Biotin-5′-ACAAAGATCATTAACC-3′ | 47 |
| Upstream rDNA (urDNA) | Amine-5′ACAGACCAATTTATGCCTACAGCCTCCTAG-3′ | 76.3 |
| Downstream rDNA (drDNA) | Amine-5′-AATCTCCTCCCCCAACTCCTCCCAGTCTTT-3′ | 77.4 |
Mutation sites are indicated by underlined bases.
To immobilize the biotin-activated pDNA on the PEPS surface, the MPS-coated PEPS was first immersed in 200 μl of 5 mg ml−1 maleimide activated biotin (Maleimide-PEG11-Biotin) (Pierce) in PBS for 30 minutes. The maleimide reacted with the thiol group on the MPS surface to immobilize the biotin on the PEPS surface. It was then followed by immersion of the PEPS in 200 μl of 1 μM streptavidin in PBS to bind streptavidin to the biotin on the PEPS surface. Afterwards, the PEPS was immersed in 200 μl of a 10 μM solution of the probe DNA in PBS for an hour to allow the biotin at the 5′ end of the pDNA to bind to the streptavidin on the PEPS surface. The details of the chemical reaction of the immobilization steps are shown in the ESI.†
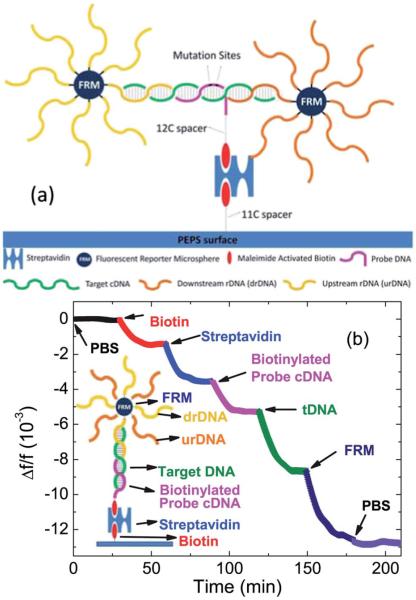
There were two 30 nt long reporter DNAs (rDNAs) (Sigma). One was complementary to the sequence upstream of which was complementary to the pDNA and the other was complementary to the sequence downstream of which was complementary to the tDNA. The upstream rDNA was amine-activated with a 12-PEG spacer at the 5′ end while the downstream rDNA was amine-activated with a 7-PEG spacer at the 3′ end. The sequence of the upstream rDNA and that of the downstream rDNA are also shown in Table 1. Fig. 4a is a schematic that illustrates the relationships between the tDNA, the pDNA, the urDNA, and the drDNA. In real DNA fragments, mutation sites may be located anywhere in the fragments and in some cases the mutated sites may be too close to the edge for strong enough rDNA binding. Under such conditions, rDNAs in the opposite stream would permit binding of the rDNA to the captured tDNA on the sensor surface. For this reason, we included both upstream and downstream rDNAs in the study even though in the present synthetic tDNA the mutation sites were centrally located. The melting temperature for binding the upstream rDNA (urDNA) to the tDNA was 76.3 °C and that of the downstream rDNA (drDNA) to the tDNA was 77.4 °C, which are also listed in Table 1. Both drDNA and urDNA are immobilized on 6 μm size fluorescent reporter microspheres (FRM) as described previously80,89 for in situ validation as well as for visualization of the detection.80 In Fig. 4b, we plot the Δf/f versus time of PEPS A during the various steps of pDNA immobilization followed by tDNA detection and the subsequent FRM detection. Steps of immobilization are illustrated in the inset in Fig. 4b.
Fig. 4.
(a) A schematic of the relations between tDNA, pDNA, urDNA and drDNA. pDNA is immobilized on the PEPS surface using a biotin–streptavidin–biotin sandwich. The 200 nts long tDNA (green) hybridizes to pDNA (pink) in the middle, and the upstream and downstream flanking regions hybridize with upstream (yellow) and downstream (orange) rDNA which are conjugated on FRMs (dark blue spheres) and (b) relative resonance frequency shift, Δf/f, of PEPS A during various steps of pDNA immobilization and tDNA detection. The inset in (b) shows a schematic of the molecules involved in the immobilization and detection steps.
2.5 Urine sample preparation
Urine samples were collected in 50 ml centrifuge tubes in a first morning sample collection fashion after emptying the bladder the previous evening. The samples were kept in a 4 °C refrigerator before detection. Blocking of non-specific binding is accomplished by dissolving 3% bovine serum albumin (BSA) in urine equilibrated to room temperature.
2.6 Flow setup
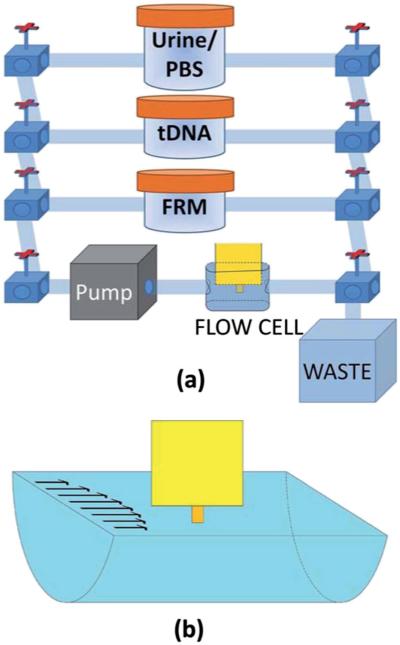
All the tDNA detections were carried out in a flow setup. A schematic of the flow system consisting of a polycarbonate detection chamber 18.5 mm long, 3.5 mm wide and 5.5 mm deep (volume = 356 μl), three reservoirs, and a peristaltic pump (Cole-Parmer 77120 – 62) interconnected with 0.8 mm wide tubing is shown in Fig. 5a. The PEPS was vertically placed in the center of the flow chamber with its major faces parallel to the flow as illustrated by the schematic shown in Fig. 5b. In each detection event, only one reservoir was connected to the detection chamber. The total volume of the liquid was 50 ml including the liquid in the reservoir, the detection chamber and the connecting tubing. In what follows, all detections were carried out with a flow rate of 1 ml min−1 corresponding to an average flow velocity of 1.4 mm s−1 at the PEPS surface. Furthermore, in this setup, the detection could transit from one detection experiment involving the sample in one reservoir to another detection experiment involving the sample of another reservoir by turning the valves. Typically, a 20 second period for valves turning without data recording was sufficient for a smooth transition from one detection experiment to another.
Fig. 5.
(a) A schematic of the flow system and (b) a schematic of the flow cell where the PEPS is placed at the center of the laminar flow.
3 Results
The theoretical first WEM and the first LEM resonance peak frequencies could be calculated80 using f = c/2w and f = c/4L, respectively, where was the sound velocity in the piezoelectric layer with Y11 = 81 GPa and ρ = 7800 kg m−3 being the Young's modulus in the length and width directions and the density of the piezoelectric layer, respectively, and w and L are the width and the length of the PEPS, respectively. The theoretical first LEM and WEM peak frequencies were estimated to be 623 kHz and 3.44 MHz, respectively, for PEPS A and 718 kHz and 3.42 MHz, respectively, for PEPS B as indicated by the vertical dashed lines in Fig. 2(a) and (b).
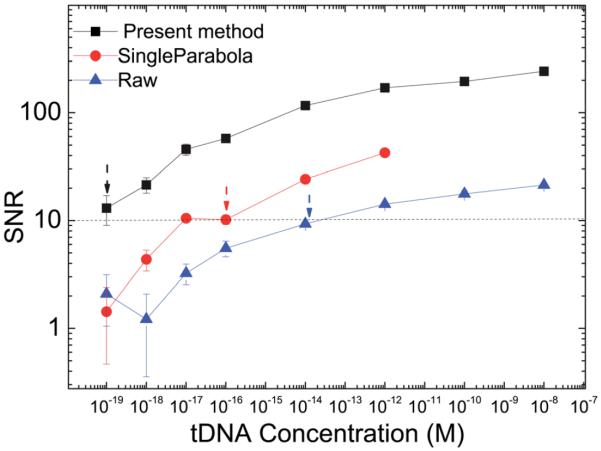
tDNA detection was carried out using PEPS A in PBS with tDNA spiked at various concentrations to compare the signal-to-noise ratio (SNR) of the detection resonance frequency shift obtained by fitting the resonance peak frequency using the present multiple-parabola algorithm to those of the same detection but obtained using the raw data or using a single-parabola algorithm. The tDNA detection was immediately followed by FRM detection at a concentration of 105 FRMs per ml as described previously.80 The tDNA detection Δf/f versus time of PEPS A and the corresponding −Δf/f at t = 30 min versus tDNA concentration are included in the ESI.† In the present signal-to-noise (SNR) analysis, the signal was the average tDNA detection Δf/f between t = 25 and 30 min and the noise was the standard deviation of −Δf/f of the blank sample (i.e., without tDNA). The resultant SNR versus tDNA concentration is shown in Fig. 6. Note all data points in Fig. 6 were the average of three independent runs for each concentration. As can be seen, the SNRs obtained by the present multiple-parabola fitting (full squares) were larger than 10 down to the tDNA concentration of 10−19 M. By convention, the lowest acceptable SNR is 3. The fact that the present detection with the multiple-parabola fitting algorithm exhibited an SNR of 10 at 10−19 M indicates high sensitivity of the PEPS detection. For comparison, we also plot the SNR obtained with the raw data (full triangles) and by single-parabola fitting (full circles). As can be seen, the present multiple-parabola fitting algorithm improved the SNR by about ten times from those obtained by the raw data and by about 5 times from those obtained by single-parabola fitting. Note the drop in SNR obtained from the raw data at 10−18 M was not meaningful, as the SNR at concentrations below 10−17 M were already below 3 – an indication that SNR values at below 10−17 M were not reliable. The positive tDNA detection with an SNR of 10 even at a tDNA concentration as low as 60 copies per ml was validated by the FRM detection immediately following the tDNA detection as described in the ESI.†
Fig. 6.
Signal to noise ratio (SNR) versus tDNA concentration of tDNA detection in PBS by PEPS A where full squares, full circles, and full triangles denote SNRs obtained by the present multiple-parabola fitting algorithm, by single-parabola fitting (red circles), and by raw data, respectively. Arrows indicate the lowest concentrations with an SNR value of 10 for each method.
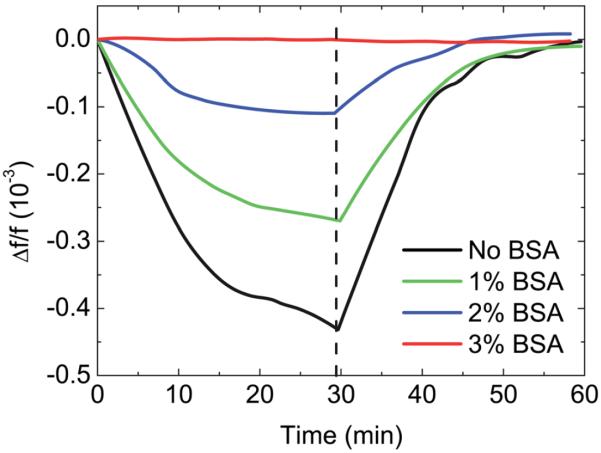
In the following, we applied the multiple-parabola fitting algorithm in the detection of DNA hybridization in urine using PEPS B. To determine the appropriate amount of BSA needed to block the PEPS surface from nonspecific binding, PEPS was first treated with a BSA solution with concentration ranging 0–3% followed by inserting the PEPS in flowing urine at a 1 ml min−1 flow rate for 30 min followed by flowing a phosphate buffer saline (PBS) solution at a 6 ml min−1 flow rate for 30 min. The resultant Δf/f versus time in urine and the subsequent PBS washing with various amounts of BSA blocking is shown in Fig. 7. As can be seen, without BSA blocking, Δf/f decreased in urine and subsequently recovered after PBS washing, indicating that the Δf/f in urine was due to nonspecific binding by urine which could be washed off by flowing PBS. The nonspecific binding decreased with an increasing concentration of BSA blocking and with 3% BSA blocking it appeared that nonspecific binding by urine no longer occurred, i.e., there was no resonance frequency down-shifting in urine and no resonance frequency up-shifting in PBS. In what follows, all detections were carried out with 3% BSA blocking.
Fig. 7.
Relative frequency shift, Δf/f, of PEPS B in urine at 1 ml min−1 for 30 min followed by PBS washing at a flow rate of 6 ml min−1 after the PEPS was initially blocked with 0, 1, 2 and 3 % BSA.
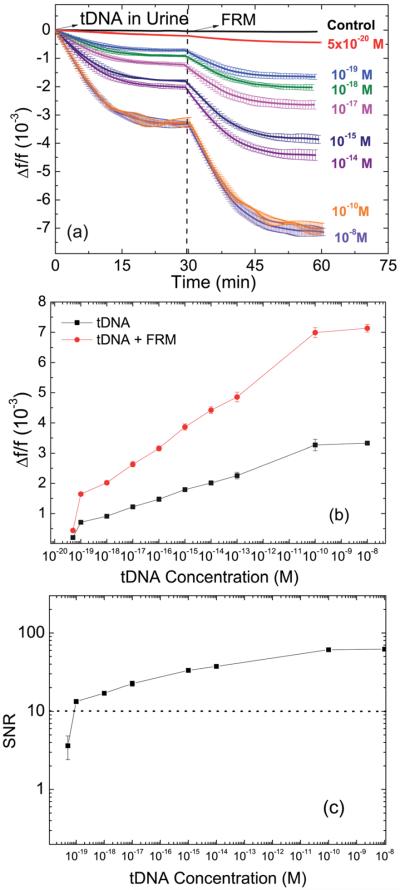
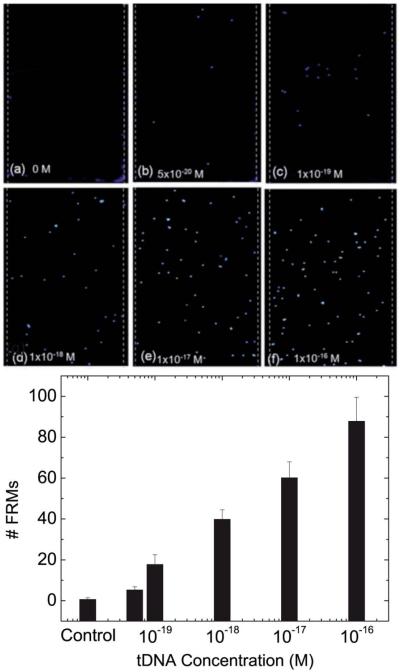
Fig. 8a shows the Δf/f versus time of tDNA detection in urine at t = 0–30 min followed by FRM detection at t = 30–60 min for tDNA concentrations of 0, 5 × 10⁻²⁰, 10−19, 10−18, 10−17, 10−15, 10−14, 10−10, and 10−8 M (0, 30, 60, 600, 6, 000, 6 × 10⁵, 6 × 10⁶, 6 × 10¹⁰, and 6 × 10¹² copies per ml). Note that all the data points shown in Fig. 8a were the averages of three independent detections at each tDNA concentration. As can be seen, Δf/f decreased with time in a dose responsive fashion. In addition, Δf/f further decreased during the subsequent FRM detection validating that the Δf/f observed during the tDNA detection was indeed due to the binding of the tDNA to the pDNA on the PEPS surface. The Δf/f at t = 30 min after tDNA detection and the Δf/f after FRM detection at t = 60 min are plotted versus tDNA concentration in Fig. 8b. Clearly, the −Δf/f of tDNA detection ranges from 0.19 × 10⁻³ at 5 × 10⁻²⁰ M (30 copies per ml) to > 3.3 × 10⁻³ when saturated at 10−10 and 10−8 M. Fig. 8a and b clearly illustrate that PEPS exhibited a 10 decade dynamic range in DNA detection in urine. Furthermore, from Fig. 8b, one can see that −Δf/f of the FRM detection following the tDNA detection was directly proportional to that of the tDNA detection alone, validating that the tDNA detection was indeed due to the binding of the tDNA to the pDNA on the PEPS surface. The SNR of the tDNA detection by PEPS B in urine was similarly analyzed where the signal denotes the average tDNA detection Δf/f between t = 25 and 30 min and the noise denotes the standard deviation of −Δf/f of the blank sample (i.e., without tDNA). The resultant SNR versus tDNA concentration plot is shown in Fig. 8c. The SNR of the lowest concentration, 5 × 10⁻²⁰ M, was slightly above 3 with a standard deviation. For this reason the limit of detection for this study was chosen as 1 × 10⁻¹⁹ M or approximately 60 copies per ml. Further, visual validation was carried out by examining the PEPS surface under a fluorescent microscope (Olympus BX51). Fluorescent micrographs of the FRMs captured on the PEPS surface following tDNA detection at various tDNA concentrations are shown in Fig. 9. As can be seen, the number of FRMs captured on the PEPS surface increased with an increasing tDNA concentration in a dose responsive fashion, further validating PEPS tDNA detection. The average number of FRMs on the PEPS surface versus tDNA concentration is also shown in Fig. 9g where each data point is the average of 6 images obtained at the same tDNA concentration.
Fig. 8.
(a) Relative resonance frequency shift Δf/fversus time of tDNA detection at various concentrations in urine and (b) −Δf/f at t = 30 min (tDNA hybridization) and at t = 60 min (tDNA hybridization plus FRM detection) versus tDNA concentration. (c) SNR versus concentration of tDNA graph plotted using data in (a).
Fig. 9.
Fluorescent micrographs of the PEPS surface after FRM detection followed by (a) 0 M, (b) 5 × 10⁻²⁰ M, (c) 1 × 10⁻¹⁹ M, (d) 1 × 10⁻¹⁸ M, (e) 1 × 10⁻¹⁷ M and (f) 1 × 10⁻¹⁶ M of tDNA detection. The width of PEPS B as denoted by the parallel dashed lines was 450 μm. Clearly, the number of FRMs captured on the PEPS surface increased with an increasing tDNA concentration in a dose responsive fashion validating the tDNA detection at a concentration as low as 5 × 10⁻²⁰ M. (g) Average number of FRMs captured on the PEPS surface versus tDNA concentration in urine.
4 Discussion
That a 60 copies per ml analytical sensitivity was achieved by both PEPS A in PBS and PEPS B in urine may be attributed to the similar −k31 between PEPS A (0.32) and PEPS B (0.33). The sensitivity of a PEPS was related to its −k31: the higher the −k31 the more sensitive the PEPS.81 With the results from both PEPS B and PEPS A it suffices to say that with improved MPS insulation and using the present multiple-parabola fitting algorithm a PEPS with −k31 ≥ 0.32 exhibits an analytical sensitivity of better than 60 copies per ml, which is ≥16 times lower than that of the previous same tDNA detection in PBS using a PEPS with a similar −k31 but with only single-parabola fitting.
5 Conclusions
We have examined real-time, in situ hybridization detection of tDNA in a buffer solution and in urine using 8 μm-thick PMN–PT PEPSs about 1.1–1.2 mm long and 0.45 mm wide with improved MPS insulation and a new multiple-parabola (>50) resonance peak position fitting algorithm. With pDNA immobilized on the PEPS surface and by monitoring the first width extension mode (WEM) resonance frequency shift we detected tDNA in real-time at concentration as low as 1 × 10⁻¹⁹ M in urine (100 zM) with an SNR of >10 without DNA isolation and amplification at room temperature in 30 min. Note that there was no incubation time. 30 min was the time between when the sample was loaded and when the monitoring was stopped. The present multiple-parabola fitting algorithm increased the detection SNR by about 10 times from those obtained using the raw data and by about 5 times from those obtained using single parabola fitting. The detection was validated by in situ follow-up detection and subsequent visualization of FRMs coated with reporter DNA complementary to the tDNA but different from the pDNA.
Supplementary Material
Acknowledgements
This work was supported in part by the Coulter-Drexel Translational Research Partnership grant and the Nanotechnology Institute of Benjamin Franklin Partnership of Southeastern Pennsylvania.
Footnotes
Electronic supplementary information (ESI) available. See DOI: 10.1039/c4an00215f
REFERENCES
- 1.Mandel P, Metais P. C. R. Acad. Sci. (Paris) 1948;142:241–243. [PubMed] [Google Scholar]
- 2.Sorenson GD, Pribish DM, Valone FH, Memoli VA, Bzik DJ, Yao SL. Cancer Epidemiol., Biomarkers Prev. 1994;3:67–71. [PubMed] [Google Scholar]
- 3.Vasioukhin V, Anker P, Maurice P, Lyautey J, Lederrey C, Stroun M. Br. J. Haematol. 1994;86:774–779. doi: 10.1111/j.1365-2141.1994.tb04828.x. [DOI] [PubMed] [Google Scholar]
- 4.Valenzuela MT, Galisteo R, Zuluaga A, Villalobos M, Nunez MI, Oliver FJ, Ruiz de Almodovar JM. Eur. Urol. 2002;42:622–628. doi: 10.1016/s0302-2838(02)00468-2. discussion 628–30. [DOI] [PubMed] [Google Scholar]
- 5.Utting M, Werner W, Dahse R, Schubert J, Junker K. Clin. Cancer Res. 2002;8:35–40. [PubMed] [Google Scholar]
- 6.Schwarzenbach H, Pantel K, Kemper B, Beeger C, Otterbach F, Kimmig R, Kasimir-Bauer S. Breast Cancer Res. 2009;11:R71. doi: 10.1186/bcr2404. [DOI] [PMC free article] [PubMed] [Google Scholar]
- 7.Silva JM, Silva J, Sanchez A, Garcia JM, Dominguez G, Provencio M, Sanfrutos L, Jareo E, Colas A, Espaa P, Bonilla F. Clin. Cancer Res. 2002;8:3761–3766. [PubMed] [Google Scholar]
- 8.Taback B, Giuliano AE, Hansen NM, Singer FR, Shu S, Hoon DS. Cancer Res. 2003;63:1884–1887. [PubMed] [Google Scholar]
- 9.Umetani N, Giuliano AE, Hiramatsu SH, Amersi F, Nakagawa T, Martino S, Hoon DS. J. Clin. Oncol. 2006;24:4270–4276. doi: 10.1200/JCO.2006.05.9493. [DOI] [PubMed] [Google Scholar]
- 10.Widschwendter A, Muller HM, Fiegl H, Ivarsson L, Wiedemair A, Muller-Holzner E, Goebel G, Marth C, Widschwendter M. Clin. Cancer Res. 2004;10:565–571. doi: 10.1158/1078-0432.ccr-0825-03. [DOI] [PubMed] [Google Scholar]
- 11.Pornthanakasem W, Shotelersuk K, Termrungruanglert W, Voravud N, Niruthisard S, Mutirangura A. BMC Cancer. 2001;1:2. doi: 10.1186/1471-2407-1-2. [DOI] [PMC free article] [PubMed] [Google Scholar]
- 12.Lecomte T, Berger A, Zinzindohou F, Micard S, Landi B, Blons H, Beaune P, Cugnenc P-H, Laurent-Puig P. Int. J. Cancer. 2002;100:542–548. doi: 10.1002/ijc.10526. [DOI] [PubMed] [Google Scholar]
- 13.Lefebure B, Charbonnier F, Di Fiore F, Tuech JJ, Le Pessot F, Michot F, Michel P, Frebourg T. Ann. Surg. 2010;251:275–280. doi: 10.1097/SLA.0b013e3181c35c87. [DOI] [PubMed] [Google Scholar]
- 14.Ryan BM, Lefort F, McManus R, Daly J, Keeling PW, Weir DG, Kelleher D. Gut. 2003;52:101–108. doi: 10.1136/gut.52.1.101. [DOI] [PMC free article] [PubMed] [Google Scholar]
- 15.Umetani N, Kim J, Hiramatsu S, Reber HA, Hines OJ, Bilchik AJ, Hoon DS. Clin. Chem. 2006;52:1062–1069. doi: 10.1373/clinchem.2006.068577. [DOI] [PubMed] [Google Scholar]
- 16.deVos T, Tetzner R, Model F, Weiss G, Schuster M, Distler J, Steiger KV, Grtzmann R, Pilarsky C, Habermann JK, Fleshner PR, Oubre BM, Day R, Sledziewski AZ, Lofton-Day C. Clin. Chem. 2009;55:1337–1346. doi: 10.1373/clinchem.2008.115808. [DOI] [PubMed] [Google Scholar]
- 17.Szymanska K, Lesi OA, Kirk GD, Sam O, Taniere P, Scoazec JY, Mendy M, Friesen MD, Whittle H, Montesano R, Hainaut P. Int. J. Cancer. 2004;110:374–379. doi: 10.1002/ijc.20103. [DOI] [PubMed] [Google Scholar]
- 18.Kirk GD, Lesi OA, Mendy M, Szymanska K, Whittle H, Goedert JJ, Hainaut P, Montesano R. Oncogene. 2005;24:5858–5867. doi: 10.1038/sj.onc.1208732. [DOI] [PubMed] [Google Scholar]
- 19.Chan KCA, Lai PBS, Mok TSK, Chan HLY, Ding C, Yeung SW, Lo YMD. Clin. Chem. 2008;54:1528–1536. doi: 10.1373/clinchem.2008.104653. [DOI] [PubMed] [Google Scholar]
- 20.Wong IH, Lo YM, Yeo W, Lau WY, Johnson PJ. Clin. Cancer Res. 2000;6:3516–3521. [PubMed] [Google Scholar]
- 21.Wang S, An T, Wang J, Zhao J, Wang Z, Zhuo M, Bai H, Yang L, Zhang Y, Wang X, Duan J, Wang Y, Guo Q, Wu M. Clin. Cancer Res. 2010;16:1324–1330. doi: 10.1158/1078-0432.CCR-09-2672. [DOI] [PubMed] [Google Scholar]
- 22.Bearzatto A, Conte D, Frattini M, Zaffaroni N, Andriani F, Balestra D, Tavecchio L, Daidone MG, Sozzi G. Clin. Cancer Res. 2002;8:3782–3787. [PubMed] [Google Scholar]
- 23.Liu Y, An Q, Li L, Zhang D, Huang J, Feng X, Cheng S, Gao Y. Carcinogenesis. 2003;24:1897–1901. doi: 10.1093/carcin/bgg169. [DOI] [PubMed] [Google Scholar]
- 24.Ramirez JL, Rosell R, Taron M, Sanchez-Ronco M, Alberola V, de Las Penas R, Sanchez JM, Moran T, Camps C, Massuti B, Sanchez JJ, Salazar F, Catot S. J. Clin. Oncol. 2005;23:9105–9112. doi: 10.1200/JCO.2005.02.2905. [DOI] [PubMed] [Google Scholar]
- 25.Sozzi G, Conte D, Mariani L, Lo Vullo S, Roz L, Lombardo C, Pierotti MA, Tavecchio L. Cancer Res. 2001;61:4675–4678. [PubMed] [Google Scholar]
- 26.Hosny G, Farahat N, Hainaut P. Cancer Lett. 2009;275:234–239. doi: 10.1016/j.canlet.2008.10.029. [DOI] [PubMed] [Google Scholar]
- 27.Au WY, Pang A, Choy C, Chim CS, Kwong YL. Blood. 2004;104:243–249. doi: 10.1182/blood-2003-12-4197. [DOI] [PubMed] [Google Scholar]
- 28.Lei I, Chan LY, Chan WY, Johnson PJ, Lo YM. Clin. Cancer Res. 2002;8:29–34. [PubMed] [Google Scholar]
- 29.Board RE, Ellison G, Orr MC, Kemsley KR, McWalter G, Blockley LY, Dearden SP, Morris C, Ranson M, Cantarini MV, Dive C, Hughes A. Br. J. Cancer. 2009;101:1724–1730. doi: 10.1038/sj.bjc.6605371. [DOI] [PMC free article] [PubMed] [Google Scholar]
- 30.Fujimoto A, O'Day SJ, Taback B, Elashoff D, Hoon DS. Cancer Res. 2004;64:4085–4088. doi: 10.1158/0008-5472.CAN-04-0957. [DOI] [PubMed] [Google Scholar]
- 31.Fujiwara Y, Chi DD, Wang H, Keleman P, Morton DL, Turner R, Hoon DS. Cancer Res. 1999;59:1567–1571. [PubMed] [Google Scholar]
- 32.Taback B, Fujiwara Y, Wang HJ, Foshag LJ, Morton DL, Hoon DS. Cancer Res. 2001;61:5723–5726. [PubMed] [Google Scholar]
- 33.Taback B, O'Day SJ, Boasberg PD, Shu S, Fournier P, Elashoff R, Wang HJ, Hoon DS. J. Natl. Cancer Inst. 2004;96:152–156. doi: 10.1093/jnci/djh011. [DOI] [PMC free article] [PubMed] [Google Scholar]
- 34.Shinozaki M, O'Day SJ, Kitago M, Amersi F, Kuo C, Kim J, Wang HJ, Hoon DS. Clin. Cancer Res. 2007;13:2068–2074. doi: 10.1158/1078-0432.CCR-06-2120. [DOI] [PMC free article] [PubMed] [Google Scholar]
- 35.Koyanagi K, Mori T, O'Day SJ, Martinez SR, Wang HJ, Hoon DS. Cancer Res. 2006;66:6111–6117. doi: 10.1158/0008-5472.CAN-05-4198. [DOI] [PMC free article] [PubMed] [Google Scholar]
- 36.Mori T, O'Day SJ, Umetani N, Martinez SR, Kitago M, Koyanagi K, Kuo C, Takeshima TL, Milford R, Wang HJ, Vu VD, Nguyen SL, Hoon DS. J. Clin. Oncol. 2005;23:9351–9358. doi: 10.1200/JCO.2005.02.9876. [DOI] [PMC free article] [PubMed] [Google Scholar]
- 37.Muller HM, Millinger S, Fiegl H, Goebel G, Ivarsson L, Widschwendter A, Muller-Holzner E, Marth C, Widschwendter M. Clin. Chem. 2004;50:2171–2173. doi: 10.1373/clinchem.2004.034090. [DOI] [PubMed] [Google Scholar]
- 38.Zachariah R, Schmid S, Buerki N, Radpour R, Holzgreve W, Zhong X. Obstet. Gynecol. 2008;112:843–50. doi: 10.1097/AOG.0b013e3181867bc0. [DOI] [PubMed] [Google Scholar]
- 39.Liggett T, Melnikov A, Yi QL, Replogle C, Brand R, Kaul K, Talamonti M, Abrams RA, Levenson V. Cancer. 2010;116:1674–1680. doi: 10.1002/cncr.24893. [DOI] [PubMed] [Google Scholar]
- 40.Castells A, Puig P, Mora J, Boadas J, Boix L, Urgell E, Sole M, Capella G, Lluis F, Fernandez-Cruz L, Navarro S, Farre A. J. Clin. Oncol. 1999;17:578–584. doi: 10.1200/JCO.1999.17.2.578. [DOI] [PubMed] [Google Scholar]
- 41.Bastian PJ, Palapattu GS, Lin X, Yegnasubramanian S, Mangold LA, Trock B, Eisenberger MA, Partin AW, Nelson WG. Clin. Cancer Res. 2005;11:4037–4043. doi: 10.1158/1078-0432.CCR-04-2446. [DOI] [PubMed] [Google Scholar]
- 42.Roupret M, Hupertan V, Catto JW, Yates DR, Rehman I, Proctor LM, Phillips J, Meuth M, Cussenot O, Hamdy FC. Int. J. Cancer. 2008;122:952–956. doi: 10.1002/ijc.23196. [DOI] [PubMed] [Google Scholar]
- 43.Ellinger J, Bastian PJ, Haan KI, Heukamp LC, Buettner R, Fimmers R, Mueller SC, von Ruecker A. Int. J. Cancer. 2008;122:138–143. doi: 10.1002/ijc.23057. [DOI] [PubMed] [Google Scholar]
- 44.Schwarzenbach H, Alix-Panabires C, Mller I, Letang N, Vendrell J-P, Rebillard X, Pantel K. Clin. Cancer Res. 2009;15:1032–1038. doi: 10.1158/1078-0432.CCR-08-1910. [DOI] [PubMed] [Google Scholar]
- 45.Sunami E, Shinozaki M, Higano CS, Wollman R, Dorff TB, Tucker SJ, Martinez SR, Mizuno R, Singer FR, Hoon DS. Clin. Chem. 2009;55:559–567. doi: 10.1373/clinchem.2008.108498. [DOI] [PubMed] [Google Scholar]
- 46.Mehra N, Penning M, Maas J, van Daal N, Giles RH, Voest EE. Clin. Cancer Res. 2007;13:421–426. doi: 10.1158/1078-0432.CCR-06-1087. [DOI] [PubMed] [Google Scholar]
- 47.Botezatu I, Serdyuk O, Potapova G, Shelepov V, Alechina R, Molyaka Y, Ananev V, Bazin I, Garin A, Narimanov M, Knysh V, Melkonyan H, Umansky S, Lichtenstein A. Clin. Chem. 2000;46:1078–1084. [PubMed] [Google Scholar]
- 48.Umansky SR, Tomei LD. Expert Rev. Mol. Diagn. 2006;6:153–163. doi: 10.1586/14737159.6.2.153. [DOI] [PubMed] [Google Scholar]
- 49.Su YH, Wang M, Block TM, Landt O, Botezatu I, Serdyuk O, Lichtenstein A, Melkonyan H, Tomei LD, Umansky S. Ann. N. Y. Acad. Sci. 2004;1022:81–89. doi: 10.1196/annals.1318.014. [DOI] [PubMed] [Google Scholar]
- 50.Melnikov A, Scholtens D, Godwin A, Levenson V. J. Mol. Diagn. 2009;11:60–65. doi: 10.2353/jmoldx.2009.080072. [DOI] [PMC free article] [PubMed] [Google Scholar]
- 51.Hammond DM, Manetto A, Gierlich J, Azov VA, Gramlich PM, Burley GA, Maul M, Carell T. Angew. Chem., Int. Ed. 2007;46:4184–4187. doi: 10.1002/anie.200605023. [DOI] [PubMed] [Google Scholar]
- 52.Guo F, Lapsley MI, Nawaz AA, Zhao Y, Lin S-CS, Chen Y, Yang S, Zhao X-Z, Huang TJ. Anal. Chem. 2012;84:10745–10749. doi: 10.1021/ac302623z. [DOI] [PMC free article] [PubMed] [Google Scholar]
- 53.Chen Y, Seo TS. Electrophoresis. 2011;32:1456–1464. doi: 10.1002/elps.201100073. [DOI] [PubMed] [Google Scholar]
- 54.Passamano M, Pighini M. Sens. Actuators, B. 2006;118:177–181. [Google Scholar]
- 55.Feng K, Li J, Jiang JH, Shen GL, Yu RQ. Biosens. Bioelectron. 2007;22:1651–1657. doi: 10.1016/j.bios.2006.07.023. [DOI] [PubMed] [Google Scholar]
- 56.Gasparac R, Taft BJ, Lapierre-Devlin MA, Lazareck AD, Xu JM, Kelley SO. J. Am. Chem. Soc. 2004;126:12270–12271. doi: 10.1021/ja0458221. [DOI] [PubMed] [Google Scholar]
- 57.Park SJ, Taton TA, Mirkin CA. Science. 2002;295:1503–1506. doi: 10.1126/science.1067003. [DOI] [PubMed] [Google Scholar]
- 58.He L, Musick MD, Nicewarner SR, Salinas FG, Benkovic SJ, Natan MJ, Keating CD. J. Am. Chem. Soc. 2000;122:9071–9077. [Google Scholar]
- 59.Mao X, Yang L, Su XL, Li Y. Biosens. Bioelectron. 2006;21:1178–1185. doi: 10.1016/j.bios.2005.04.021. [DOI] [PubMed] [Google Scholar]
- 60.Gifford LK, Sendroiu IE, Corn RM, Luptak A. J. Am. Chem. Soc. 2010;132:9265–9267. doi: 10.1021/ja103043p. [DOI] [PMC free article] [PubMed] [Google Scholar]
- 61.Yang T, Zhou N, Zhang Y, Zhang W, Jiao K, Li G. Biosens. Bioelectron. 2009;24:2165–2170. doi: 10.1016/j.bios.2008.11.011. [DOI] [PubMed] [Google Scholar]
- 62.Zheng G, Patolsky F, Cui Y, Wang WU, Lieber CM. Nat. Biotechnol. 2005;23:1294–1301. doi: 10.1038/nbt1138. [DOI] [PubMed] [Google Scholar]
- 63.Zhang GJ, Luo ZH, Huang MJ, Tay GK, Lim EJ. Biosens. Bioelectron. 2010;25:2447–2453. doi: 10.1016/j.bios.2010.04.001. [DOI] [PubMed] [Google Scholar]
- 64.Andreu A, Merkert JW, Lecaros LA, Broglin BL, Brazell JT, El-Kouedi M. Sens. Actuators, B. 2006;114:1116–1120. [Google Scholar]
- 65.Gao Z, Agarwal A, Trigg AD, Singh N, Fang C, Tung CH, Fan Y, Buddharaju KD, Kong J. Anal. Chem. 2007;79:3291–3297. doi: 10.1021/ac061808q. [DOI] [PubMed] [Google Scholar]
- 66.Hahm J.-i., Lieber CM. Nano Lett. 2003;4:51–54. [Google Scholar]
- 67.Wang J, Polsky R, Merkoci A, Turner KL. Langmuir. 2003;19:989–991. [Google Scholar]
- 68.Chang H, Yuan Y, Shi N, Guan Y. Anal. Chem. 2007;79:5111–5115. doi: 10.1021/ac070639m. [DOI] [PubMed] [Google Scholar]
- 69.Su M, Li S, Dravid VP. Appl. Phys. Lett. 2003;82:3562–3564. [Google Scholar]
- 70.Rijal K, Mutharasan R. Anal. Chem. 2007;79:7392–7400. doi: 10.1021/ac0712042. [DOI] [PubMed] [Google Scholar]
- 71.Zheng S, Choi JH, Lee SM, Hwang KS, Kim SK, Kim TS. Lab Chip. 2011;11:63–69. doi: 10.1039/c0lc00122h. [DOI] [PubMed] [Google Scholar]
- 72.Caruso F, Rodda E, Furlong DN, Niikura K, Okahata Y. Anal. Chem. 1997;69:2043–2049. doi: 10.1021/ac961220r. [DOI] [PubMed] [Google Scholar]
- 73.Wang J, Kawde AN, Musameh M. Analyst. 2003;128:912–916. doi: 10.1039/b303282e. [DOI] [PubMed] [Google Scholar]
- 74.Husale S, Persson HH, Sahin O. Nature. 2009;462:1075–1078. doi: 10.1038/nature08626. [DOI] [PMC free article] [PubMed] [Google Scholar]
- 75.Gao W, Dong H, Lei J, Ji H, Ju H. Chem. Commun. 2011;47:5220–5222. doi: 10.1039/c1cc10840a. [DOI] [PubMed] [Google Scholar]
- 76.Kurkina T, Vlandas A, Ahmad A, Kern K, Balasubramanian K. Angew. Chem., Int. Ed. 2011;50:3710–3714. doi: 10.1002/anie.201006806. [DOI] [PubMed] [Google Scholar]
- 77.Soleymani L, Fang Z, Kelley SO, Sargent EH. Appl. Phys. Lett. 2009;95:143701–143703. [Google Scholar]
- 78.Loaiza OA, Campuzano S, Pedrero M, Pividori MI, Garcia P, Pingarron JM. Anal. Chem. 2008;80:8239–8245. doi: 10.1021/ac801319b. [DOI] [PubMed] [Google Scholar]
- 79.Shih WY, Luo H, Li H, Martorano C, Shih W-H. Appl. Phys. Lett. 2006;89:242913. [Google Scholar]
- 80.Wu W, Kirimli CE, Shih WH, Shih WY. Biosens. Bioelectron. 2013;43:391–399. doi: 10.1016/j.bios.2012.12.044. [DOI] [PubMed] [Google Scholar]
- 81.Wu W, Shih WY, Shih WH. J. Appl. Phys. 2013;114:064505. [Google Scholar]
- 82.Soylu MC, Shih W-H, Shih WY. Ind. Eng. Chem. Res. 2013;52:2590–2597. [Google Scholar]
- 83.Munoz A, Chen JG, Egner PA, Marshall ML, Johnson JL, Schneider MF, Lu JH, Zhu YR, Wang JB, Chen TY, Kensler TW, Groopman JD. Carcinogenesis. 2011;32:860–865. doi: 10.1093/carcin/bgr055. [DOI] [PMC free article] [PubMed] [Google Scholar]
- 84.Yuan JM, Ambinder A, Fan Y, Gao YT, Yu MC, Groopman JD. Cancer Epidemiol., Biomarkers Prev. 2009;18:590–594. doi: 10.1158/1055-9965.EPI-08-0966. [DOI] [PMC free article] [PubMed] [Google Scholar]
- 85.Arbuthnot P, Kew M. Int. J. Exp. Pathol. 2001;82:77–100. doi: 10.1111/j.1365-2613.2001.iep0082-0077-x. [DOI] [PMC free article] [PubMed] [Google Scholar]
- 86.Kuang SY, Jackson PE, Wang JB, Lu PX, Munoz A, Qian GS, Kensler TW, Groopman JD. Proc. Natl. Acad. Sci. U. S. A. 2004;101:3575–3580. doi: 10.1073/pnas.0308232100. [DOI] [PMC free article] [PubMed] [Google Scholar]
- 87.ASTM Standard E178-08 . 2008, Standard Practice for Dealing With Outlying Observations. ASTM International; West Conshohocken, PA: 2008. DOI: 10.1520/e0178-08, http://www.astm.org/ [Google Scholar]
- 88.Kibbe WA. Nucleic Acids Res. 2007;35:W43–W46. doi: 10.1093/nar/gkm234. [DOI] [PMC free article] [PubMed] [Google Scholar]
- 89.Kirimli CE, Shih WH, Shih WY. Analyst. 2013;138:6117–6126. doi: 10.1039/c3an00384a. [DOI] [PubMed] [Google Scholar]
Associated Data
This section collects any data citations, data availability statements, or supplementary materials included in this article.


