

Abstract
During fasting, human skeletal muscle depends on lipid oxidation for its energy substrate metabolism. This is associated with the development of insulin resistance and a subsequent reduction of insulin-stimulated glucose uptake. The underlying mechanisms controlling insulin action on skeletal muscle under these conditions are unresolved. In a randomized design, we investigated eight healthy subjects after a 72-h fast compared with a 10-h overnight fast. Insulin action on skeletal muscle was assessed by a hyperinsulinemic euglycemic clamp and by determining insulin signaling to glucose transport. In addition, substrate oxidation, skeletal muscle lipid content, regulation of glycogen synthesis, and AMPK signaling were assessed. Skeletal muscle insulin sensitivity was reduced profoundly in response to a 72-h fast and substrate oxidation shifted to predominantly lipid oxidation. This was associated with accumulation of both lipid and glycogen in skeletal muscle. Intracellular insulin signaling to glucose transport was impaired by regulation of phosphorylation at specific sites on AS160 but not TBC1D1, both key regulators of glucose uptake. In contrast, fasting did not impact phosphorylation of AMPK or insulin regulation of Akt, both of which are established upstream kinases of AS160. These findings show that insulin resistance in muscles from healthy individuals is associated with suppression of site-specific phosphorylation of AS160, without Akt or AMPK being affected. This impairment of AS160 phosphorylation, in combination with glycogen accumulation and increased intramuscular lipid content, may provide the underlying mechanisms for resistance to insulin in skeletal muscle after a prolonged fast.
Keywords: Akt substrate of 160 kDa, skeletal muscle metabolism, fasting, insulin resistance in vivo, insulin signaling, TBC1D4
prolonged fasting is associated with reduced sensitivity to insulin (30). This phenomenon was first described in 1859 by Claude Bernard (3) and was termed “starvation diabetes.” Insulin resistance in skeletal muscle plays a key role in this adaptive response (4). During fasting, skeletal muscle switches its energy substrate metabolism predominantly to oxidation of lipids (30), and insulin-stimulated glucose uptake in skeletal muscle is reduced (4). The intracellular mechanisms that cause insulin resistance in skeletal muscle have been investigated intensely. In 1963, Randle et al. (36) proposed a theory of direct substrate competition where accumulation of citrate and glucose 6-phosphate (G6P) causes enzyme inhibition and reduced glucose uptake. This paradigm was challenged when NMR spectroscopy demonstrated reduced intramuscular G6P content in insulin-resistant muscle (38, 39). Instead, inhibition of proximal insulin signaling through insulin receptor substrate-1 (IRS-1) and reduced Akt phosphorylation was suggested as an underlying mechanism behind insulin resistance (23, 38, 39). However, this finding has not been consistent, and several reports have demonstrated that insulin sensitivity in skeletal muscle can be modulated despite normal phosphorylation of Akt (13, 18, 20, 21, 46, 47, 51). This indicates that, in addition to defects in proximal insulin signaling, alternative mechanisms downstream of Akt may cause insulin resistance.
The Rab-GTPase-activating protein Akt substrate of 160 kDa (AS160), also known as tre-2/USP6, BUB2, and cdc16 domain family member (TBC1D4), and the AS160 paralog TBC1D1 have been identified recently as regulators of insulin-stimulated glucose uptake (40). Of the two proteins, AS160 is the most extensively studied, and AS160 phosphorylation is reduced in patients with type 2 diabetes and their first-degree offspring (26, 27, 53). AS160 is thought to control the translocation of the glucose transporter 4 (GLUT4) from intracellular vesicles to the cell surface (40) by promoting hydrolysis of GTP to GDP on Rab proteins. The signal from the insulin receptor to AS160 is mediated through the serine/threonine kinase Akt (40), but AS160 can also be phosphorylated independently of Akt by the energy-sensing enzyme AMP-activated protein kinase (AMPK) (28, 48). Previously, most investigations of AS160 have used the phospho-Akt substrate (PAS) antibody. Although AS160 contains several Akt residues, the PAS antibody has been reported to recognize only phosphorylation on Thr642 (17, 25), and important information on AS160 regulation may not be detected with this antibody. The Ser341 site on AS160 has been shown to affect 14-3-3 binding (17), and with the use of phosphospecific antibodies it has been shown that improved insulin sensitivity is associated with increased insulin-stimulated AS160 phosphorylation at Ser318, Ser341, and Ser751 (49). Furthermore, insulin-stimulated phosphorylation of AS160 at site Ser318, Ser588, and Ser751 is reduced in patients with type 2 diabetes (53). This indicates that site-specific AS160 phosphorylation may be an important regulator of insulin-stimulated glucose uptake. TBC1D1 phosphorylation on AMPK consensus motifs in human skeletal muscle has been shown recently to be increased by physical exercise (15, 24). TBC1D1 also contains a full Akt consensus motif (Thr596) that is phosphorylated in response to insulin in mouse skeletal muscle (35, 52). However, it is not known whether insulin regulates TBC1D1 in human skeletal muscle.
The effects of a prolonged fast on insulin signaling to glucose transport in human skeletal muscle are incompletely understood. In a recent publication, insulin-stimulated Akt Ser473 and AS160 PAS phosphorylation were reduced after a 62-h fast (44). However, the subjects were clamped at significantly higher insulin levels in the control situation compared with the 62-h fasting condition (44), making it difficult to determine whether the decreased signaling was due to fasting or the lower insulin concentrations. Another report has examined insulin sensitivity after a 48-h fast (2). Muscle biopsies were obtained after a hyperinsulinemic euglycemic clamp was stopped, but at this time point insulin did not increase signaling under control or fasting conditions (2). Thus, studies of insulin signaling in human skeletal muscle after a prolonged fast are warranted, and AMPK regulation under these conditions remains to be investigated.
In the current study, we determined the effects of prolonged fasting on insulin signaling. For this purpose, we studied eight healthy subjects on two occasions that consisted of either an overnight fast as the control condition or a 72-h fast. We determined insulin-stimulated glucose uptake, substrate oxidation, and lipid accumulation. Glycogen content, glycogen synthase (GS) regulation, and phosphorylation levels of AS160, TBC1D1, Akt, and AMPK were determined in skeletal muscle biopsies. Our findings indicate that skeletal muscle insulin resistance after a 72-h fast is associated with site-specific impairment of AS160 phosphorylation and accumulation of intramyocellular lipids and glycogen. This was not associated with changes in the phosphorylation of the upstream kinases Akt and AMPK, suggesting that, under physiological conditions, insulin sensitivity can be modulated by specific regulation of AS160 phosphorylation independently of Akt and AMPK.
METHODS
Ethical approval.
All participants gave their written, informed consent after being given oral and written information regarding the study, in accordance with the Declaration of Helsinki II. The Aarhus County local ethics scientific committee approved the study.
Subjects.
Eight healthy men with no family history of diabetes participated. The average age was 26 ± 4 yr, body weight was 82.9 ± 8.8 kg, and body mass index was 23.8 ± 1.6 kg/m2. The subjects did not take prescription medicine.
Protocol.
In a randomized crossover design, subjects were examined on 2 days separated by >1 mo 1) after an overnight fast of 10 h (control condition) and 2) after 72-h fasting, during which subjects were allowed to drink tap water and perform normal ambulatory activities, excluding physical exercise. At 0800 (t = 0) the subjects were placed in a quiet, thermoneutral room on both examination days. For blood sampling, one intravenous catheter (Venflon; Viggo, Helsingborg, Sweden) was placed in a dorsal hand vein, and the hand was placed in a 65°C heated box for arterialization of the blood. Subjects were studied for 6 h from 0800 to 1400 (t = 0 to 360). After a 4-h basal period (t = 0–240), the blood glucose levels were clamped at ∼5 mM with an insulin (Actrapid; Novo Nordisk) infusion of 0.8 mU·kg−1·min−1 for the last 2 h of the study (t = 240–360). At t = 30 and 270 min, a 5- to 7-mm incision was made, using local anesthesia and sterile conditions, 12–15 cm proximal to the superior border of the patella, and a muscle specimen was obtained from the superficial border of the vastus lateralis of the quadriceps femoris muscle using the Bergström needle. The muscle tissue was immediately dissected free from fat and connective tissue and placed in liquid nitrogen.
Blood analysis.
Plasma glucose was immediately measured in duplicate on a Beckman Glucoanalyzer (Beckman Instruments, Palo Alto, CA) except during fasting, where whole blood glucose measurements were performed in duplicate on an Accu-Chek inform (F. Hoffmann-La Roche, Basel, Switzerland). Serum samples were frozen and stored at −20°C, and insulin was analyzed using time-resolved fluoroimmunoassay (TR-IFMA, AutoDELFIA; PerkinElmer, Turku, Finland). C-peptide was measured by ELISA (DakoCytomation, Cambridgeshire, UK), and free fatty acids (FFA) were analyzed by a commercial kit (Wako Chemicals, Neuss, Germany).
MRI spectroscopy.
1H-magnetic resonance spectroscopy was performed using a Sigma Excite 1.5 tesla twin speed scanner (GE Medical Systems). The subjects were examined at 0, 12, and 60 h of fasting. For logistic reasons, the last scan was performed in the evening before the examination day. To obtain muscle spectroscopy, subjects were positioned in supine position with feet first in the magnet bore, and the left calf was placed in a standard radio frequency transmit-receive extremity coil for radio frequency transmission and signal reception.
A transversal plane T1-weighted gradient echo pulse sequence with a repetition time (TR) of 140 ms and an echo time (TE) of 2.2/4.4 ms was performed to enable identification of the area of interest. The volume of interest was carefully positioned in a homogeneous part of the tibialis anterior muscle, avoiding visible vessels and connective tissue. Autoshimming was performed to optimize the magnetic field homogeneity. A water-suppressed, point-resolved spectroscopy sequence (TE: 30 ms; TR: 2,000 ms; no. of acquisitions: 128) was applied in triplicate, using water as the autocenter frequency. Full width at half-maximum of the unsuppressed water peak was 11.95 ± 0.097 Hz.
Indirect calorimetry.
The respiratory exchange ratio (RER) and resting energy expenditure were estimated by indirect calorimetry (Deltatrac monitor; Dantes Instrumentarium, Helsinki, Finland) performed at t = 180–210 and t = 300–330 of the basal and clamp period, respectively. The mean values of the last 25 min were used for calculations. Urine was collected during the basal period, and urea content was measured using the urease-Berthelot method (11). Oxidative glucose disposal was estimated after correction for protein oxidation, which was calculated on the basis of urea nitrogen excretion (12).
Glucose metabolism.
During the entire examination day a primed, continuous infusion of [3-3H]glucose (bolus 20 μCi, 0.12 μCixmin−1; NEN Life Science Products, Boston, MA) were performed. To minimize rapid dilution of the [3-3H]glucose during the hyperinsulinemic euglycemic clamp, [3-3H]glucose was added to the infused glucose (100 μCi [3-3H]glucose/500 ml 20% glucose).
Glucose rate of appearance (Ra) and disappearance (Ra) was estimated by Steele's equation (45). Endogenous glucose production (EGP) equals Ra of glucose under basal conditions, and during the clamp EGP is calculated by subtracting mean rate of exogenous glucose from glucose Ra.
Nonoxidative glucose disposal was estimated by subtracting oxidative glucose disposal from total glucose disposal (glucose Rd).
Glycogen.
Muscle samples were hydrolyzed in 2 M HCl at 100°C for 2 h, followed by neutralization with 2 M NaOH (54), and glucose content was measured by the hexokinase enzymatic method using a glucose hexokinase reagent (Eagle Diagnostics, Desoto, TX) (5).
Muscle GS activity was measured in the presence of 0.002, 0.17, and 8 mM G6P (unifilter 350 plates; Whatman, Cambridge, UK). GS activity is presented as G6P-independent GS activity (%I-form = 100 × activity in the presence of 0.02 mM G6P/activity in the presence of 8 mM G6P) and as percent of fractional velocity (%FV = 100 × activity in the presence of 0.17 mM G6P/activity in the presence of 8 mM G6P).
Western blotting.
Muscle biopsies were homogenized in an ice-cold buffer containing (in mM) 50 HEPES, 137 NaCl, 10 Na4P2O7, 10 NaF, 2 EDTA, 1 MgCl2, 1 CaCl2, and 2 Na3VO4 and 1% (vol/vol) Nonidet P-40, 10% (vol/vol) glycerol, 2 μg/ml aprotinin, 5 μg/ml leupeptin, 0.5 μg/ml pepstatin, 10 μg/ml antipain, 1.5 mg/ml benzamidine, and 100 μM 4-(-2-aminoethyl)-benzenesulfonyl fluoride, and hydrochloride (pH 7.4), and samples were rotated for 60 min at 4°C. Insoluble materials were removed by centrifugation at 16,000 g for 20 min at 4°C. Western blot analyses were used to assess protein and phosphorylation levels of various proteins. Antibodies to AMPKα1, AMPKα2, and phosphospecific (Ser79) Acetyl-CoA carboxylase (ACC) antibody were from Millipore (Billerica, MA). Polyclonal anti-COOH-terminal peptide GLUT4 antibody was produced as described previously (29). Phosphospecific TBC1D1 (Ser237 and Thr596) was generated as described previously (52). Phosphospecific AMPK (Thr172), Akt, phosphospecific Akt (Ser473 and Thr308), GS, phosphospecific GS (Ser641), GSK-3 (α and -β), phosphospecific GSK-3 (α and -β), cytochrome c, and AS160 antibodies were from Cell Signaling Technology (Beverly, CA). ACC expression was assessed using horseradish peroxidase-conjugated streptavidin (Pierce Chemical, Rockford, IL). Phosphospecific AS160 (Ser341, Ser588, Thr642, Ser704, and Ser751) antibodies were generated as described previously (17, 50). Proteins were visualized by BioWest enhanced chemiluminescence (Pierce) and quantified using UVP BioImaging System (UVP, Upland, CA). Quantifications of protein phosphorylation are expressed as a ratio of total protein expression measured on the same membranes.
Quantitative PCR.
Total RNA was isolated from muscle biopsies using Trizol (Gibco BRL, Life Technologies, Roskilde, Denmark); RNA was quantified by measuring absorbance at 260 and 280 nm with a ratio ≥1.8. Integrity of the RNA was checked by visual inspection of the two ribosomal RNAs, 18S and 28S, on an agarose gel. cDNA was synthesized with the TaqMan Gold RT-PCR kit (PerkinElmer, Boston, MA). Real-time PCR for GS was done with mRNA levels of β-actin as internal control. The following primers were used: GS (ACC TGG CTT ATT CCC AAC TGC TC and AGT GAC CTC AGG TTC TGG ATC ATG, 128 bp) and β-actin (ACG GGG TCA CCC ACA CTG TGC and CTA GAA GCA TTT GCG GTG GAC GAT G, 658 bp). The analyses were performed in duplicate using the KAPA SYBR FAST qPCR Kit (Kapa Biosystems, Woburn, MA) in an ICycler from Bio-Rad (Bio-Rad Laboratories, Hercules, CA).
Statistical analysis.
Results are expressed as means ± SE. Normal distribution was assessed by inspection of QQ plots, and the Levene Median test was used to test for equal variance. Comparisons between the main effects of 72 h of fasting and insulin stimulation were assessed by a two-way repeated-measurements ANOVA. When the two-way repeated-measurements ANOVA revealed significant differences, post hoc test multiple comparison procedures using Student-Newman-Keul's method were performed. Fasting effects before examination day were assessed by a one-way repeated-measurement ANOVA. Isolated comparisons between control and 72 h of fasting were assessed by a paired t-test. P < 0.05 was considered significant. The coefficient of variation of the intraindividual MR spectroscopy data was calculated as the standard deviation divided by the mean of triplicate measurements.
RESULTS
Substrate oxidation and insulin sensitivity.
The subjects lost 3.4 ± 1.2 kg during fasting, and this was associated with an ∼100% increase in plasma FFA levels, an ∼25% decrease in blood glucose concentrations, and an ∼50% reduction in insulin levels compared with the control day. Energy expenditure was not changed after a 72-h fast (Tables 1 and 2). Urine urea excretion rates were 14.09 ± 1.46 and 14.11 ± 0.78 mmol·kg−1·min−1 in the control and fasting condition, respectively. This was used to correct the relative contribution of lipid and glucose in substrate oxidation assessed from the RER. As shown in Fig. 1A, a 72-h fast decreased the RER to 0.76 compared with 0.83 in the control condition. This decrease in RER indicates a further shift in substrate metabolism toward lipid oxidation after 72 h of fasting compared with a 10-h overnight fast. Insulin stimulation increased the RER under the control condition but had no effect on the RER after 72 h of fasting. We measured protein expression of cytochrome c, a component of the electron transport chain in mitochondria and a marker of mitochondrial mass, but did not observe any changes in expression after 72 h of fasting (96.1 ± 7.1% of control, P = 0.60).
Table 1.
Hormone levels and energy expenditure under control and fasting conditions
|
t = 0 (Basal Condition) |
t = 360 (Clamp Condition) |
|||
|---|---|---|---|---|
| Control | Fasting | Control | Fasting | |
| Glucose, mM | 5.3 ± 0.10 | 3.9 ± 0.10* | 4.9 ± 0.10 | 5.0 ± 0.10 |
| Insulin, pM | 47 ± 6 | 22 ± 3* | 271.3 ± 7 | 265 ± 17 |
| C-peptide, pM | 604 ± 76 | 239 ± 41* | 307 ± 51 | 266 ± 48 |
| FFA, mM | 0.53 ± 0.10 | 1.17 ± 0.12* | 0.08 ± 0.02 | 0.23 ± 0.05* |
| Energy expenditure, kcal/day | 1,901 ± 44 | 1,981 ± 47 | 1,891 ± 43 | 1,915 ± 52 |
Values are means ± SE. FFA, free fatty acids. Glucose, insulin, C-peptide, and FFA levels in plasma were determined during examination days at t = 0 and t = 360 after an overnight fast of 10 h (control) and after a 72-h fast (fasting). Energy expenditure was estimated by indirect calorimetry at t = 180–210 and t = 300–330 (
P < 0.01 fasting vs. control).
Table 2.
Plasma measurements during fasting
| Fasting (h) | 0 | 12 | 60 | 72 |
|---|---|---|---|---|
| Glucose, mM | 5 ± 0.24 | 4.9 ± 0.16 | 4.5 ± 0.14 | 3.9 ± 0.10* |
| Insulin, pM | 299 ± 128 | 46 ± 11 | 20 ± 2 | 22 ± 3† |
| C-peptide, pM | 1,951 ± 482 | 497 ± 99 | 211 ± 58 | 239 ± 41* |
| FFA, mM | 0.24 ± 0.04 | 0.53 ± 0.07 | 0.82 ± 0.09 | 1.17 ± 0.12* |
Glucose, insulin, C-peptide, and FFA levels in plasma were monitored during the 72-h fasting period.
P < 0.01,
P < 0.05, 0- vs. 72-h fast.
Fig. 1.
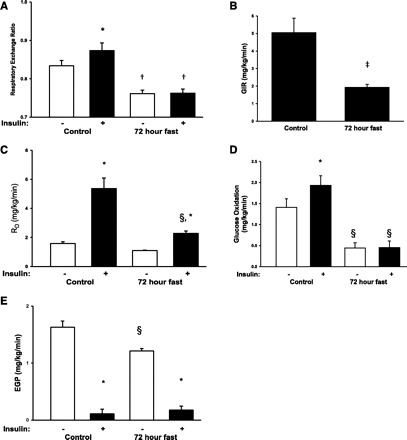
A: the respiratory exchange ratio (RER) was assessed before and after insulin stimulation after an overnight fast of 10 h (control condition) and after a 72-h fast. Throughout the figure, open bars indicate no insulin stimulation and filled bars indicate insulin stimulation. There was a significant interaction between insulin stimulation and fasting conditions (P < 0.05), and post hoc test showed that insulin increased RER only in the control condition (*P < 0.05 vs. basal within experimental day), and RER was reduced during fasting under both basal and insulin-stimulated situations (†P < 0.05 vs. control within insulin or basal). B: insulin sensitivity was assessed by a hyperinsulinemic euglycemic clamp. Insulin was infused at a rate of 0.8 mU·kg−1·min−1. The glucose infusion rate (GIR) under the last 30 min of the clamp was ∼60% lower after a 72-h fast (‡P < 0.05). C: the reduced GIR after 72 h of fasting was associated with a reduced rate of disappearance (Rd) for glucose. There was a significant interaction between insulin stimulation and fasting conditions (P < 0.01), and post hoc test showed that Rd during fasting was reduced by ∼60% (§P < 0.01 vs. control within insulin/basal). Although the effect of insulin was reduced after 72 h of fasting, there was still a significant increase in Rd during control and fasting conditions. Basal Rd was not reduced by fasting. D: 72-h fasting reduced glucose oxidation. There was a significant interaction between insulin stimulation and fasting conditions (P < 0.05), and insulin increased glucose oxidation only in the control condition. Glucose oxidation was decreased under both basal and insulin-stimulated conditions during fasting. E: similarly to Rd, endogenous glucose production (EGP) was reduced during fasting, and there was a significant interaction between insulin stimulation and fasting conditions (P < 0.01). Post hoc test showed that this was associated with reduced basal EGP during fasting, whereas insulin suppressed EGP in both situations. The EGP during insulin stimulation was similar after 72-h fasting compared with the control situation.
Insulin sensitivity was assessed by a hyperinsulinemic euglycemic clamp. Insulin was infused at a rate of 0.8 mU·kg−1·min−1. This increased plasma insulin concentrations to ∼270 pM, with no significant differences between control and fasting conditions. The glucose infusion rate in the last 30 min of the clamp was ∼60% lower after a 72-h fast (Fig. 1B). This was associated with a decreased Rd of glucose after a 72-h fast (Fig. 1C), a clear indication of skeletal muscle insulin resistance. However, insulin stimulation still increased Rd also after a 72-h fast, albeit at a significantly lower level (Fig. 1C). Glucose oxidation was decreased significantly during a 72-h fast, and insulin increased glucose oxidation only under control conditions (Fig. 1D). The reduced peripheral glucose uptake was not due to reduced expression of GLUT4 in skeletal muscle (93.5 ± 8.6% of control, P = 0.58). EGP was assessed on the basis of measurements of the specific activity of the [3-3H]glucose tracer (Fig. 1E). The EGP was reduced after 72 h of fasting. However, when stimulated with insulin, EGP was suppressed to ∼0.2 mg·kg−1·min−1 under both control and fasting conditions. This indicates that the observed insulin resistance after a 72-h fast can be attributed primarily to reduced peripheral glucose uptake and not liver insulin resistance.
Akt and AMPK phosphorylation.
Both Akt and AMPK are known upstream kinases of AS160 in skeletal muscle (40). Therefore, we first assessed phosphorylation of the two activating sites Ser473 and Thr308 on Akt. Insulin stimulation increased phosphorylation on both sites, and this was not affected by fasting (Fig. 2, A and B). We next assessed whether 72 h of fasting would affect the phosphorylation of AMPK, a positive regulator of insulin-independent glucose uptake. AMPK is activated by phosphorylation of the catalytic α-subunit, but the 72-h fast did not increase AMPK phosphorylation (Fig. 2C). Consistent with the AMPK results, phosphorylation of ACC, a well-known target of AMPK activity, was also not affected by 72 h of fasting (Fig. 2D). Insulin stimulation did not affect AMPK and ACC phosphorylation (Fig. 2, C and D), and protein expression of Akt, AMPK, and ACC was similar among all conditions.
Fig. 2.
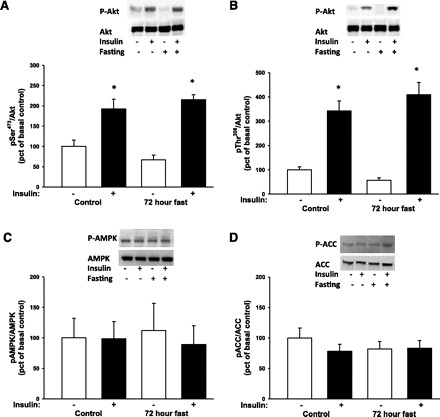
Phosphorylation (p) of the intracellular kinases Akt, AMP-activated protein kinase (AMPK), and acetyl-CoA carboxylase (ACC) in muscle biopsies taken before and during a hyperinsulinemic euglycemic clamp was assessed by Western blot analysis. Throughout the figure, open bars indicate no insulin stimulation and filled bars indicate insulin stimulation. A and B: there was a main effect of insulin stimulation, but not fasting, on Akt Ser473 and Thr308 under both control and fasting conditions (*P < 0.001). Post hoc tests showed no difference between experiment days within basal or insulin-stimulated situations. C and D: 72 h of fasting and insulin stimulation did not affect phosphorylation of the AMPK or the downstream target ACC.
AS160 and TBC1D1 phosphorylation.
We determined AS160 phosphorylation on five sites: Ser341, Ser588, Thr642, Ser704, and Ser751. In addition to the site-specific antibodies, we used the PAS antibody to assess AS160 phosphorylation. Insulin increased site-specific phosphorylation of all sites investigated as well as PAS phosphorylation (Fig. 3, A–F) under both control and fasting conditions. There were main effects of 72 h of fasting on AS160 phosphorylation on Ser341, Ser588, Ser704, and Ser751 but not on Thr642 or AS160 PAS phosphorylation. Post hoc tests showed decreased insulin-stimulated phosphorylation on Ser588, Ser704, and Ser751 during fasting, and, consistent with the lower plasma insulin levels after 72 h of fasting, basal phosphorylation of AS160 on Thr642, Ser341, Ser588, Ser751, and AS160 PAS phosphorylation was reduced (Fig. 3, E and F).
Fig. 3.
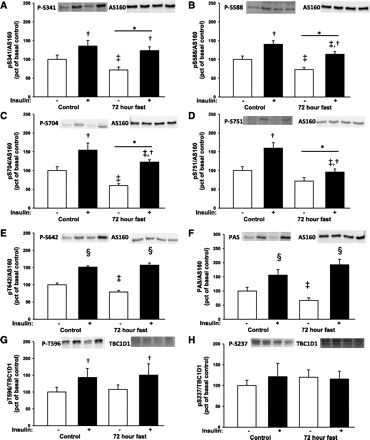
Site-specific phosphorylation of Akt substrate of 160 kDa (AS160) and phospho-Akt substrate (PAS) phosphorylation in muscle biopsies taken before and during a hyperinsulinemic euglycemic clamp was assessed by Western blot analysis. Throughout the figure, open bars indicate no insulin stimulation and filled bars indicate insulin stimulation. Representative blots show from left to right control situation before and after insulin stimulation and fasting conditions before and after insulin stimulation. A: there was main effect of a 72-h fast (*P < 0.05) and insulin stimulation (†P < 0.01) on Ser341 phosphorylation. Post hoc test showed a decrease in basal phosphorylation during fasting (‡P < 0.05 vs. control within insulin or basal) B: there was a main effect of a 72-h fast and insulin stimulation on Ser588 phosphorylation. Post hoc test showed that both basal and insulin-stimulated phosphorylation were reduced during fasting. C: there was a main effect of a 72-h fast and insulin stimulation on Ser704 phosphorylation. D: there was a main effect of a 72-h fast and insulin stimulation on Ser751 phosphorylation. E and F: there was a significant interaction of insulin and a 72-h fast (P < 0.001) on Thr642 or AS160 PAS phosphorylation. Post hoc test showed a significant insulin effect (§P < 0.001 vs. basal within experimental day). Basal phosphorylation was reduced during fasting, whereas insulin-stimulated phosphorylation was similar under fasting and control conditions. G: phosphorylation of the Akt consensus site Thr596 on TBC1D1 was increased during insulin stimulation (main effect of insulin P < 0.05), but there was no main effect of fasting. H: TBC1D1 phosphorylation at Ser237, an AMPK consensus site, was not affected by fasting or insulin.
Insulin stimulated TBC1D1 phosphorylation of the Akt consensus motif Thr596, and fasting did not modify this effect (Fig. 3G). Phosphorylation of the AMPK consensus motif Ser237 was not affected by insulin stimulation or 72-h fasting (Fig. 3H).
Skeletal muscle lipid content.
Accumulation of lipids and glycogen in skeletal muscle is associated with the development of insulin resistance (42, 43). Therefore, we determined the intramuscular lipid levels by MRI spectroscopy before and after 12 and 60 h of fasting. As shown in Fig. 4, the 60-h fasting was associated with an approximately twofold increase in skeletal muscle lipid content, whereas no change was observed between prefasting and the 12-h fasting. The median within-subject variation coefficient was 9.5% with a range of 1.7–41.6%.
Fig. 4.
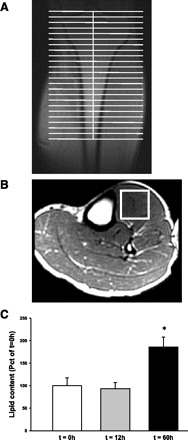
Intramuscular lipid content was determined by 1H-magnetic resonance spectroscopy. The patients were examined after 0, 12, and 60 h of fasting. A: to obtain muscle spectroscopy, volunteers were positioned in the supine position with feet first in the magnet bore and the left calf placed in a standard radio frequency transmit-receive extremity coil for radio frequency transmission and signal reception. B: a representative picture of an oblique plane T1-weighted gradient echo pulse sequence that was performed to enable identification of the area of interest. The volume of interest (white box) was positioned in a homogeneous part of the tibialis anterior muscle, avoiding visible vessels and connective tissue. The lipid content was quantified and presented as %t = 0 (open bar) and after 12 (gray bar) and 60 h of fasting (black bar). The lipid content increased ∼2-fold after 60 h of fasting, whereas no change was seen after a 12-h fast (*P < 0.01 vs. t = 0).
Skeletal muscle glycogen content and regulation of glycogen synthesis.
Seventy-two hours of fasting increased glycogen content by ∼10% (P < 0.05), and, as expected, we did not see a significant change in glycogen content after only 30 min into the hyperinsulinemic euglycemic clamp (Fig. 5A). Glycogen synthesis is inhibited by accumulation of glycogen in the muscle in a classical feedback loop, and in agreement with the increased glycogen level, nonoxidative glucose disposal decreased during fasting compared with control under insulin stimulation (Fig. 5B). Glycogen synthesis is regulated by the enzyme GS, and this enzyme is inactivated by phosphorylation. During fasting conditions GS activity was decreased, but insulin increased GS activity under both fasting and control conditions (Fig. 5, C and D). After 72 h of fasting, GS protein expression did not change, but GS gene expression was reduced by 33% (67.0 ± 6.1% of control, P < 0.05). Glycogen synthesis is also regulated by insulin through Akt and GSK3, which is inactivated by phosphorylation. In agreement with the insulin-stimulated Akt phosphorylation, phosphorylation of GSK-3α and -β increased during insulin stimulation, and this was not affected by fasting (Fig. 5, E and F). Consistent with the GS activity measurements, GS phosphorylation was increased significantly during fasting (Fig. 5G). Insulin tended to reduce GS phosphorylation, but this decrease did not reach statistical significance (main effect of insulin: P = 0.051; power of performed test: 0.44).
Fig. 5.
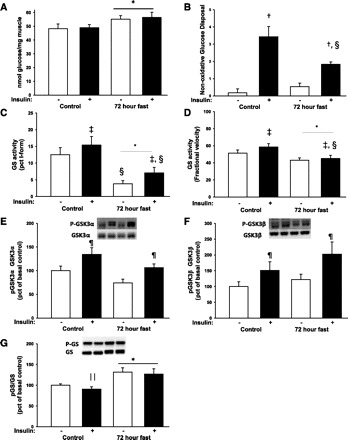
Glycogen content and regulation of glycogen metabolism were determined before and after a hyperinsulinemic euglycemic clamp. Throughout the figure, open bars indicate a non-insulin-stimulated condition and filled bars indicate insulin stimulation. A: there was a main effect of fasting on glycogen levels (*P < 0.05) with increased glycogen content in skeletal muscle after a 72-h fast. B: this was associated with a decreased, insulin-stimulated, nonoxidative glucose disposal after 72 h of fasting (fasting-insulin interaction, P < 0.05). Post hoc test showed that insulin increased nonoxidative glucose disposal (†P < 0.001 vs. basal within experimental day), but the insulin-stimulated level was significantly lower during fasting (§P < 0.05 vs. control within insulin or basal). There were no differences between experimental days in nonoxidative glucose disposal within the non-insulin-stimulated condition. C and D: glycogen synthase (GS) activity was reduced during fasting when measured as both %I-form (glucose 6-phosphate-independent GS activity) and as %fractional velocity (main effect of fasting, P < 0.05). Insulin stimulated GS activity under both fasting and control conditions (‡main effect of insulin, P < 0.05). Post hoc tests showed that both basal and insulin-stimulated GS activity as %I-form were reduced during fasting, whereas %fractional velocity was reduced only in the insulin-stimulated form. E and F: representative blots show from left to right control situation before and after insulin stimulation and fasting conditions before and after insulin stimulation. Insulin increased phosphorylation of the upstream kinase glycogen synthase kinase-3 (GSK-3; main effect of insulin: ¶P < 0.001), but there was no effect of 72 h of fasting. G: phosphorylation of GS increased after fasting. There was a trend toward reduced GS phosphorylation after insulin stimulation, but this did not reach statistical significance (main effect of insulin: P = 0.051), and post hoc test showed a significant reduction only with insulin stimulation within the control situation (∥P < 0.05 vs. basal within experimental day).
DISCUSSION
Insulin resistance in skeletal muscle plays an important role in the adaptive response to fasting (4). The current study demonstrates that a 72-h fast is associated with reduced phosphorylation of the Akt substrate AS160 but not TBC1D1. Using site-specific antibodies, we have determined that phosphorylation of AS160 at Ser341, Ser588, Ser704, and Ser751 is reduced in skeletal muscle, whereas TBC1D1 Thr596 was normal. This was associated with a modest increase in glycogen content and accumulation of intramuscular lipids.
Several lines of evidence suggest an important role of AS160 in glucose uptake in skeletal muscle (40), but little is known about the importance of the individual phosphorylation sites on AS160. The association with the reduced glucose uptake observed in the present study could indicate that Ser588, Ser704, and Ser751 are involved in regulating GAP activity and subsequent GLUT4 translocation. This is supported by a recent finding in patients with type 2 diabetes. In these insulin-resistant patients, insulin-stimulated phosphorylation of sites Ser318, Ser588, and Ser751 was reduced (53). When these individuals participated in a 10-wk endurance exercise program, phosphorylation at these AS160 sites was normalized (53). This was associated with improved insulin sensitivity (53), indicating a link between Ser318, Ser588, and Ser751 and insulin-stimulated glucose uptake in human muscle. However, despite reduced phosphorylation of Ser341, Ser588, Ser704, and Ser751 during fasting, insulin stimulation was still associated with increased phosphorylation of all four sites. The exact role of these phosphorylation sites on insulin action has thus not been determined. This could be addressed by expressing AS160 where Ser341, Ser588, Ser704, and Ser751 mutated to alanine in skeletal muscle, but such experiments have so far not been reported. Basal phosphorylation of AS160 on Ser341, Ser588, Ser704, and Thr642 was reduced during a 72-h fast, but this was not associated with a statistically significant reduction of glucose rate of disappearance. Studies using L6 myoblasts show that both GLUT1 and GLUT4 contribute to basal glucose uptake in muscle (37). Therefore, if AS160 phosphorylations regulate GLUT4 translocation, a clear correlation between AS160 phosphorylation and glucose uptake in the non-insulin-stimulated situation can not necessarily be expected.
Interestingly, Thr642 phosphorylation did not reflect changes in glucose uptake during fasting. Genetic knockin of AS160 with an alanine mutation at the equivalent residue for Thr642 in the mouse protein reduces insulin sensitivity and lowers GLUT4 cell surface levels in muscle (8). However, although impaired phosphorylation at Thr642 affects insulin-stimulated glucose uptake, our data show that insulin resistance in skeletal muscle is not alone explained by phosphorylation at this site. Thr642 has been suggested as the only phosphorylation site on AS160 recognized by the PAS antibody (17, 25), and consistent with these observations, insulin-stimulated PAS phosphorylation was also not affected during a 72-h fast. Previous investigations using the PAS antibody have found reduced phosphorylation in muscle from insulin-resistant patients with type 2 diabetes, and this is associated with impaired insulin signaling through Akt Thr308 (27, 53). In contrast with patients with diabetes, insulin resistance in nondiabetic subjects, as in this study, is not necessarily associated with decreased activation of Akt (13, 18, 21, 46, 51). Therefore, it is clear that reduced Akt phosphorylation alone does not provide the full explanation for insulin resistance in skeletal muscle. The AS160 paralog TBC1D1 also contains putative Akt phosphorylation sites (40), and TBC1D1 phosphorylation on Thr596 increased during insulin stimulation. However, fasting did not affect Thr596 phosphorylation. In mouse skeletal muscle, mutation of Thr590 (equivalent to Thr596 in human TBC1D1) to alanine along with three other conserved TBC1D1 phosphorylation sites had no effect on insulin-stimulated glucose uptake (1). Therefore, phosphorylation of this site may not be critical for insulin-stimulated glucose uptake.
The regulation of AMPK has so far not been examined in human skeletal muscle during a prolonged fast. In rodent muscles, AMPK is activated under fasting conditions, and similar observations have been done in C2C12 cells incubated in glucose-restricted buffer (7, 14). In humans, AMPK is rapidly activated when the AMP/ATP ratio is increased, and this can be observed, for example, during physical exercise (16). In contrast to rodents, fasting does not diminish muscle glycogen in human skeletal muscle (Refs. 9, 31, and 34 and the present study), and this indicates that energy-rich substrates have not been depleted. In agreement with these observations, AMPK phosphorylation was not increased after a 72-h fast. Similarly, phosphorylation of ACC and AS160 Ser704, both validated AMPK targets (19, 50), did not increase. This finding underlines the role of AMPK signaling as a system that is activated in response to an acute energy demand, as opposed to the long-term adaptation to fasting, and the reduced AS160 signaling was not due to alterations in AMPK activation.
Several mechanisms, apart from alterations in Akt and AMPK signaling, may inhibit phosphorylation of AS160 during a prolonged fast. Fasting reduces the intrinsic mitochondrial function in skeletal muscle, and this is associated with lipid accumulation (22). The accumulation of intramuscular lipids can activate novel PKCs (42), and these may interfere with AS160 phosphorylation (32). Physical exercise has also been found to augment insulin-stimulated phosphorylation of Ser588 and Ser751 in healthy individuals 4 h after an exercise bout (49). This could indicate that the reduced phosphorylation observed after fasting could be a detraining phenomenon. However, the subjects performed normal daily activities during the fast, and the expression of GLUT4 and cytochrome c was not changed. Both proteins are known to be downregulated during prolonged physical inactivity (6). In addition, we do not expect that differences in physical activity in the preclamp period affected AS160 phosphorylation since the clamp was performed after the subjects had rested >4 h under both control and fasting conditions at the research facilities. Therefore, it does not seem likely that the reduced Ser341, Ser588, Ser704, and Ser751 phosphorylation was due to acute or long-term differences in physical activity.
Endogenous glucose production was reduced in the basal state during a 72-h fast, most likely reflecting depletion of liver glycogen (33). In agreement with previous observations, insulin stimulation resulted in normal suppression of endogenous glucose production during fasting conditions (2), and there was thus no indication of hepatic insulin resistance. Unlike the liver, muscle glycogen content was increased after a 72-h fast. This is likely a result of decreased glucose oxidation during fasting in the non-insulin-stimulated condition. The capacity of skeletal muscle to perform high-intensity exercise is highly dependent on glycogen content (41), and from an evolutionary perspective it appears advantageous that glycogen levels are preserved during a prolonged fast. Glycogen synthesis in skeletal muscle is the principal pathway of glucose disposal during insulin stimulation (43). After 72 h of fasting, nonoxidative glucose disposal was decreased, and glycogen synthase was in its inactive phosphorylated form. The inhibition of glycogen synthesis was likely in part due to the increased glycogen content after 72 h of fasting, since glycogen is a negative regulator of glycogen synthesis (55). This accumulation of glycogen may also contribute to the reduced insulin-stimulated glucose uptake. Elevated levels of glycogen can reduce insulin-stimulated GLUT4 translocation (10), and increased glycogen content in combination with reduced phosphorylation of AS160 at Ser341, Ser588, Ser704, and Ser751, accumulation of intramuscular lipids, and possibly other unknown mechanisms together causes insulin resistance after a 72-h fast. Teasing out the relative contribution of each of these factors in human subjects is challenging and is more appropriately addressed in animal studies.
In conclusion, insulin resistance induced by a 72-h fast is associated with reduced phosphorylation of AS160 at Ser341, Ser588, Ser704, and Ser751 whereas neither AMPK phosphorylation nor insulin-stimulated phosphorylation of Akt was affected. Instead, prolonged fasting is associated with the accumulation of lipid and glycogen in muscle, and a combination of these factors and a site-specific impaired phosphorylation of AS160 are distinct features of insulin resistance under these conditions.
GRANTS
This work was supported by Danish Agency for Science Technology and Innovation Grant 271-07-0719 (to N. Jessen), the Lundbeck Foundation, and the Danish Medical Research Council. The Molecular Physiology Group, Department of Exercise and Sport Sciences, is part of the UNIK Project: Food, Fitness, and Pharma for Health and Disease, which is supported by the Danish Ministry of Science, Technology, and Innovation (to J. F. P. Wojtaszewski); the FOOD Study Group/Danish Ministry of Food, Agriculture, and Fisheries; and Ministry of Family and Consumer Affairs Grant 2101-05-0044 (to N. Møller).
DISCLOSURES
The authors declare no conflicts of interest.
AUTHOR CONTRIBUTIONS
M.H.V., H.S.-J., J.O.L.J., L.J.G., J.F.W., N.M., and N.J. did the conception and design of the research; M.H.V., B.F.F.C., J.T.T., L.M., T.K.-H., M.M., T.S.N., S.B.P., and N.J. performed the experiments; M.H.V., B.F.F.C., J.T.T., L.M., T.K.-H., M.M., T.S.N., S.B.P., J.F.W., and N.J. analyzed the data; M.H.V., B.F.F.C., J.T.T., L.M., T.K.-H., M.M., T.S.N., H.S.-J., S.B.P., J.O.L.J., L.J.G., J.F.W., N.M., and N.J. interpreted the results of the experiments; M.H.V., B.F.F.C., J.T.T., H.S.-J., S.B.P., J.O.L.J., L.J.G., J.F.W., N.M., and N.J. edited and revised the manuscript; M.H.V., B.F.F.C., J.T.T., L.M., T.K.-H., M.M., T.S.N., H.S.-J., S.B.P., J.O.L.J., L.J.G., J.F.W., N.M., and N.J. approved the final version of the manuscript; J.T.T. and N.J. prepared the figures; N.J. drafted the manuscript.
ACKNOWLEDGMENTS
We give special thanks to Annette Mengel, Lene Ring, Elsebeth Hornemann, and Hanne Fjelsted Petersen at Aarhus University Hospital, Aarhus, Denmark, for excellent technical assistance. The site and phosphospecific AS160 antibodies to Ser341, Ser588, Ser751, and Thr642 were made in a collaborative effort between J. F. P. Wojtaszewski and Juleen Zierath, Karolinska Institute, Stockholm, Sweden, and D. Grahame Hardie, Dundee University, Dundee, UK.
REFERENCES
- 1. An D, Toyoda T, Taylor EB, Yu H, Fujii N, Hirshman MF, Goodyear LJ. TBC1D1 regulates insulin- and contraction-induced glucose transport in mouse skeletal muscle. Diabetes 59: 1358–1365, 2010. [DOI] [PMC free article] [PubMed] [Google Scholar]
- 2. Bergman BC, Cornier MA, Horton TJ, Bessesen DH. Effects of fasting on insulin action and glucose kinetics in lean and obese men and women. Am J Physiol Endocrinol Metab 293: E1103–E1111, 2007. [DOI] [PubMed] [Google Scholar]
- 3. Bernard C. Leçons Sur Les Propriétés Physiologiques et Les Altérations Pathologiques des Liquides de L'organisme. Paris: Ballière, 1859, p. 79. [Google Scholar]
- 4. Björkman O, Eriksson LS. Influence of a 60-hour fast on insulin-mediated splanchnic and peripheral glucose metabolism in humans. J Clin Invest 76: 87–92, 1985. [DOI] [PMC free article] [PubMed] [Google Scholar]
- 5. Bondar RJ, Mead DC. Evaluation of glucose-6-phosphate dehydrogenase from Leuconostoc mesenteroides in the hexokinase method for determining glucose in serum. Clin Chem 20: 586–590, 1974. [PubMed] [Google Scholar]
- 6. Booth FW, Shanely RA. The biochemical basis of the health effects of exercise: an integrative view. Proc Nutr Soc 63: 199–203, 2004. [DOI] [PubMed] [Google Scholar]
- 7. Canto C, Jiang LQ, Deshmukh AS, Mataki C, Coste A, Lagouge M, Zierath JR, Auwerx J. Interdependence of AMPK and SIRT1 for metabolic adaptation to fasting and exercise in skeletal muscle. Cell Metab 11: 213–219, 2010. [DOI] [PMC free article] [PubMed] [Google Scholar]
- 8. Chen S, Wasserman DH, Mackintosh C, Sakamoto K. Mice with AS160/TBC1D4-Thr649Ala knockin mutation are glucose intolerant with reduced insulin sensitivity and altered GLUT4 trafficking. Cell Metab 13: 68–79, 2011. [DOI] [PMC free article] [PubMed] [Google Scholar]
- 9. De Bock K, Derave W, Eijnde BO, Hesselink MK, Koninckx E, Rose AJ, Schrauwen P, Bonen A, Richter EA, Hespel P. Effect of training in the fasted state on metabolic responses during exercise with carbohydrate intake. J Appl Physiol 104: 1045–1055, 2008. [DOI] [PubMed] [Google Scholar]
- 10. Derave W, Hansen BF, Lund S, Kristiansen S, Richter EA. Muscle glycogen content affects insulin-stimulated glucose transport and protein kinase B activity. Am J Physiol Endocrinol Metab 279: E947–E955, 2000. [DOI] [PubMed] [Google Scholar]
- 11. Fawcett JK, Scott JE. A rapid and precise method for the determination of urea. J Clin Pathol 13: 156–159, 1960. [DOI] [PMC free article] [PubMed] [Google Scholar]
- 12. Ferrannini E. The theoretical bases of indirect calorimetry: a review. Metabolism 37: 287–301, 1988. [DOI] [PubMed] [Google Scholar]
- 13. Friedrichsen M, Poulsen P, Richter EA, Hansen BF, Birk JB, Ribel-Madsen R, Stender-Petersen K, Nilsson E, Beck-Nielsen H, Vaag A, Wojtaszewski JF. Differential aetiology and impact of phosphoinositide 3-kinase (PI3K) and Akt signalling in skeletal muscle on in vivo insulin action. Diabetologia 53: 1998–2007, 2010. [DOI] [PubMed] [Google Scholar]
- 14. Frier BC, Jacobs RL, Wright DC. Interactions between the consumption of a high-fat diet and fasting in the regulation of fatty acid oxidation enzyme gene expression: an evaluation of potential mechanisms. Am J Physiol Regul Integr Comp Physiol 300: R212–R221, 2011. [DOI] [PubMed] [Google Scholar]
- 15. Frøsig C, Pehmøller C, Birk JB, Richter EA, Wojtaszewski JF. Exercise-induced TBC1D1 Ser237 phosphorylation and 14-3-3 protein binding capacity in human skeletal muscle. J Physiol 588: 4539–4548, 2010. [DOI] [PMC free article] [PubMed] [Google Scholar]
- 16. Fujii N, Jessen N, Goodyear LJ. AMP-activated protein kinase and the regulation of glucose transport. Am J Physiol Endocrinol Metab 291: E867–E877, 2006. [DOI] [PubMed] [Google Scholar]
- 17. Geraghty KM, Chen S, Harthill JE, Ibrahim AF, Toth R, Morrice NA, Vandermoere F, Moorhead GB, Hardie DG, Mackintosh C. Regulation of multisite phosphorylation and 14-3-3 binding of AS160 in response to IGF-1, EGF, PMA and AICAR. Biochem J 407: 231–241, 2007. [DOI] [PMC free article] [PubMed] [Google Scholar]
- 18. Gormsen LC, Jessen N, Gjedsted J, Gjedde S, Nørrelund H, Lund S, Christiansen JS, Nielsen S, Schmitz O, Møller N. Dose-response effects of free fatty acids on glucose and lipid metabolism during somatostatin blockade of growth hormone and insulin in humans. J Clin Endocrinol Metab 92: 1834–1842, 2007. [DOI] [PubMed] [Google Scholar]
- 19. Hardie DG. Regulation of fatty acid and cholesterol metabolism by the AMP-activated protein kinase. Biochim Biophys Acta 1123: 231–238, 1992. [DOI] [PubMed] [Google Scholar]
- 20. Hoeg L, Roepstorff C, Thiele M, Richter EA, Wojtaszewski JF, Kiens B. Higher intramuscular triacylglycerol in women does not impair insulin sensitivity and proximal insulin signaling. J Appl Physiol 107: 824–831, 2009. [DOI] [PubMed] [Google Scholar]
- 21. Høeg LD, Sjøberg KA, Jeppesen J, Jensen TE, Frøsig C, Birk JB, Bisiani B, Hiscock N, Pilegaard H, Wojtaszewski JF, Richter EA, Kiens B. Lipid-induced insulin resistance affects women less than men and is not accompanied by inflammation or impaired proximal insulin signaling. Diabetes 60: 64–73, 2011. [DOI] [PMC free article] [PubMed] [Google Scholar]
- 22. Hoeks J, van Herpen NA, Mensink M, Moonen-Kornips E, van Beurden D, Hesselink MK, Schrauwen P. Prolonged fasting identifies skeletal muscle mitochondrial dysfunction as consequence rather than cause of human insulin resistance. Diabetes 59: 2117–2125, 2010. [DOI] [PMC free article] [PubMed] [Google Scholar]
- 23. Itani SI, Ruderman NB, Schmieder F, Boden G. Lipid-induced insulin resistance in human muscle is associated with changes in diacylglycerol, protein kinase C, and IkappaB-alpha. Diabetes 51: 2005–2011, 2002. [DOI] [PubMed] [Google Scholar]
- 24. Jessen N, An D, Lihn AS, Nygren J, Hirshman MF, Thorell A, Goodyear LJ. Exercise increases TBC1D1 phosphorylation in human skeletal muscle. Am J Physiol Endocrinol Metab 301: E164–E171, 2011. [DOI] [PMC free article] [PubMed] [Google Scholar]
- 25. Kane S, Sano H, Liu SC, Asara JM, Lane WS, Garner CC, Lienhard GE. A method to identify serine kinase substrates. Akt phosphorylates a novel adipocyte protein with a Rab GTPase-activating protein (GAP) domain. J Biol Chem 277: 22115–22118, 2002. [DOI] [PubMed] [Google Scholar]
- 26. Karlsson HK, Ahlsen M, Zierath JR, Wallberg-Henriksson H, Koistinen HA. Insulin signaling and glucose transport in skeletal muscle from first-degree relatives of type 2 diabetic patients. Diabetes 55: 1283–1288, 2006. [DOI] [PubMed] [Google Scholar]
- 27. Karlsson HK, Zierath JR, Kane S, Krook A, Lienhard GE, Wallberg-Henriksson H. Insulin-stimulated phosphorylation of the Akt substrate AS160 is impaired in skeletal muscle of type 2 diabetic subjects. Diabetes 54: 1692–1697, 2005. [DOI] [PubMed] [Google Scholar]
- 28. Kramer HF, Witczak CA, Fujii N, Jessen N, Taylor EB, Arnolds DE, Sakamoto K, Hirshman MF, Goodyear LJ. Distinct signals regulate AS160 phosphorylation in response to insulin, AICAR, and contraction in mouse skeletal muscle. Diabetes 55: 2067–2076, 2006. [DOI] [PubMed] [Google Scholar]
- 29. Lund S, Flyvbjerg A, Holman GD, Larsen FS, Pedersen O, Schmitz O. Comparative effects of IGF-I and insulin on the glucose transporter system in rat muscle. Am J Physiol Endocrinol Metab 267: E461–E466, 1994. [DOI] [PubMed] [Google Scholar]
- 30. Lundbaek K. Metabolic abnormalities in starvation diabetes. Yale J Biol Med 20: 533–544, 1948. [PMC free article] [PubMed] [Google Scholar]
- 31. Maughan RJ, Williams C. Muscle citrate content and the regulation of metabolism in fed and fasted human skeletal muscle. Clin Physiol 2: 21–27, 1982. [DOI] [PubMed] [Google Scholar]
- 32. Ng Y, Ramm G, Burchfield JG, Coster AC, Stockli J, James DE. Cluster analysis of insulin action in adipocytes reveals a key role for Akt at the plasma membrane. J Biol Chem 285: 2245–2257, 2010. [DOI] [PMC free article] [PubMed] [Google Scholar]
- 33. Nilsson LH, Hultman E. Liver glycogen in man—the effect of total starvation or a carbohydrate-poor diet followed by carbohydrate refeeding. Scand J Clin Lab Invest 32: 325–330, 1973. [DOI] [PubMed] [Google Scholar]
- 34. Nybo L, Pedersen K, Christensen B, Aagaard P, Brandt N, Kiens B. Impact of carbohydrate supplementation during endurance training on glycogen storage and performance. Acta Physiol (Oxf) 197: 117–127, 2009. [DOI] [PubMed] [Google Scholar]
- 35. Pehmøller C, Treebak JT, Birk JB, Chen S, Mackintosh C, Hardie DG, Richter EA, Wojtaszewski JF. Genetic disruption of AMPK signaling abolishes both contraction- and insulin-stimulated TBC1D1 phosphorylation and 14-3-3 binding in mouse skeletal muscle. Am J Physiol Endocrinol Metab 297: E665–E675, 2009. [DOI] [PMC free article] [PubMed] [Google Scholar]
- 36. Randle PJ, Hales CN, Garland PB, Newsholme EA. The glucose fatty acid cycle: its role in insulin sensitivity and the metabolic disturbance of diabetes mellitus. Lancet 1: 785–789, 1963. [DOI] [PubMed] [Google Scholar]
- 37. Robinson R, Robinson LJ, James DE, Lawrence JC., Jr Glucose transport in L6 myoblasts overexpressing GLUT1 and GLUT4. J Biol Chem 268: 22119–22126, 1993. [PubMed] [Google Scholar]
- 38. Roden M, Krssak M, Stingl H, Gruber S, Hofer A, Furnsinn C, Moser E, Waldhausl W. Rapid impairment of skeletal muscle glucose transport/phosphorylation by free fatty acids in humans. Diabetes 48: 358–364, 1999. [DOI] [PubMed] [Google Scholar]
- 39. Roden M, Price TB, Perseghin G, Petersen KF, Rothman DL, Cline GW, Shulman GI. Mechanism of free fatty acid-induced insulin resistance in humans. J Clin Invest 97: 2859–2865, 1996. [DOI] [PMC free article] [PubMed] [Google Scholar]
- 40. Sakamoto K, Holman GD. Emerging role for AS160/TBC1D4 and TBC1D1 in the regulation of GLUT4 traffic. Am J Physiol Endocrinol Metab 295: E29–E37, 2008. [DOI] [PMC free article] [PubMed] [Google Scholar]
- 41. Saltin B. Metabolic fundamentals in exercise. Med Sci Sports 5: 137–146, 1973. [PubMed] [Google Scholar]
- 42. Samuel VT, Petersen KF, Shulman GI. Lipid-induced insulin resistance: unravelling the mechanism. Lancet 375: 2267–2277, 2010. [DOI] [PMC free article] [PubMed] [Google Scholar]
- 43. Shulman GI, Rothman DL, Jue T, Stein P, DeFronzo RA, Shulman RG. Quantitation of muscle glycogen synthesis in normal subjects and subjects with non-insulin-dependent diabetes by 13C nuclear magnetic resonance spectroscopy. N Engl J Med 322: 223–228, 1990. [DOI] [PubMed] [Google Scholar]
- 44. Soeters MR, Sauerwein HP, Dubbelhuis PF, Groener JE, Ackermans MT, Fliers E, Aerts JM, Serlie MJ. Muscle adaptation to short-term fasting in healthy lean humans. J Clin Endocrinol Metab 93: 2900–2903, 2008. [DOI] [PubMed] [Google Scholar]
- 45. Steele R. Influences of glucose loading and of injected insulin on hepatic glucose output. Ann NY Acad Sci 82: 420–430, 1959. [DOI] [PubMed] [Google Scholar]
- 46. Storgaard H, Jensen CB, Björnholm M, Song XM, Madsbad S, Zierath JR, Vaag AA. Dissociation between fat-induced in vivo insulin resistance and proximal insulin signaling in skeletal muscle in men at risk for type 2 diabetes. J Clin Endocrinol Metab 89: 1301–1311, 2004. [DOI] [PubMed] [Google Scholar]
- 47. Storgaard H, Song XM, Jensen CB, Madsbad S, Björnholm M, Vaag A, Zierath JR. Insulin signal transduction in skeletal muscle from glucose-intolerant relatives of type 2 diabetic patients [corrected]. Diabetes 50: 2770–2778, 2001. [DOI] [PubMed] [Google Scholar]
- 48. Treebak JT, Birk JB, Rose AJ, Kiens B, Richter EA, Wojtaszewski JF. AS160 phosphorylation is associated with activation of α2β2γ1- but not α2β2γ3-AMPK trimeric complex in skeletal muscle during exercise in humans. Am J Physiol Endocrinol Metab 292: E715–E722, 2007. [DOI] [PubMed] [Google Scholar]
- 49. Treebak JT, Frøsig C, Pehmøller C, Chen S, Maarbjerg SJ, Brandt N, MacKintosh C, Zierath JR, Hardie DG, Kiens B, Richter EA, Pilegaard H, Wojtaszewski JF. Potential role of TBC1D4 in enhanced post-exercise insulin action in human skeletal muscle. Diabetologia 52: 891–900, 2009. [DOI] [PMC free article] [PubMed] [Google Scholar]
- 50. Treebak JT, Taylor EB, Witczak CA, An D, Toyoda T, Koh HJ, Xie J, Feener EP, Wojtaszewski JF, Hirshman MF, Goodyear LJ. Identification of a novel phosphorylation site on TBC1D4 regulated by AMP-activated protein kinase in skeletal muscle. Am J Physiol Cell Physiol 298: C377–C385, 2010. [DOI] [PMC free article] [PubMed] [Google Scholar]
- 51. Tsintzas K, Chokkalingam K, Jewell K, Norton L, Macdonald IA, Constantin-Teodosiu D. Elevated free fatty acids attenuate the insulin-induced suppression of PDK4 gene expression in human skeletal muscle: potential role of intramuscular long-chain acyl-coenzyme A. J Clin Endocrinol Metab 92: 3967–3972, 2007. [DOI] [PubMed] [Google Scholar]
- 52. Vichaiwong K, Purohit S, An D, Toyoda T, Jessen N, Hirshman MF, Goodyear LJ. Contraction regulates site-specific phosphorylation of TBC1D1 in skeletal muscle. Biochem J 431: 311–320, 2010. [DOI] [PMC free article] [PubMed] [Google Scholar]
- 53. Vind BF, Pehmøller C, Treebak JT, Birk JB, Hey-Mogensen M, Beck-Nielsen H, Zierath JR, Wojtaszewski JF, Højlund K. Impaired insulin-induced site-specific phosphorylation of TBC1 domain family, member 4 (TBC1D4) in skeletal muscle of type 2 diabetes patients is restored by endurance exercise-training. Diabetologia 54: 157–167, 2011. [DOI] [PubMed] [Google Scholar]
- 54. Witczak CA, Hirshman MF, Jessen N, Fujii N, Seifert MM, Brandauer J, Hotamisligil GS, Goodyear LJ. JNK1 deficiency does not enhance muscle glucose metabolism in lean mice. Biochem Biophys Res Commun 350: 1063–1068, 2006. [DOI] [PMC free article] [PubMed] [Google Scholar]
- 55. Wojtaszewski JF, Nielsen P, Kiens B, Richter EA. Regulation of glycogen synthase kinase-3 in human skeletal muscle: effects of food intake and bicycle exercise. Diabetes 50: 265–269, 2001. [DOI] [PubMed] [Google Scholar]