Abstract
Background:
γ-oryzanol is a major bioactive constituent in rice. Most of the literature reports isolation of 24-methylenecycloartanyl ferulate (24-mCAF) from rice bran oil (RBO) of other than Indian variety. Current research has successfully applied high-performance thin layer chromatography (HPTLC) method for isolation of 24-mCAF from Indian variety (Indrayani) of RBO.
Materials and Methods:
HPTLC method was developed for standard γ-oryzanol using tinidazole as an internal standard. The proposed HPTLC method was optimized and validated as per the guidelines stated by the International Conference on Harmonization Q2 R1 recommendations. The mobile phase composed of toluene:ethyl acetate:methanol (15.0:1.7:3.3, (v/v/v) was selected because well-resolved peaks were obtained. The optimum wavelength chosen for detection and quantitation was 317 nm.
Results:
The retention factors for tinidazole, 24-mCAF, and CAF were found to be 0.27 ± 0.02, 0.72 ± 0.02, and 0.79 ± 0.02, respectively. The percent content of 24-mCAF in ethanol fraction was found to be 1.02%. The 24-mCAF was isolated from RBO using HPTLC method.
Conclusion:
The characterization data of 1D, 2D spectral analysis confirm that the isolated compound 1 is 24-mCAF.
SUMMARY
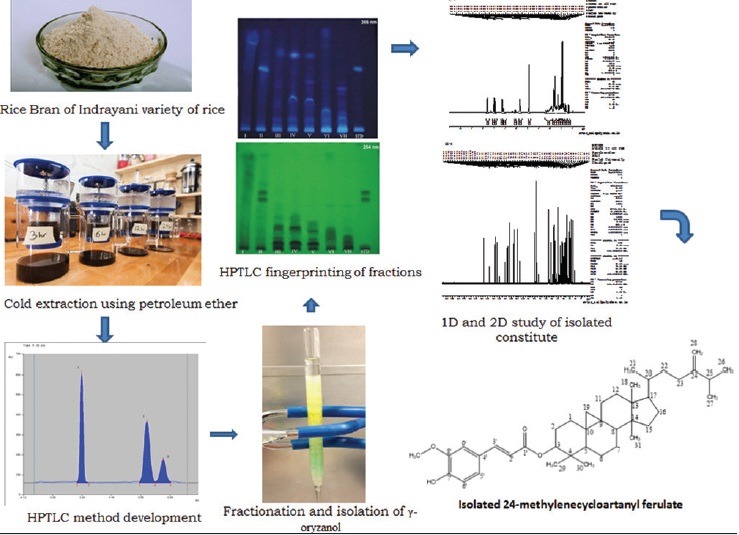
HPTLC method was developed for standard γ-oryzanol using tinidazole as an internal standard
The proposed HPTLC method was optimized and validated as per the guidelines stated by the ICH Q2 R1 recommendations
The characterization data of 1D, 2D spectral analysis confirms that the isolated compound is 24-methylenecycloartanyl ferulate
In this work, high purity 24-mCAF was successfully isolated from crude RBO using HPTLC with a solvent system composed toluene: ethyl acetate: methanol (15.0:1.7:3.3, v/v/v)
Abbreviations used: RBO: Rice Bran Oil, CAF: Cycloartenol ferulic acid, 24-mCAF: 24-Methylcycloartenol ferulic acid, HPLC: High-Performance Liquid Chromatography, HPTLC: High-Performance Thin Layer Chromatography, 1H: Proton nuclear magnetic resonance spectroscopy, 13C: Carbon-13 nuclear magnetic resonance spectroscopy, COSY: Correlation spectroscopy, NOESY: Nuclear overhauser effect spectroscopy, HMBC: Heteronuclear multiple bond correlation nuclear magnetic resonance spectroscopy, HSQC: heteronuclear single quantum coherence nuclear magnetic resonance spectroscopy.
Keywords: 24-methylenecycloartanyl ferulate, fractionation, high-performance thin layer chromatography, γ-oryzanol
INTRODUCTION
More than half of the world's population consumes rice as a main component of their diet. Rice provides energy in the form of carbohydrate and also has medicinal properties. Rice is utilized in conventional medicines as a medication for inflammation, gastrointestinal ailments, hypercholesterolemia, diabetes, and skin diseases. Experimental and clinical data demonstrate that rice bran oil (RBO) reduces hypercholesterolemia and cardiovascular risk, it also has an anti-inflammatory and immunostimulatory. This medicinal effect of the rice and RBO is attributed to its chemical constituents.[1]
The main constituent of kernel is starch (about 70%) in addition to simple carbohydrates such as glucose, fructose, and saccharose. Lipids present are oleic and linoleic acids whereas main proteins are prolamins, glutelins, globulins, and albumins. Phenols comprise flavonoids as tricin plus tricinin and various phenolic acids such as ferulic, coumaric, sinapic, protocatechuic, chlorogenic, hydroxybenzoic, vanillic, syringic, caffeic, and gallic acids.[2] Other secondary metabolites consist of tocopherols and tocotrienols (Vitamin E), the sterols; β-sitosterol, γ-sitosterol and campesterol, the diterpenes momilactone A and B, along with B-group vitamins as thiamin, riboflavin along with niacin.[3,4] Bran dry extract comprises 18% protein, 24% lipids, and 38% sugars. Secondary metabolites and bioactive molecules are also found in bran extracts as aliphatic alcohols, steroids, triterpenes, plus their glycosylated derivatives, anthracene derivatives, along with terpenoids.[5] RBO is extracted from rice bran using petroleum ether or n-hexane contains about 47% monounsaturated, 33% polyunsaturated, and 20% saturated fats. Main fatty acids are present in RBO such as oleic (about 42%), linoleic (40%), palmitic (15%), stearic (2%), linolenic (1%), arachidonic (0.5%), and behenic (0.2%).[6] The unsaponifiable fraction contains 4% of the total amount and it holds phytosterols such as campesterol and stigmasterol. Moreover, the same fraction contains 13-sytosterol, triterpenic alcohols such as cycloartenol ferulic acid (CAF) and 24-methylcycloartenol ferulic acid (24-mCAF) (components of γ-oryzanol), aliphatic alcohols, and hydrocarbons.[6] Antioxidants such as tocopherols, tocotrienols, and γ-oryzanol are also found in RBO extracted. γ-oryzanol is composed of trans-ferulic acid esters of triterpene alcohols and sterols, of which CAF and 24-mCAF are present in high concentration.[7]
Researchers have successfully isolated γ-oryzanol from crude RBO by recrystallization,[8] silica gel column chromatography[9] along with preparative high-performance liquid chromatography (HPLC).[10] High-speed countercurrent chromatography was also successfully applied in separating γ-oryzanol from RBO with a nonaqueous solvent system (heptane:acetonitrile:butanol in the proportion 1.8:1.4:0.7, v/v/v) using the dual model. However, there is no report on the direct isolation of individual 24-mCAF from Indian variety of RBO. As the primary bioactive constituents in γ-oryzanol are CAF, and 24-mCAF which have similar chemical structures with poor solubility in HPLC mobile phases, which became a huge obstacle for the application of preparative HPLC. Thus, an effective isolation of the 24-mCAF from RBO is still a challenge. Recently, high-performance thin layer chromatography (HPTLC) is gaining more interest and has been extensively used in the isolation of bioactive components or similar compounds from complex matrices.
In the present study, an efficient HPTLC method for isolation and purification of 24-mCAF from Indian variety (Indrayani) of RBO was developed. Characterization and analysis of the 24-mCAF was accomplished using 1H, 13C, correlation spectroscopy, nuclear overhauser effect spectroscopy (NOESY), heteronuclear multiple bond correlation (HMBC), and heteronuclear single quantum coherence (HSQC) nuclear magnetic resonance (NMR) techniques.
MATERIALS AND METHODS
Tinidazole was gifted by Aarti Drugs, Mumbai, India, and was used as an internal standard. γ-oryzanol (i.e. mixture of 24-mCAF and CAF) was purchased from ZK Biochem Group, China. Rice bran of Indian variety of Indrayani rice was used for this study and was purchased from Radheshyam Poha Mill, Pune. Analytical grade solvents and chemicals were purchased from Merck, Mumbai. Precoated HPTLC plates (Merck silica gel 60 F254, aluminum sheet as a support, 20 cm × 20 cm) and microliter syringe (Hamilton, Switzerland) were purchased from Anchrom Enterprises (I) Pvt. Ltd., Mumbai. Column grade Silica (80–120#) and thin layer chromatography (TLC) grade silica gel G were obtained from S.D Fine Chem., Mumbai. Borosil glass column (height, 60 cm; diameter, 3 cm) (J-Sil, Mumbai) was purchased from Yash Enterprises, Pune. Double-distilled water filtered through 0.45 μ filter paper was used in the research work.
Method development for 24-methylenecycloartanyl ferulate
Instruments used and experimental conditions
The sample solutions were applied on prewashed and activated precoated silica gel aluminum HPTLC plate 60F254 (20 cm × 10 cm) in the form of bands of 6 mm width with a Hamilton syringe (100 μL) using a Camag Linomat V (Switzerland) sample applicator. The slit dimension was 5 mm × 0.45 mm and 10 mm/s scanning speed was employed. HPTLC plate was then developed, at a constant temperature, with 20 mL mobile phase consisting of toluene:ethyl acetate:methanol (15.0:1.7:3.3, v/v/v). Linear ascending development was carried out in 20 cm × 10 cm twin trough glass chamber (Camag, Muttenz, Switzerland) saturated with the mobile phase. The optimized chamber saturation time for mobile phase was 15 min at room temperature (25 ± 2°C) at a relative humidity of 60 ± 5%. The length of chromatogram run was 8 cm. Densitometric scanning was performed within 10 min after chromatographic development using Camag TLC scanner III with Camag TLC scanner III with winCATS soft ware version 1.4.4 (Camag, Muttenz, Switzerland) in the reflectance mode at 317 nm.
Preparation of standard stock solutions
Standard stock solutions of tinidazole and γ-oryzanol were prepared separately by dissolving 10 mg each in 10 mL methanol and 10 mL ethanol, respectively, to get concentration of 1000 μg/mL. These stock solutions were used for further studies.
Selection of detection wavelength
Following chromatographic development, bands were scanned over the range of 400–700 nm and the spectra were observed. It was recognized that tinidazole and γ-oryzanol exhibit considerable absorbance at 317 nm and hence, wavelength 317 nm was selected for the analysis.
Preparation of sample solutions
Extraction of rice bran oil
Bran of Indrayani rice (Indian variety) purchased from Radheshyam Poha Mill, Pune, was stored in a refrigerator before use. Crude RBO was extracted from rice bran (2 kg) by macerating for 24 h using petroleum ether (60–80) as the solvent. The same procedure was repeated with same rice bran powder with fresh petroleum ether for 3 times. These three extracts were combined and concentrated on a rotary evaporator under vacuum at 40°C to obtain 208.40 g (10.4%) RBO. From this obtained RBO, 3 mL each was placed in two glass tubes. The RBO from first test tube was treated with 5 mL methanol. This oil was mixed with methanol followed by 5 min vigorous shaking. The tube was set aside for 5 min more. Supernatant was removed and collected in another test tube. Fresh 5 mL methanol was added in the remaining RBO, and the procedure was repeated for 3 more times to obtain 20 mL of methanol fraction. This collected methanol fractions were mixed and concentrated on rotary evaporator. This concentrated fraction was used for spotting samples on plate. Remaining RBO in the tube was extracted with absolute ethanol (5 mL). The procedure used for collecting ethanol fractions was identical with procedure for methanol fractions. Then, remaining oil in the tube was dissolved in ethyl acetate (5 mL) and it was also spotted on the plates to verify the complete extraction of 24-mCAF.
The second tube containing RBO (3 mL) was treated with ethanol (5 mL). The mixture was mixed vigorously and set aside for 5 min and supernatant was collected. The procedure was repeated 4 times and 25 mL of supernatant containing ethanol fraction was obtained. All the fractions were mixed and concentrated by using rotary evaporator. These ethanol fractions were used for HPTLC spotting. Oil remained in the test tube was dissolved in 5 mL ethyl acetate and it was also spotted on the plates to verify the complete extraction of 24-mCAF.
Construction of calibration plots
Linearity was assessed in the range of 200–1400 ng/spot for 24-mCAF. For construction of calibration plots, 24-mCAF was applied as 0.2, 0.4, 0.6, 0.8, 1.0, 1.2, and 1.5 μL to the plates which were then chromatographed and scanned as described above. Peak area versus concentration was subjected to least square linear regression analysis; the intercept, slope, and correlation coefficient were obtained. Residual analysis was carried out to ascertain linearity. Limit of detection (LOD) and limit of quantitation (LOQ) were determined as 3.3 and 10 σ/S, respectively, where S is the slope of the calibration plot and σ is the standard deviation of the response (y-intercept).
Assay validation
The proposed HPTLC method was optimized and validated as per the guidelines stated by the International Conference on Harmonization Q2 (R1) recommendations for accuracy, precision, linearity, robustness, and system suitability.[10]
Precision studies
In order to judge the efficacy of the proposed HPTLC method, precision was determined. The precision of the proposed HPTLC method was verified by intra-day and inter-day precision studies. Set of three different concentrations in three replicates of mixed standard solutions of 24-mCAF (200, 600 and 1000 ng/spot) was prepared. All the solutions were analyzed on the same day to record any intra-day variations in the results. Inter-day precision study involves analysis of three different concentrations of the mixed standard solutions in linearity range on three consecutive days.
Specificity
The specificity of the proposed HPTLC method was determined by analyzing the standard marker of 24-mCAF and sample solution. Peaks for 24-mCAF was confirmed by comparing at the peak start, peak apex, and peak end positions of the spot, i.e., r (start, middle) and r (middle, end). Other constituents present in the RBO did not interfere with the peaks of 24-mCAF.
Accuracy studies
Accuracy studies were performed to study the suitability and reliability of the method. Accuracy studies were performed in triplicate by standard addition method. Accuracy was determined using percentage recoveries of known amounts of 24-mCAF added to solutions extract. The samples were spiked with 80%, 100%, and 120% of 24-mCAF (500 ng/spot). The percent ratios between the recovered and expected concentrations were calculated.
Robustness studies
The effect of small, deliberate variation of the analytical conditions on the peak areas of the marker was studied. The robustness of the developed chromatographic method was carried out at a concentration of 600 ng/spot for 24-mCAF. The standard deviation of peak areas and % relative standard deviation (%RSD) were calculated for each variable parameter.
Solution stability
Stability of standard solution of gamma oryzanol (600 ng/spot) at room temperature was studied at an interval of 6–48 h. The peak area was compared with freshly prepared standard solution.
Fractionation of rice bran oil
Column chromatography
Activation of silica
Column grade silica (80–120#) was kept in an oven at 110°C for 3 h to remove the moisture. Weighed quantity of activated silica was added to the beaker containing mobile phase (toluene:ethyl acetate:methanol (15.0:1.7:3.3, v/v/v) and stirred with a glass rod to prepare the slurry. Slurry of activated silica (80–120#) was prepared and then the column was packed with slurry and then it was eluted with mobile phase.
Application of sample
Weighed quantity (15 g) of the sample (extracted RBO) was mixed with 1–2 g of activated silica gel and 3–4 mL of mobile phase to prepare slurry. The slurry of sample was added to the top of the packed silica in column. A thin disc (column diameter) of cotton soaked in mobile phase was placed on top of the bed to prevent disturbing of sample layer after addition of mobile phase. Column was filled to the top with the mobile phase and allowed to stand for overnight (~15 h) to develop a chromatogram.
Elution
Elution was carried out by the gravity at the flow rate of 1 mL/min. Mobile phase was added to the top of the column and fractions (20 mL each) were collected in amber colored bottle. The remaining sample of loaded material in the column, which was not eluted with mobile phase, was eluted with ethyl alcohol and collected as ethyl alcohol fraction. Fractions were concentrated by evaporating at room temperature until volume reduced to ¼ of the total volume. TLC of concentrated fractions was carried out to detect similarity between the chromatograms of different fractions.[11]
Thin layer chromatography
The collected fractions were studied by using TLC and on the basis of similarity in the Rf and appearance of color in daylight, ultraviolet (UV) (254 and 366 mn), and after exposure to iodine vapors; the fractions were combined to get pooled fraction (I–VI and ethanolic fraction VII).
High-performance thin layer chromatography
Sample preparation
Pooled fractions I–VI and ethanolic fraction (VII) were evaporated to dryness at room temperature. The solutions (1 mg/mL) of dry fraction were prepared in methanol.
Application of sample
The sample was applied on the prewashed and activated HPTLC plate (10 cm × 10 cm) by the 100 microliter syringe (Hamilton) with the help of sample applicator (Linomat V) in the form of bands. Specifications were as follows (unless specified): application position, 10 mm above the lower edge; start position, 10 mm; bandwidth, 4 mm; space between bands, 4 mm; and quantity applied, 5–10 μl.
Mobile phase
The solvents toluene, ethyl acetate, and methanol were distilled and then used for the preparation of mobile phase. The composition of mobile phase was toluene:ethyl acetate:methanol (15.0:1.7:3.3, v/v/v).
Preconditioning of chamber (saturation)
Development of chromatogram was carried out in a saturated twin trough chambers. To achieve saturation, at least half of the total area of the inside of the wall of the chamber was lined with filter paper. A sufficient quantity (approximately 10 mL) of mobile phase was poured along the side of filter paper into the chamber to saturate the chamber and form a layer about 5 mm deep. Chamber was then closed and allowed to stand for at least 45 min at room temperature.
Development of chromatogram
The plate was marked 10 mm below the upper edge. The plate was placed as nearly vertical as possible into the chamber ensuring that the points of application were above the surface of the mobile phase. Chamber was closed and mobile phase was allowed to ascend the specific distance at the room temperature. The plate was removed; the position of mobile phase front was marked. The mobile phase was allowed to evaporate at room temperature and dried under hot air.
Observation and interpretation of chromatogram
Chromatograms developed from each band (the track) were observed in daylight and then in UV viewing cabinet with dual wavelength (254/366 nm). Plates were scanned in HPTLC plate scanner III controlled by software (version 1.4.4).
Characterization of compound isolated from fraction II
Infrared spectroscopy (IR) spectra was recorded on JASCO Fourier transform infrared spectroscopy (FTIR) 4100 Spectrophotometer, Hachioji, Tokyo, Japan using potassium bromide (anhydrous IR grade) as standard. 1H-NMR and 13C-NMR spectra were obtained from SAIF/CIL, Panjab University, Chandigarh, Punjab, India, on unit BRUKER AVANCE II 400 spectrophotometer, Fällanden, Switzerland NMR at 400 MHz using tetramethylsilane as an internal standard in CDCl3. The HSQC, HMBC, distortionless enhancement by polarization transfer, NOESY, and correlation spectroscopy spectrum were obtained on BRUKER spectrometer. The mass spectrum (MS) was acquired on a WATERS, Q-TOF MICROMASS (liquid chromatography-MS), Wilmslow, United Kigdom.
RESULTS AND DISCUSSION
Method validation
Petroleum ether extract of rice bran contains several compounds with similar polarity including CAF and 24-mCAF. The polarity of the molecules is determined by structure of the compound. By selecting different mobile phases, one can change the equilibrium between the free and absorbed states. It is important to understand chromatography at this molecular level because this allows one to choose mobile phases that will separate just about any mixture of molecules. Different molecules partition differently between the free and absorbed state that is the equilibria between these two states is not the same.[12]
Silica is the most popular stationary phase in the column and TLC. For this common phase, the partitioning works in an analogous manner. The more polar components will be retained on the stationary phase longer. Thus, the least polar compound will elute from the column first, followed by each compound in order of increasing polarity. As the direction of the solvent flow in TLC moves up and in column chromatography the solvent flows down, it appears that the order is “upside-down.” In TLC, the more polar molecules will have lower Rf values but in column chromatography, they will be retained longer on the column. Remember this when considering the polarities of the stationary phase as well as the polarity of the compounds being separated when predicting the order of elution. Stationary phase for column chromatography can come in a variety of sizes, activities, and acidic and basic variations for silica. The types of stationary phase chosen are determined experimentally or often based on results from a previous TLC experiment. The type of adsorbent, the size of the column, the polarity of the mobile phase as well as the rate of elution all affect the separation of chemical constituents present in extract. These conditions can be manipulated very well to get the best separation for interested mixture.
Solvent systems for use as mobile phases in column chromatography could be determined from previous TLC experiments. A separation will begin by using nonpolar or low polarity solvent, allowing the compounds to adsorb to the stationary phase, then slowly switching the polarity of the solvent to desorb the compounds and allow them to travel with the mobile phase. The polarity of the solvents should be changed gradually. Some typical solvent combinations are ligroin-dichloromethane, hexane-ethyl acetate, and hexane-toluene. Often an experimentally determined ratio of these solvents can sufficiently separate most compounds. Solvents such as methanol and water are normally not used because they can destroy the integrity of the stationary phase by dissolving some of the silica gel.[13]
During the optimization of the proposed HPTLC method, different mobile phases containing single solvent and different solvents containing various ratios of toluene, ethyl acetate, ethanol, methanol, dichloromethane, acetone, n-hexane, and chloroform were attempted. The mobile phase composed of toluene:ethyl acetate:methanol (15.0:1.7:3.3, v/v/v) was selected because well-resolved peaks were observed. The optimum wavelength chosen for detection and quantitation was 317 nm. The retention factors for tinidazole, 24-mCAF, and CAF were found to be 0.27 ± 0.02, 0.72 ± 0.02, and 0.79 ± 0.02, respectively.
High-performance thin layer chromatography method validation
Linearity, limit of detection, and limit of quantitation
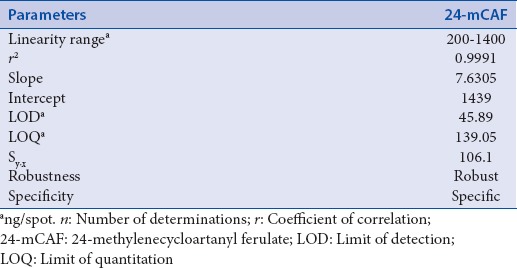
The results were found to be linear in the range of 200–1400 ng/spot, whereas the correlation coefficient (r) for the plots was 0.999 for 24-mCAF. The peak area (y) was proportional to the concentration of 24-mCAF following the regression equation y = 7.630x + 1439. The LOD and LOQ for 24-mCAF were found to be 45.89 and 139.05 ng/spot, respectively [Table 1]. Linearity was also confirmed by residual analysis and no tendency was observed in it. The peak area (y) was proportional to the concentration of tinidazole (as internal standard) following the regression equation y = 6.874x + 3061.
Table 1.
Linear regression data for the calibration curves (n=7)
Precision studies
Intra-day variation, as %RSD, was in the range of 0.19–0.36, whereas inter-day variation, as %RSD, was found to be in the range of 0.16–0.50 for 24-mCAF. Precision studies for 24-mCAF showed RSD <2%, indicating a good precision [Table 2].
Table 2.
Intra- and inter-day precision, recovery, and robustness of the high-performance thin layer chromatography method for 24-methylenecycloartanyl ferulate (n=6)

Specificity
Assessment of peak purity of 24-mCAF was performed by comparing the spectra of marker compound at peak start, peak apex, and peak end positions of the spot. The values were (start, middle) = 0.998, 0.999 and r (middle, end) =0.999, 0.999, respectively. Good correlation was also obtained between markers and sample spectra of 24-mCAF.
Accuracy studies
Results of the accuracy illustrated recoveries of 99.20–100.84% for 24-mCAF indicated the reliability of the proposed densitometric method for quantitation of 24-mCAF in RBO [Table 2].
Robustness studies
Robustness of the proposed method assessed after deliberate alterations of the analytical parameters indicated that areas of peaks of interest and retention factor remained unaffected by small changes in the operational parameters (%RSD <2). The summary of validation parameters of developed method is presented in Table 2.
Analysis of rice bran oil
Proposed validated method was applied to standardization for RBO extracts, viz. methanol and ethanol. The shape of the peaks was not altered by other substances present in the both extracts. The percent contents of 24-mCAF in both fractions were 0.38% and 1.02%, respectively.
Fractionation of rice bran oil
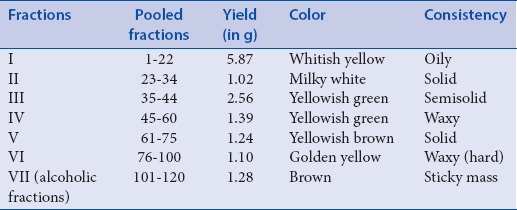
Column chromatographic separation of the petroleum extract of RBO gave seven fractions of 20 mL each. TLC of each fraction was carried out during column chromatography to get pooled fraction I (1–22), II (23–34), III (35–44), IV (45–60), V (61–75), VI (76–100), and VII (101–120). Fraction I-VI were obtained by eluting column with mobile phase (toluene:ethyl acetate:Methanol in the proportion of 15.0:1.7:3.3, v/v/v), whereas fraction VII was the mass which could not be eluted with mobile phase, and thus it was eluted by ethanol. Organoleptic characteristics of pooled fraction were studied and reported in Table 3. The HPTLC fingerprinting of pooled fraction was carried out at 254 and 366 nm and reported. To get pure compound, two-dimensional (2D) chromatography was done by using HPTLC. The fraction II Rf value was matched with the standard compound, so the fraction II was selected for further study.
Table 3.
Summary of fractions of petroleum ether extract of rice bran
Development of chromatogram
1D (normal): Described earlier. (Note: Sample was applied as spot instead of band). 2D: After the development of 1D chromatogram same plate was placed in a chamber saturated with fresh mobile phase. The plate was placed in such a way that (90° counterclockwise) the spots on developed chromatogram by 1D acted as application points. Chamber was closed and mobile phase was allowed to ascend. The plate was removed and mobile phase was allowed to evaporate at room temperature and dried under hot air.
Preparative thin layer chromatography
Application of sample
Sample was applied by streaking across the full length of the plate by automatic sample applicator Linomat V (CAMAG Switzerland).
Development of chromatogram
As described earlier.
Observation and elution of compound
Chromatogram was observed in daylight, under UV light at 254 and 366 nm wavelength. Area was marked and scraped off with a sharp blade, about 10% additional area was then marked to compensate for three-dimensional development of band in the layer. With minimum volume of mobile phase, the components from scrapped material were eluted. Scrapped material and mobile phase were homogenized in vortex mixer to ensure complete elution, centrifuged, supernatant collected, and allowed to evaporate. The volume of mobile phase required for elution was calculated. Volume of solvent required = volume of scrapped material × 10 × (1 – Rf).
Structural characterization
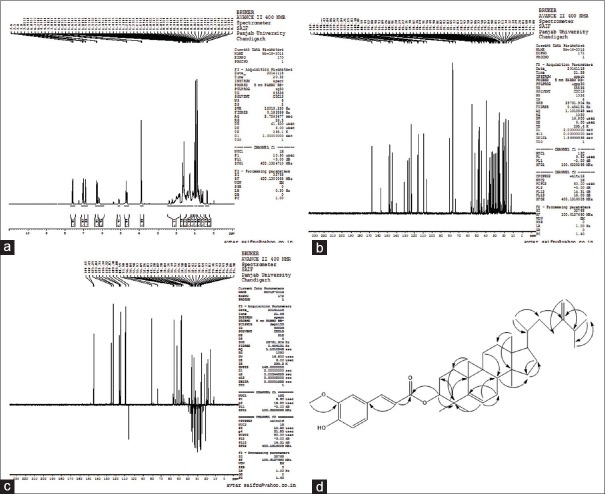
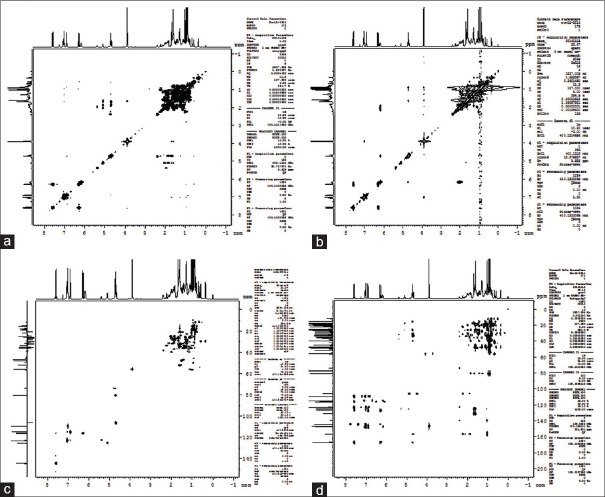
Compound: 24-mCAF, solid, white powder; FTIR (KBr/cm): OH (3539), Ar. CH (2967), COOR (1714), C = C (1630), CH3 (1375), C-O-C (1211); 1H-NMR (400 MHz, CDCl3) δ ppm: d 7.59 (1H, d, J = 16.0 Hz, H-3’), 7.05 (1H, dd, J = 1.58 Hz, H-5’), 7.02 (1H, s, J = 1.5, 8.0 Hz, H-9’), 6.90 (1H, d, J = 8.0 Hz, H-8’), 6.28 (1H, d, J = 16.0 Hz, H-2’), 6.18 (1H, br s, 7’-OH), 4.72 (1H, s, H-28a), 4.69 (1H, m, H-3), 4.67 (1H, s, H-28b), 3.90 (3H, s,-OCH3), 2.21 (1H, m, H-25), 1.03 (3H, d, J = 6.0 Hz, H-27), 1.04 (3H, d, J = 6.0 Hz, H-26), 0.97 (6H, s, H-18, 30), 0.93 (3H, s, H-31), 0.90 (6H, s, H-21, 29), 0.59 (1H, d, J = 4.0 Hz, H-19b), 0.36 (1H, d, J = 4.0 Hz, H-19a) [Figure 1]; 13C-NMR (100 MHz, CDCl3) δ ppm: 167.21, 156.81, 147.96, 146.87, 144.47, 130.84, 127.06, 127.02, 125.29, 123.04, 116.15, 114.83, 109.38, 106.01, 80.59, 55.93, 52.26, 48.81, 47.91, 47.20, 45.27, 39.70, 36.14, 35.49, 34.98, 33.81, 32.87, 31.93, 31.87, 29.83, 28.17, 26.97, 26.50, 25.97, 25.86, 25.50, 21.90, 21.05, 20.97, 20.13, 19.34, 18.29, 17.68, 15.38 [Figure 1]; and ESIMS (negative) m/z 615.6 [M-H]− [Figure 2].
Figure 1.
1H-nuclear magnetic resonance of isolated 24-methylenecycloartanyl ferulate (a), 13C-nuclear magnetic resonance of isolated 24-methylenecycloartanyl ferulate (b), distortionless enhancement by polarization transfer spectrum of isolated 24-methylenecycloartanyl ferulate (c) and heteronuclear multiple bond correlation of the isolated compound (i.e. heteronuclear multiple bond correlation [H–C]) (d)
Figure 2.
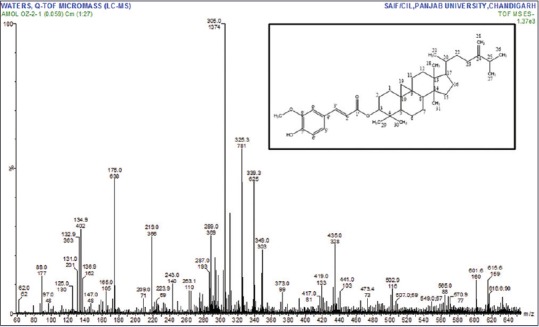
Mass spectrum of 24-methylenecycloartanyl ferulate and structure of 24-methylcycloartenol ferulate (inset)
The 1H-NMR (CDCl3, 400 MHz) spectrum of compound matched with that of 24-methylenecycloartanyl ferulate (24-mCAF) reported in a previous study.[14,15,16] In accordance with the 1H-NMR spectrum, the 13C-NMR (CDCl3, 100 MHz) spectrum contained 41 carbon signals including ten carbon signals of the ferulic acid moiety and 31 carbon signals of the 24-methylenecycloartanol moiety. When the 13C-NMR spectrum of compound was compared with standard (d 130.86 (C-25) and 125.24 (C-24)), the carbon signals (d 156.85 (C-24) and 105.92 (C-28)) characteristic of the double bond in the 24-methylenecycloartanol moiety were largely shifted down-field and up-field, respectively. The molecular ion peak of the compound was also observed at 616.6 [Me-H]-spectrum, indicating that the molecular weight of compound was 616.6 [Figures 1 and 3]. Thus, based on the MS and NMR spectroscopic data, the compound was determined to be 24-mCAF. The results are comparable with findings of the previous investigator.[15]
Figure 3.
Correlation spectroscopy spectrum of 24-methylenecycloartanyl ferulate (a), heteronuclear single quantum coherence spectrum of isolated 24-methylenecycloartanyl ferulate (b), heteronuclear multiple bond correlation spectrum of 24-methylenecycloartanyl ferulate (c), and nuclear overhauser effect spectroscopy spectrum of 24-methylenecycloartanyl ferulate (d)
CONCLUSION
The characterization data of 1D, 2D spectral analysis confirm that the isolated compound 1 is 24-mCAF. In this work, high-purity 24-mCAF was successfully isolated from crude RBO using HPTLC with a solvent system composed toluene:ethyl acetate:methanol (15.0:1.7:3.3, v/v/v). This is the first report on the preparative separation of 24-mCAF directly from crude RBO of Indian variety rice. The advantages of the method are simple, precise, and time saving.
Financial support and sponsorship
Nil.
Conflicts of interest
There are no conflicts of interest.
ABOUT AUTHOR

Dr. Subhash Laxamrao Bodhankar
Dr. Subhash Laxamrao Bodhankar, graduated in Pharmacy from Nagpur University and completed post graduation in 1973 from Postgraduate Institute of Medical Education and Research (P.G.I.M.E.R.) Chandigarh. He has completed his Ph. D. from Ahmadu Bello University Zaria, Nigeria (West Africa) in 1986. Currently he is working with B. V. D. U. Poona College of Pharmacy, Pune as Professor and Head department of Pharmacology. 25 students have completed Ph.D. and 7 students are registered under him. He has guided 156 M. Pharm students. He has completed more than 80 industrial projects on safety and efficacy of drugs. He has 4 ongoing projects sanctioned by AICTE, DST, UGC and NAIR-ICAR. Dr. Bodhankar is an active research worker and published about 284 papers in national and international journals in addition to 130 presentations in conferences. He received many awards for research papers and thesis; few of them are Ram Lal Shad (STOX), Indian Drug Manufacturer Association, Chimote and Gharpure award from Maharashtra Society of Pharmacology. Best guide in Ayurveda (three times) and “Vishesh Sewa Puraskar” from Bharati Vidyapeeth University. Recently, he received prestigious “Dr. N. S. Dhalla Oration Award” for “LIFE TIME” contribution in cardiovascular sciences at the 42nd Annual Conference of “Indian Pharmacological Society” held at Kolkotta. Dr. A. S. Paranjpe oration award at ORACON 2010 at held at Sen Kinare auditorium of Seth G.S. Medical College and K.E.M. Hospital. Parel, Mumbai. Nov. 2010. He delivered invited lecture at 1st AMPTOX conference held at KPC medical college, Kolkata, on 11-12 December 2010.
Acknowledgments
The authors are thankful to the University Grants Commission, New Delhi, India, for financial assistance for the research under the scheme of Major Research Project. The authors also acknowledge Dr. S. S. Kadam, Vice Chancellor, Bharati Vidyapeeth Deemed University and Dr. K. R. Mahadik, Principal, Poona College of Pharmacy for keen interest and providing the necessary facilities to carry out this study. The authors wish to thank S. R. Rojatkar, Amit D. Kandhare, and Pravin Pawar for carrying out this research work. The authors also wish to thank Sophisticated Analytical Instrumentation Facility (Sponsored by Department of Science and Technology) Panjab University Chandigarh for providing spectral data.
REFERENCES
- 1.Burlando B, Cornara L. Therapeutic properties of rice constituents and derivatives (Oryza sativa L.): A review update. Trends Food Sci Technol. 2014;40:82–98. [Google Scholar]
- 2.Walter M, Marchesan E. Phenolic compounds and antioxidant activity of rice. Braz Arch Biol Technol. 2011;54:371–7. [Google Scholar]
- 3.Zhang M, Guo B, Chi J, Wei Z, Xu Z, Zhang Y, et al. Antioxidations and their correlations with total flavonid and anthocyanin contents in different black rice varieties. Sci Agric Sin. 2005;38:1324–31. [Google Scholar]
- 4.Kandhare AD, Raygude KS, Ghosh P, Ghule AE, Bodhankar SL. Therapeutic role of curcumin in prevention of biochemical and behavioral aberration induced by alcoholic neuropathy in laboratory animals. Neurosci Lett. 2012;511:18–22. doi: 10.1016/j.neulet.2012.01.019. [DOI] [PubMed] [Google Scholar]
- 5.Chung I, Park H, Chun S, Kim J, Ahmad A. New glycosidic and other constituents from hulls of Oryza sativa. Chem Nat Compd. 2007;43:417–21. [Google Scholar]
- 6.Denev R, Kuzmanova I, Panayotova S, Momchilova S, Kancheva V, Lokesh BR. Lipid composition of Indian rice bran oil. C R Acad Bulg Sci. 2009;62:709–16. [Google Scholar]
- 7.Rukmini C, Raghuram TC. Nutritional and biochemical aspects of the hypolipidemic action of rice bran oil: A review. J Am Coll Nutr. 1991;10:593–601. doi: 10.1080/07315724.1991.10718181. [DOI] [PubMed] [Google Scholar]
- 8.Zullaikah S, Melwita E, Ju YH. Isolation of oryzanol from crude rice bran oil. Bioresour Technol. 2009;100:299–302. doi: 10.1016/j.biortech.2008.06.008. [DOI] [PubMed] [Google Scholar]
- 9.Lai SM, Hsieh HL, Chang CW. Preparative separation of γoryzanol from rice bran oil by silica gel column chromatography. J Liq Chromatogr Relat Technol. 2005;28:145–60. [Google Scholar]
- 10.ICH Guideline. Validation of analytical procedures: text and methodology. Q2 (R1) 2005:1–13. [Google Scholar]
- 11.Chatwal GR, Anand SK. Mumbai: Himalaya Pub; 1979. Instrumental Methods of Chemical Analysis. [Google Scholar]
- 12.Costanzo SJ. Optimization of mobile phase conditions for TLC methods used in pharmaceutical analyses. J Chromatogr Sci. 1997;35:156–60. [Google Scholar]
- 13.Variyar PS, Chatterjee S, Sharma A. Berlin: Springer; 2011. Fundamentals and Theory of HPTLC-Based Separation, in High-Performance Thin-Layer Chromatography (HPTLC) pp. 27–39. [Google Scholar]
- 14.Bao Y, Yanase E, Nakatsuka S. Isolation of campesteryl ferulate and epi-campesteryl ferulate, two components of gamma-oryzanol from rice bran. Biosci Biotechnol Biochem. 2013;77:877–9. doi: 10.1271/bbb.120938. [DOI] [PubMed] [Google Scholar]
- 15.Liu M, Yang F, Shi H, Akoh CC, Yu LL. Preparative separation of triterpene alcohol ferulates from rice bran oil using a high performance counter-current chromatography. Food Chem. 2013;139:919–24. doi: 10.1016/j.foodchem.2013.01.106. [DOI] [PubMed] [Google Scholar]
- 16.Xu Z, Godber JS. Purification and identification of components of gamma-oryzanol in rice bran oil. J Agric Food Chem. 1999;47:2724–8. doi: 10.1021/jf981175j. [DOI] [PubMed] [Google Scholar]


