Abstract
High-throughput DNA sequencing technology has revolutionized the study of gene expression while introducing significant computational challenges for biologists. These computational challenges include access to sufficient computer hardware and functional data processing workflows. Both these challenges are addressed with our scalable, open-source Pegasus workflow for processing high-throughput DNA sequence datasets into a gene expression matrix (GEM) using computational resources available to U.S.-based researchers on the Open Science Grid (OSG). We describe the usage of the workflow (OSG-GEM), discuss workflow design, inspect performance data, and assess accuracy in mapping paired-end sequencing reads to a reference genome. A target OSG-GEM user is proficient with the Linux command line and possesses basic bioinformatics experience. The user may run this workflow directly on the OSG or adapt it to novel computing environments.
Keywords: DNA sequence analysis, RNAseq, Open Science Grid, Pegasus, distributed computing
Introduction
A molecular detection revolution is underway in the field of biology. High-throughput sequencing (HTS) of DNA1 is steadily becoming a cost-effective way to achieve diverse tasks, including comparing DNA sequences of individuals for genetic analysis (genotyping by sequencing2), sequencing and counting RNA molecules after conversion to DNA to measure steady-state RNA expression through the construction of a gene expression matrix (GEM) (RNAseq3,4), identifying organisms in environmental samples (metagenomics5,6), and many other applications.
In the case of RNAseq, biologists can now determine the dynamics of gene expression by counting millions of RNA molecules using HTS technology. RNA is extracted and converted to DNA, resulting in a set of DNA molecules that are sequenced and quantified. This avoids issues of cross-hybridization on molecular probe technologies such as microarray, and uncharacterized RNA transcripts can be detected.7 In essence, biologists can now “observe” molecular information flow from genomes that will have as much impact in understanding biological systems as the microscopy revolution of the 17th century.
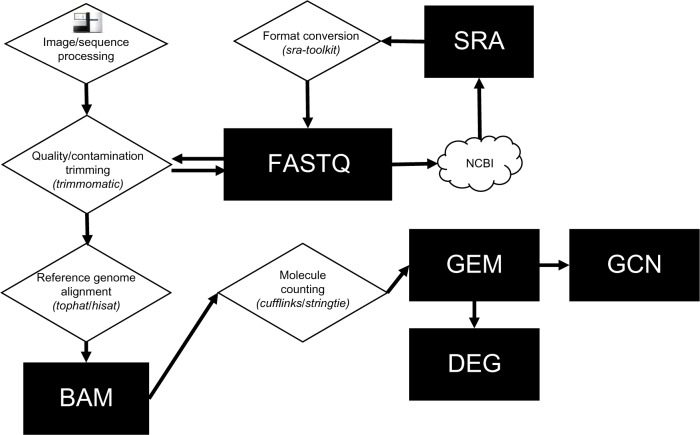
There are several HTS platforms, including those from Illumina,8 Ion Torrent,9,10 and Pacific Biosciences,11 each with their own nuances. For example, Illumina creates a large quantity (often in the millions) of short DNA sequences of various lengths (36–300 base pairs) that are encoded in chromosomal intervals (ie, genes) with specific sequences that are unique to the species and individual. It would be ideal to capture the sequence of the entire DNA molecule without errors, but high-quality sequences are often obtained from one end of the molecule (single-end reads) or as pairs from both ends of the molecule (paired-end reads). Thus, a key aspect of HTS DNA analysis involves aligning a large number of short DNA sequences to a smaller number of large-reference genome DNA sequences. The HTS DNA data lifecycle and the typical computational workflow are shown in Figure 1.
Figure 1.
DNA sequence file lifecycle. A DNA sequence starts its life as a TIFF image stack from a DNA-sequencing instrument. Raw images are converted to a FASTQ text file and preprocessed or deposited into repositories such as the National Center for Biotechnology Information (NCBI) as Short Read Archive (SRA) files. Cleaned FASTQ files are mapped to a reference genome and converted to a BAM alignment file. BAM files can be mined for gene expression vectors that can be bundled into a gene expression matrix (GEM). GEMs are a stable data structure that can be mined for differentially expressed genes (DEGs) or used to construct Gene Co-expression Networks (GCNs) and processed by other workflows.
HTS DNA data files can be quite large and require complex computational workflows that extract a quantitative biological measurement. After sequencing is complete, an HTS DNA dataset is a concatenation of DNA sequence strings and metadata that include base pair call accuracy encoding (quality scores) as well as sample and instrument information. The datasets are stored in standard formats including FASTQ12 and SRA.13 Of note, SRA files can be manipulated and converted into FASTQ with the NCBI sra-toolkit.14 Raw DNA reads often contain sequence contamination and poor quality reads and must be cleaned before downstream processing. A Java application called Trimmomatic15 performs this preprocessing task.
Once cleaned, reads are mapped to a reference genome16 or transcriptome sequence set.17 Several short-read genome aligners may be used for this, including bowtie2,18 bwa,19–21 SOAP,22 and others, all of which create an alignment file, often in the SAM/BAM format.23 The SAM/BAM file can be processed to extract sequence variants to the reference genome as well as count molecules that were sequenced at specific positions in the reference sequence. In the case of the RNAseq workflow, a GEM can be constructed where each row is a known gene transcript and a column is a vector of gene expression intensities (ie, RNA molecule count output detected for all genes in the sample). Molecule count information can be determined by the “tuxedo” suite of software that include Tophat,24 Cufflinks,25 HISAT,26 and StringTie.27 It should be noted that there is a plethora of software platforms that process HTS reads, including GATK,28 Galaxy,29 and R/Bioconductor30 to name but a few.
Processing HTS DNA datasets requires significant hardware resources. While it is possible to process these datasets on lab workstations, high-performance computing, high-throughput computing, and even big data systems may be required as the end user scales up the number of samples, while datasets get richer and larger. One system that is highly scalable for HTS DNA workflow execution is the Open Science Grid (OSG31), a U.S.-based consortium of over 100 universities and national laboratories set up to share distributed high-throughput computing resources. The OSG provides free access to these resources for U.S.-based researchers and supports projects of varied scale. For example, a major stakeholder community of the OSG includes Large Hadron Collider physicists. As the OSG has matured, the benefits of the infrastructure have become apparent to experiments in other fields of science, including genomics, as well as universities to serve their local users’ computational needs.
When the OSG resource contributors do not need their full capacity – for example, when an instrument is down for maintenance and no new data are produced – the unused cycles on the compute resource can be shared back to the OSG community. These opportunistic cycles add up to over 100 million core hours annually, and these cycles are used for our OSG-GEM workflow. To access the OSG, our project utilized OSG Connect, which provides a simple but feature-rich interface to the OSG. Services used in this work include submit hosts, used to submit and manage jobs, and Stash, which is a multi-petabyte file-storage service. Stash is a centralized storage system that provides a number of access methods such as web portal, Globus,32 standard file-transfer mechanisms, and sharing tools such as distributed data caching close to the compute resources.
The OSG supports high throughput computing (HTC) via HTCondor.33 HTCondor is a high-throughput batch system for managing jobs on distributed resources. In a typical HTC workflow, several tasks are concurrently executed on independent machines that are connected through a network. Many scientific computations, including molecular screening, parameter sweeps, and statistical sampling, are suitable for HTC. HTC systems have the potential to accelerate GEM construction, as large quantities of short sequences from HTS are processed. The GEM workflow developed for the OSG may be modified to enable transfer of any HTC systems, including a local campus cluster, grid, or cloud.
The Pegasus Workflow Management System enables the execution of large-scale computational workflows on a variety of infrastructures.34 Pegasus workflows are described as abstract directed acyclic graphs (DAG), which describe the tasks and data dependencies but not the execution environment specifics. The reason for this abstract representation is that it provides portability for the workflow. The same workflow can be modified suitably as an executable workflow for use in different resources at different times. This modifying step of changing an abstract DAG to an executable workflow is where Pegasus adds nodes to the graph, such as data management nodes, and applies transformations to the graph, such as task clustering and workflow reduction based on already existing data products.
The OSG Gene Expression Matrix (OSG-GEM) workflow described in this article is a distributed computing mechanism to generate GEMs using the tuxedo suite of software. We provide details on how the Pegasus-based workflow is organized as well as information on the usage and evaluation of OSG-GEM. While the workflow is currently designed to process paired-end Illumina-sequencing datasets for RNA transcript quantification, OSG-GEM is adaptable to alternative methods of processing of HTS DNA datasets, as well as tuning or replacing the described software applications. OSG-GEM is available under the GNU GPL License v2 at https://github.com/feltus/OSG-GEM.
Workflow Usage
OSG-GEM workflow overview
The OSG-GEM workflow is capable of processing hundreds to thousands of paired-end Illumina HTS DNA datasets in the FASTQ format on the OSG. Output is a two-column matrix of gene identifiers and normalized RNA expression intensities. Multiple workflows can be launched in parallel and the resulting matrices can be stitched together to create larger GEMs for an organism, suitable for downstream analysis including gene co-expression matrix construction35,36 (GCN in Fig. 1) and differential gene expression profiling37 (DEG in Fig. 1). In order to execute the workflow, the user will need an account on the OSG,38 HTS DNA datasets in the FASTQ format, and a reference genome or transcript assembly with associated gene annotations in the GTF/GFF3 format. These files are placed either in a specific OSG-GEM directory or via paths defined in the osg-gem.config file. The OSG-GEM workflow can be obtained from github,39 which contains the most up-to-date documentation on this workflow. A test dataset is cloned with the workflow, which utilizes human chromosome 21 from the GRCh38 build of the human-reference genome40 along with a small dataset containing 200,000 human sequences (from SRR182596241). The user can submit this reduced test dataset to become familiar with workflow setup and execution.
Pre-workflow steps
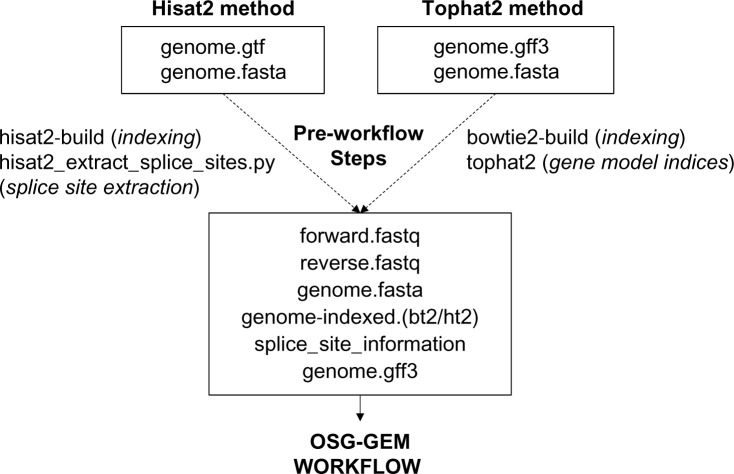
As shown in Figure 2, the first end-user decision to be made is with regard to whether the Hisat2 or the Tophat2 method will be used. We recommend Hisat2, since the developers are no longer supporting further development of Tophat2 (according to their website). We also recommend that the user becomes familiar with the application documentation for each method. If the Hisat2 method is chosen, the user must obtain the reference genome sequence file in the FASTA format42 and gene-location annotations in the GTF format.43 If the Tophat2 method is selected, the user must accumulate the reference genome sequence file in the FASTA format and gene-location annotations in the GFF format.43 Reference genome indices must be constructed using hisat2-build44 or bowtie2-build.45 In order to guide the accurate mapping of sequencing reads independently from one another, annotated splice site information must be provided. For Hisat2, the built-in hisat2_extract_splice_sites.py script generates a tab-delimited list of splice junctions that allow the user to disable discovery of novel splice junctions.26 Tophat2 can map reads directly to a reference transcriptome by generating index files of all sequences that are present in the reference genome annotation.24 A reference genome annotation file in the GFF3 format is provided to guide RNA molecule counting using either StringTie27 or Cufflinks.25
Figure 2.
Preparation of input files for the gene expression matrix construction workflow on the Open Science Grid (OSG-GEM). Required input files for either the Hisat2 or the Tophat2 method are shown in boxes. The user provides paired-end DNA sequences in the FASTQ format (forward/reverse), which can be extracted from SRA format files with the NCBI SRA toolkit. The reference genome (genome) in the FASTA format must be indexed using either the Hisat2 or the Bowtie2 application. Built into the Hisat2 software package, the hisat2_extract_splice_sites.py script can generate a tab-delimited list of splice sites using a reference annotation file in the GTF format. Tophat2 can generate a set of gene model indices from GFF3 or GTF format files that contain splice site information in the form of a reference transcriptome. FASTQ file locations are defined in the osg-gem.config file and all other files are placed in the reference directory of the OSG-GEM workflow.
OSG-GEM workflow setup
To set up an OSG-GEM workflow, the user must modify the osg-gem.config file to select software options and point to input data for recognition by Pegasus. First, the user must identify a reference prefix ($REF_PREFIX) that will be used to name all reference genome files used by the workflow. Next, the user must provide the file path to a forward FASTQ file and to a reverse FASTQ file. FASTQ filenames must end with .forward_1.fastq.gz or .forward_1.fastq to signify forward-sequencing reads, and .reverse_2.fastq.gz or .reverse_2.fastq to signify reverse-sequencing reads. Finally, the user must select “True” or “False” for each software option. Once the osg-gem.config file is appropriately modified, the user must place the necessary reference genome files in the reference directory of the workflow with filenames containing the $REF_PREFIX that was specified in the osg-gem.config file.
If the user selects Hisat2 as “True,” the following files must be present in the reference directory:
$REF_PREFIX.fa,
$REF_PREFIX.1.ht2 … $REF_PREFIX.N.ht2,
$REF_PREFIX.Splice_Sites.txt,
$REF_PREFIX.gff3
If the user selects Tophat2 as “True,” the following files must be present in the reference directory:
$REF_PREFIX.fa,
$REF_PREFIX.1.bt2 … $REF_PREFIX.N.bt2,
$REF_PREFIX.rev.1.bt2
$REF_PREFIX.rev.2.bt2,
$REF_PREFIX.transcriptome_data.tar.gz,
$REF_PREFIX.gff3
For example, a user cloned OSG-GEM into “/stash2/user/username/GEM_test”, and placed input FASTQ files for dataset “TEST” in ‘/stash2/user/username/Data’. To process this dataset using Hisat2 and StringTie with the GRCh38 build of the human-reference genome, the osg-gem.config file would be modified as follows:
[reference]
reference_prefix = GRCh38
[inputs]
forward=/stash2/user/username/Data/TEST_1.fastq.gz
reverse=/stash2/user/username/Data/TEST_2.fastq.gz
[config]
tophat2 = False
hisat2 = True
cufflinks = False
stringtie = True
OSG-GEM workflow execution
Once the user submits the workflow by running the submit script, a list of all reference files recognized by Pegasus will be displayed on the screen, including the commands that can be used to monitor the workflow. If no reference files were found or multiple software options for alignment or quantification were selected, Pegasus will produce an error message.
The Pegasus workflow manager directs the execution of tasks in the workflow. In order to parallelize the execution of read trimming and mapping while keeping hardware requirements low, the workflow splits input FASTQ files into files of 20,000 sequences on the OSG stash filesystem. To minimize filesystem I/O, input is read from the disk and written only once by piping compressed input to gunzip and by piping the results to a python script that splits the files. To keep the number of files within each file-system directory manageable, the hierarchical structure of the workflow is established at this step. Each sub-workflow manages the processing of 1,000 forward and 1,000 reverse FASTQ files.
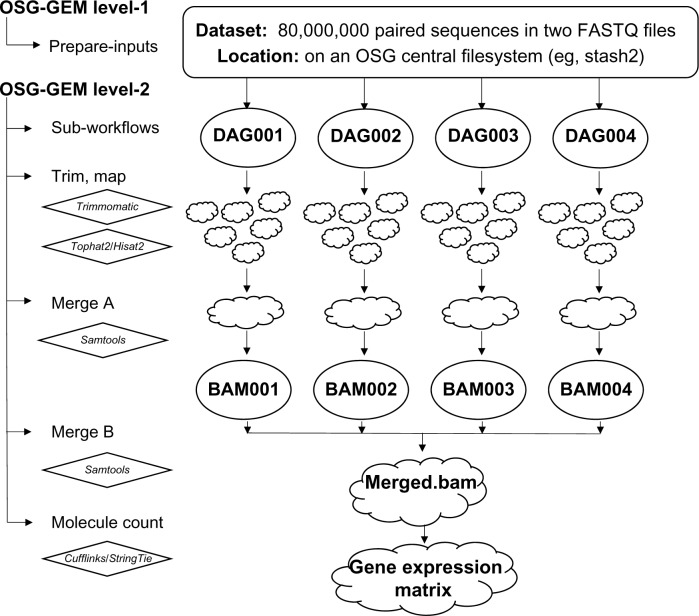
An example input dataset contains 80 million sequences split into 1,000 chunks (20,000 sequences each) that will be managed by four DAG sub-workflows (Fig. 3). For each subworkflow, Pegasus creates a set of job-submission scripts whose execution is managed by DAGMan and implemented by the HTCondor job submission system. A job consists of trimming (Trimmomatic) and mapping (Hisat2 or Tophat2) sequences to the reference genome. A Pegasus job cluster size of five results in five tasks being performed by each job. After a job is completed, BAM-format alignment results are transferred to a temporary OSG filesystem and then submitted to an OSG compute node for an initial merge. Upon completion of all DAG subworkflows, a BAM file from each DAG sub-workflow is transferred to an OSG compute node to generate the final merged.bam file. The final BAM file is then used to generate molecule counts, which are represented as a column in a GEM.
Figure 3.
OSG-GEM Pegasus workflow diagram for a representative HTS DNA sequence dataset. The workflow is managed by Pegasus and divided into two phases called levels 1 and 2. In level 1, input FASTQ files are split into an appropriate size for OSG compute nodes. In level 2, a specific quantity of split sequence files are managed by a finite number of DAGMan sub-workflows based on input file size. DAGMan manages the submission of jobs in the workflow, which results in the trimming of FASTQ files, mapping to a reference sequence, merging alignment files, and quantifying RNA expression levels. Upon completion of all DAG subworkflows, a final merged.bam file is created. The final BAM file is used to count molecules for parsing into a gene expression matrix (GEM).
Pegasus provides a set of commands that can be used to monitor the progression of the workflow. In the event of a failed job, DAGMan will relaunch the job two more times. Upon the third failure, the workflow will end without producing an output matrix. The pegasus-analyzer command can be called within the workflow directory to inform the user of information relating to any failed jobs. The workflow output directory will contain standard output files resulting from Trimmomatic and Hisat2/Tophat2. Information about the read trimming and mapping rates can be extracted from these files to indicate quality of the data.
OSG-GEM workflow customization
OSG-GEM can be easily modified to support specific research needs. Command-line parameters that are passed to each software can be customized by modifying the job wrapper scripts in the tools directory of the workflow. It is important to note that discovery of novel splice junctions is disabled in both the hisat2 and tophat job wrappers, since reads are not mapped independently of one another with default parameters. Memory and disk space on compute nodes requested by the workflow can also be changed by modifying the submit script in the base of the OSG-GEM workflow. Further guidance on customizing software and hardware options in the workflow is provided in the README.md file at https://github.com/feltus/OSG-GEM.
Workflow Evaluation
Workflow speed
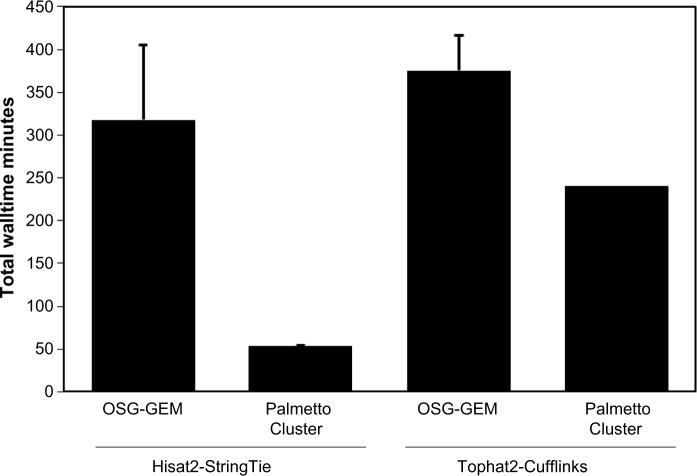
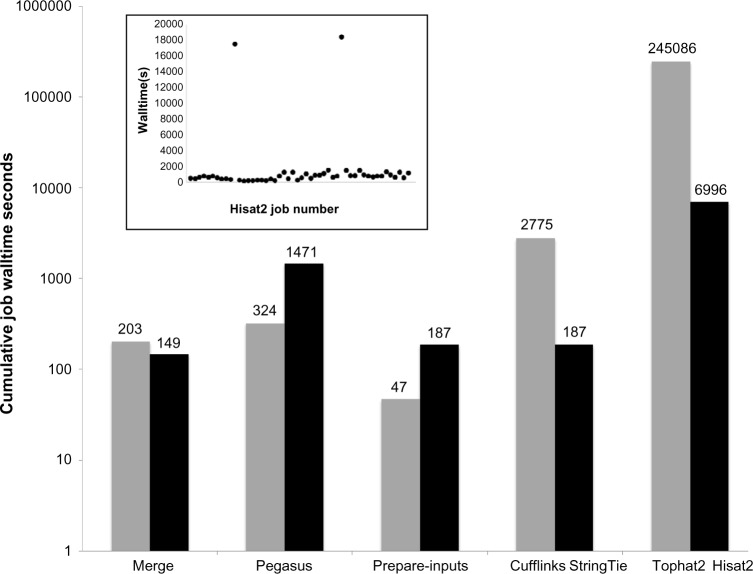
The total OSG-GEM workflow run-time was compared with the total runtime of an equivalent workflow processed on the Clemson University Palmetto Cluster (Fig. 4). The first 5,000,000 sequences of dataset NCBI SRR1825962 were mapped against the GRCh38 build of the human-reference genome. The corresponding comprehensive gene model annotation was downloaded40 (Gencode Release 24) as GTF and GFF3 files. This dataset was processed using either a combination of Tophat2-Cufflinks or Hisat2-StringTie. The OSG-GEM workflows were submitted with requests of 6 GB of RAM and 30 GB of disk storage per job. An IBM DX340 machine with an allocation of 14 GB of RAM and 111 GB of available local_scratch node storage was requested for each job on the Palmetto Cluster. For OSG-GEM workflows, files were split into 20,000 sequence pieces as described previously, while the jobs on the Palmetto Cluster processed the dataset as complete FASTQ files. The total OSG-GEM walltime was documented using the pegasus-statistics command, and the job walltime on the Palmetto Cluster was documented using the qstat command. The cumulative job walltime for each OSG-GEM subcomponent in an example workflow is shown in Figure 5.
Figure 4.
Walltime comparison between the OSG and Palmetto Cluster. Total workflow walltime of OSG-GEM workflows was compared with the total walltime of equivalent workflows processed as single jobs on Clemson University’s Palmetto Cluster. A representative dataset containing 5,000,000 paired-end sequencing reads was mapped to the human-reference genome followed by RNA molecule quantification using a combination of Hisat2-StringTie or Tophat2-Cufflinks. Error bars represent the standard error of the mean (n = 3).
Figure 5.
OSG-GEM component performance. A 5,000,000 sequence dataset was processed using the Hisat2-StringTie and Tophat2-Cufflinks methods of OSG-GEM. The cumulative walltime for each step of the workflow is shown for TopHat2-Cufflinks (gray bars) and Hisat2-StringTie (black bars). The inset scatterplot presents the walltime of each Hisat2 job in the Hisat2-StringTie workflow.
Workflow accuracy
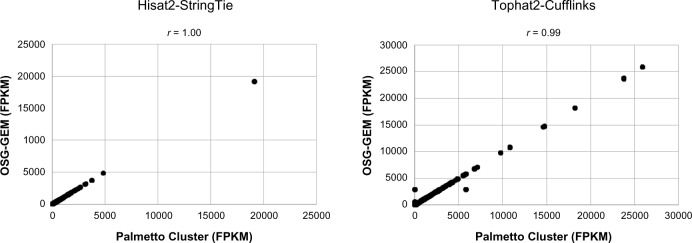
The first 5,000,000 sequences of NCBI dataset SRR1825962 were processed as described above. To confirm the accuracy of the OSG-GEM workflow, gene expression values generated by each workflow were compared with results from the same tasks performed on the Palmetto Cluster without splitting the input file (Fig. 6). A tab-delimited list of splice sites was provided to guide mapping of reads using Hisat2 with novel splice junction discovery disabled. Reads were mapped to the reference transcriptome directly using Tophat2, with novel splice junction and insertion–deletion discovery disabled. The Hisat2-StringTie OSG-GEM workflow produced identical results with the Palmetto Cluster, while the Tophat2-Cufflinks workflow resulted in a high correlation (Pearson’s R = 0.99). These results indicate no loss of accuracy using the OSG-GEM workflow.
Figure 6.
GEM accuracy after preprocessing. Gene expression vectors generated by processing a 5,000,000 sequence dataset using either the Hisat2-StringTie or the Tophat2-Cufflinks method on the Open Science Grid (OSG-GEM workflow) and single jobs on the Palmetto Cluster were compared. FPKM = Fragments Per Kilobase of Exon per Million Mapped Reads. Pearson correlation coefficients were calculated for each comparison.
Discussion
We have described an open-source OSG-GEM workflow to process HTS DNA datasets in the OSG-distributed computing environment. The output of OSG-GEM, the GEM, is a focal data structure for multiple downstream analyses that could also be adapted to the OSG. Given the nature of the OSG, the workflow is highly scalable, adaptable, and available to a broad research community. OSG-GEM is in an active state of development, and we are continually working to synchronize OSG-GEM with new software applications and hardware resources available for OSG job submission.
This workflow serves as a valuable resource in a variety of situations. First, scientists without institutional access to high-performance computing clusters may utilize the OSG to process RNASeq datasets without paying the cost of commercial cloud providers. Second, there is a significant development period to create and tune a complex workflow on the OSG or local computer. OSG-GEM is a solid baseline to use as it is or extend it to other purposes. Third, as input dataset size continues to swell in size and quantity, hardware requirements will become more challenging, especially with competition for resource allocation on campus-computing clusters. The ability to split large input datasets to process in parallel on the OSG will alleviate some of these issues by democratizing the resources available to analyze large datasets.
The goal of OSG-GEM is to construct accurate GEMs as quickly as possible for which there is potential for optimization in the balance between resources requested, queue time, and job failure rate, all of which can potentially increase the performance of this workflow for a given dataset size. Resources can be adjusted by requesting more RAM or more disk space that should result in fewer failed jobs but could result in longer queue times. Job failure can be caused by requesting insufficient resources or by encountering problems on one or more nodes such as exceeding local disk storage or hardware failure. In addition to failed jobs, we have found “run-away” jobs that complete in an exceptionally long time, thereby greatly influencing the final wall time (Fig. 5 inset). If problematic nodes are avoided, OSG-GEM should complete in a fraction of the time shown in Figure 5.
As shown in Figure 4, the total workflow walltime of OSG-GEM workflows was greater than that of equivalent workflows processed on the campus Palmetto Cluster. Basic properties of the OSG make comparison to cluster resources difficult. We used the OSG via the OSG Connect system and thus had opportunistic access to the currently unused computing resources. A small percentage of our opportunistic jobs had to be restarted as resource owners reclaim the resources for their own work. Such restarts might increase the overall walltime of the workflow. In addition, there is a large set of variables for the resource supply and demand equation on the OSG, including the number of available resources with varying system properties, the number of active users and what resources they require, and HTCondor user priorities. All of these variables change over time. However, it is only when doing performance tests that a user has to be concerned about these variables. For data processing, OSG users enjoy an automatic fair-share–based work to resource matching.
Data access is also a factor when comparing the execution on a campus resource versus the OSG. The campus resources usually have a local file system connected with a high-speed, low-latency network. The distributed nature of OSG means that jobs starting up on some remote resource will have to transfer or access data remotely over a wide area network. In the case of the OSG-GEM workflow, Pegasus handles these transfers transparently. Input data to a job are pulled in via parallel HTTP connections to the OSG Connect Stash filesystem, and potential output data are transferred back to Stash over SSH. These transfers do not show up in the runtime of the individual tasks but can add up and affect the overall walltime.
In conclusion, the OSG-GEM workflow is a robust method for processing RNASeq datasets to generate GEMs that serve as input for downstream applications. In the future, we intend to develop linked workflows that build upon the GEM datatype. OSG-GEM is fully functional and under active development as we adapt to evolving OSG infrastructure and tune the workflow to our needs. Therefore, we point the reader to examine the current software version and up-to-date documentation at https://github.com/feltus/OSG-GEM.
Acknowledgments
Clemson University is acknowledged for generous allotment of compute time on the Palmetto Cluster.
Footnotes
SOFTWARE AVAILABILITY: OSG-GEM is available as open-source software under the GNU GPL License v2 and available at https://github.com/feltus/OSG-GEM.
ACADEMIC EDITOR: J. T. Efird, Associate Editor
PEER REVIEW: Four peer reviewers contributed to the peer review report. Reviewers’ reports totaled 1403 words, excluding any confidential comments to the academic editor.
FUNDING: This research was supported by the U.S. National Science Foundation Award #1447771 entitled “PXFS: ParalleX Based Transformative I/O System for Big Data” and by Clemson University Experiment Station Project SC-1700492 “Big Data Analysis Tools for Agricultural Genomics” under TC#6445. This research was done using resources provided by the OSG, which is supported by the National Science Foundation and the U.S. Department of Energy’s Office of Science. The authors confirm that the funder had no influence over the study design, content of the article, or selection of this journal.
COMPETING INTERESTS: Authors disclose no potential conflicts of interest.
Paper subject to independent expert blind peer review. All editorial decisions made by independent academic editor. Upon submission manuscript was subject to anti-plagiarism scanning. Prior to publication all authors have given signed confirmation of agreement to article publication and compliance with all applicable ethical and legal requirements, including the accuracy of author and contributor information, disclosure of competing interests and funding sources, compliance with ethical requirements relating to human and animal study participants, and compliance with any copyright requirements of third parties. This journal is a member of the Committee on Publication Ethics (COPE). Provenance: the authors were invited to submit this paper.
Author Contributions
Conceived and designed the experiments: WLP, MR, CB, DB, FAF. Analyzed the data: WLP, MR, CB, FAF. Wrote the first draft of the manuscript: WLP, MR, CB, DB, FAF. Contributed to the writing of the manuscript: WLP, MR, CB, DB, FAF. Agree with manuscript results and conclusions: WLP, MR, CB, DB, FAF. Jointly developed the structure and arguments for the paper: WLP, MR, FAF. Made critical revisions and approved final version: WLP, MR, CB, DB, FAF. All authors reviewed and approved of the final manuscript.
REFERENCES
- 1.Altman RB, Prabhu S, Sidow A, et al. A research roadmap for next-generation sequencing informatics. Sci Transl Med. 2016;8(335):335 s310. doi: 10.1126/scitranslmed.aaf7314. [DOI] [PMC free article] [PubMed] [Google Scholar]
- 2.Elshire RJ, Glaubitz JC, Sun Q, et al. A robust, simple genotyping-by-sequencing (GBS) approach for high diversity species. PLoS One. 2011;6(5):e19379. doi: 10.1371/journal.pone.0019379. [DOI] [PMC free article] [PubMed] [Google Scholar]
- 3.Dillies MA, Rau A, Aubert J, et al. A comprehensive evaluation of normalization methods for Illumina high-throughput RNA sequencing data analysis. Brief Bioinform. 2013;14(6):671–83. doi: 10.1093/bib/bbs046. [DOI] [PubMed] [Google Scholar]
- 4.Conesa A, Madrigal P, Tarazona S, et al. A survey of best practices for RNA-seq data analysis. Genome Biol. 2016;17(1):13. doi: 10.1186/s13059-016-0881-8. [DOI] [PMC free article] [PubMed] [Google Scholar]
- 5.Warnecke F, Luginbuhl P, Ivanova N, et al. Metagenomic and functional analysis of hindgut microbiota of a wood-feeding higher termite. Nature. 2007;450(7169):560–5. doi: 10.1038/nature06269. [DOI] [PubMed] [Google Scholar]
- 6.Wooley JC, Godzik A, Friedberg I. A primer on metagenomics. PLoS Comput Biol. 2010;6(2):e1000667. doi: 10.1371/journal.pcbi.1000667. [DOI] [PMC free article] [PubMed] [Google Scholar]
- 7.Zhao S, Fung-Leung WP, Bittner A, Ngo K, Liu X. Comparison of RNA-Seq and microarray in transcriptome profiling of activated T cells. PLoS One. 2014;9(1):e78644. doi: 10.1371/journal.pone.0078644. [DOI] [PMC free article] [PubMed] [Google Scholar]
- 8.Illumina. 2016. Available at: http://www.illumina.com/
- 9.Fisher T. 2016. Available at: https://www.thermofisher.com/us/en/home/brands/ion-torrent.html.
- 10.Yeo ZX, Wong JC, Rozen SG, Lee AS. Evaluation and optimisation of indel detection workflows for ion torrent sequencing of the BRCA1 and BRCA2 genes. BMC Genomics. 2014;15:516. doi: 10.1186/1471-2164-15-516. [DOI] [PMC free article] [PubMed] [Google Scholar]
- 11.PacBio 2016. Available at: http://www.pacb.com/
- 12.Wikipedia FASTQ Format. 2016. Available at: https://en.wikipedia.org/wiki/FASTQ_format.
- 13.Kodama Y, Shumway M, Leinonen R, International Nucleotide Sequence Database Collaboration The Sequence Read Archive: explosive growth of sequencing data. Nucleic Acids Res. 2012;40(Database issue):D54–6. doi: 10.1093/nar/gkr854. [DOI] [PMC free article] [PubMed] [Google Scholar]
- 14.sra-tools 2016. Available at: https://github.com/ncbi/sra-tools.
- 15.Trimmomatic 2013. Available at: www.usadellab.org/cms/?page=trimmomatic; http://www.usadellab.org/cms/index.php?page=trimmomatic.
- 16.ReferenceGenome. E pluribus unum. Nat Methods. 2010;7:331. doi: 10.1038/nmeth0510-331. [DOI] [PubMed] [Google Scholar]
- 17.Haas BJ, Papanicolaou A, Yassour M, et al. De novo transcript sequence reconstruction from RNA-seq using the Trinity platform for reference generation and analysis. Nat Protoc. 2013;8(8):1494–512. doi: 10.1038/nprot.2013.084. [DOI] [PMC free article] [PubMed] [Google Scholar]
- 18.Langmead B, Salzberg SL. Fast gapped-read alignment with Bowtie 2. Nat Methods. 2012;9(4):357–9. doi: 10.1038/nmeth.1923. [DOI] [PMC free article] [PubMed] [Google Scholar]
- 19.Abuin JM, Pichel JC, Pena TF, Amigo J. SparkBWA: speeding up the alignment of high-throughput DNA sequencing data. PLoS One. 2016;11(5):e0155461. doi: 10.1371/journal.pone.0155461. [DOI] [PMC free article] [PubMed] [Google Scholar]
- 20.Jo H, Koh G. Faster single-end alignment generation utilizing multi-thread for BWA. Biomed Mater Eng. 2015;26(suppl 1):S1791–6. doi: 10.3233/BME-151480. [DOI] [PubMed] [Google Scholar]
- 21.Li H, Durbin R. Fast and accurate short read alignment with Burrows-Wheeler transform. Bioinformatics. 2009;25(14):1754–60. doi: 10.1093/bioinformatics/btp324. [DOI] [PMC free article] [PubMed] [Google Scholar]
- 22.Li R, Li Y, Kristiansen K, Wang J. SOAP: short oligonucleotide alignment program. Bioinformatics. 2008;24(5):713–4. doi: 10.1093/bioinformatics/btn025. [DOI] [PubMed] [Google Scholar]
- 23.Li H, Handsaker B, Wysoker A, et al. The sequence alignment/map format and SAMtools. Bioinformatics. 2009;25(16):2078–9. doi: 10.1093/bioinformatics/btp352. [DOI] [PMC free article] [PubMed] [Google Scholar]
- 24.Trapnell C, Pachter L, Salzberg SL. TopHat: discovering splice junctions with RNA-Seq. Bioinformatics. 2009;25(9):1105–11. doi: 10.1093/bioinformatics/btp120. [DOI] [PMC free article] [PubMed] [Google Scholar]
- 25.Trapnell C, Williams BA, Pertea G, et al. Transcript assembly and quantification by RNA-Seq reveals unannotated transcripts and isoform switching during cell differentiation. Nat Biotechnol. 2010;28(5):511–5. doi: 10.1038/nbt.1621. [DOI] [PMC free article] [PubMed] [Google Scholar]
- 26.Kim D, Langmead B, Salzberg SL. HISAT: a fast spliced aligner with low memory requirements. Nat Methods. 2015;12(4):357–60. doi: 10.1038/nmeth.3317. [DOI] [PMC free article] [PubMed] [Google Scholar]
- 27.Pertea M, Pertea GM, Antonescu CM, Chang TC, Mendell JT, Salzberg SL. StringTie enables improved reconstruction of a transcriptome from RNA-seq reads. Nat Biotechnol. 2015;33(3):290–5. doi: 10.1038/nbt.3122. [DOI] [PMC free article] [PubMed] [Google Scholar]
- 28.McKenna A, Hanna M, Banks E, et al. The Genome Analysis Toolkit: a MapReduce framework for analyzing next-generation DNA sequencing data. Genome Res. 2010;20(9):1297–303. doi: 10.1101/gr.107524.110. [DOI] [PMC free article] [PubMed] [Google Scholar]
- 29.Hillman-Jackson J, Clements D, Blankenberg D, Taylor J, Nekrutenko A, Galaxy Team Using Galaxy to perform large-scale interactive data analyses. Curr Protoc Bioinformatics. 2012 doi: 10.1002/0471250953.bi1005s38. Chapter 10:Unit10.5. [DOI] [PMC free article] [PubMed] [Google Scholar]
- 30.Gentleman RC, Carey VJ, Bates DM, et al. Bioconductor: open software development for computational biology and bioinformatics. Genome Biol. 2004;5(10):R80. doi: 10.1186/gb-2004-5-10-r80. [DOI] [PMC free article] [PubMed] [Google Scholar]
- 31.Pordes R, Petravick D, Kramer B, et al. The open science grid. J Phys Conf Ser. 2007;78(1):012057. [Google Scholar]
- 32.Foster I. Globus online: accelerating and democratizing science through cloud-based services. IEEE Internet Comput. 2011;15(03):70–3. [Google Scholar]
- 33.Thain D, Tannenbaum T, Livny M. Distributed computing in practice: the Condor experience. Concurr Comput. 2005;17(2–4):323–56. [Google Scholar]
- 34.Deelman E, Vahi K, Juve G, et al. Pegasus: a workflow management system for science automation. Future Gener Comput Syst. 2015;46:17–35. [Google Scholar]
- 35.Feltus FA, Ficklin SP, Gibson SM, Smith MC. Maximizing capture of gene co-expression relationships through pre-clustering of input expression samples: an Arabidopsis case study. BMC Syst Biol. 2013;7:44. doi: 10.1186/1752-0509-7-44. [DOI] [PMC free article] [PubMed] [Google Scholar]
- 36.Langfelder P, Horvath S. WGCNA: an R package for weighted correlation network analysis. BMC Bioinformatics. 2008;9:559. doi: 10.1186/1471-2105-9-559. [DOI] [PMC free article] [PubMed] [Google Scholar]
- 37.Vu TN, Wills QF, Kalari KR, et al. Beta-Poisson model for single-cell RNA-seq data analyses. Bioinformatics. 2016;32:2128–35. doi: 10.1093/bioinformatics/btw202. [DOI] [PubMed] [Google Scholar]
- 38.OSG 2016. Available at: https://www.opensciencegrid.org/
- 39.Poehlman W OSG-GEM. 2016. Available at: https://github.com/feltus/OSG-GEM. [DOI] [PMC free article] [PubMed]
- 40.GENCODE. GENCODE 2016. Available at: http://www.gencodegenes.org.
- 41.Blakeley P, Fogarty NM, del Valle I, et al. Defining the three cell lineages of the human blastocyst by single-cell RNA-seq. Development. 2015;142(18):3151–65. doi: 10.1242/dev.123547. [DOI] [PMC free article] [PubMed] [Google Scholar]
- 42.Wikipedia FASTA Format. 2016. Available at: https://en.wikipedia.org/wiki/FASTA_format.
- 43.ENSEMBL. GTF/GFF Format 2016. Available at: http://useast.ensembl.org/info/website/upload/gff.html.
- 44.HISAT2_BUILD 2016. Available at: https://ccb.jhu.edu/software/hisat2/manual.shtml#the-hisat2-build-indexer.
- 45.BOWTIE2-BUILD 2016. Available at: http://bowtie-bio.sourceforge.net/bowtie2/manual.shtml#the-bowtie2-build-indexer.


