Abstract
By simulations on the distance distribution function (DDF) derived from small angle X‐ray scattering (SAXS) theoretical data of a dense monodisperse system, we found a quantitative mathematical correlation between the apparent size of a spherically symmetric (or nearly spherically symmetric) homogenous particle and the concentration of the solution. SAXS experiments on protein solutions of human hemoglobin and horse myoglobin validated the correlation. This gives a new method to determine, from the SAXS DDF, the size of spherically symmetric (or nearly spherically symmetric) particles of a dense monodisperse system, specifically for protein solutions with interference effects.
Keywords: protein size, inter‐particle interference, distance distribution function, small angle X‐ray scattering
Introduction
Small angle X‐ray scattering (SAXS) is an ideal tool to study the low resolution structure of proteins in solution.1, 2, 3, 4, 5, 6 Many protein solutions can be approximated by a monodisperse system where shape and size are the two main characteristic parameters.3, 4, 5, 6 For a dilute monodisperse system, the Guinier approximation and distance distribution function (DDF) are often used for SAXS data analysis. The former can yield the radius of gyration of the scatterer,1, 7 while the latter can yield the shape and size of the scatterer.1, 8, 9, 10, 11 In common biological systems, the dilute regime is always an approximation because the cellular environment is quite crowded.12 Therefore, inter‐particle interference, i.e. the concentration effect, occurs frequently in practical SAXS work,13, 14, 15, 16, 17, 18 and it can distort both the scattered curve and the DDF curve.1 To overcome inter‐particle interference in bioSAXS measurements, the common practice is to run samples in a series of concentrations and extrapolate the forward scattering to zero concentration by fitting SAXS data against concentrations.1 At present, no established mathematical description of the concentration effect on DDF is available. If one can derive a model that describes the concentration effect on the DDF it could be used as a tool to study the interactions of the proteins. It is well known that many proteins in solution can roughly be approximated by a spherically symmetric (or nearly spherically symmetric) shape.12 In this contribution, we present a mathematical correlation between the spherically symmetric (or nearly spherically symmetric) particle size and the solution concentration by simulation on the DDF derived from SAXS theoretical data of a dense monodisperse system. The correlation has been validated by SAXS experimental data of human hemoglobin and horse myoglobin solutions.
Methods
Simulation
A sphere model is often used in the SAXS analysis of biological systems. Moreover, if the structure of particles does not depend on the concentration, the scattering intensity of a dense system of monodisperse spheres may be written as:1, 7
| (1) |
where K is a constant, q is the scattering vector, R is the radius of the spherically symmetric (or nearly spherically symmetric) particle, V 1 is the average volume offered to each particle, V 0 is the total volume offered to the particles, V 0/V 1 is the well‐defined number of particles contained in or the packing parameter1 associated to the particle concentration, ψ(qR) is the scattering amplitude of a spherically symmetric (or nearly spherically symmetric) particle with radius R, which may be expressed as
| (2) |
An important step of the particle shape and size determination is the calculation of the distance distribution function P(r), which may be obtained from the scattering intensity using the Fourier transform:2, 4
| (3) |
P(r) is related to the frequency of certain distances r within a particle. Therefore, it starts from zero at r = r 1 = 0 and goes to zero at r = r 2 = 2R = D max (the maximum distance in the particle). The shape of the P(r) function gives approximate information about the shape of the particle. If the function is approximately symmetric, the particle may be approximated as a sphere.3, 4 If we consider K = 1 and R = 1 nm, we can compute different scattering curves corresponding to different V 0/V 1 values (see Fig. 1) based on Eqs. (1) and (2), and further calculate the corresponding distance distribution functions (see Fig. 2) based on Eq. (3).
Figure 1.
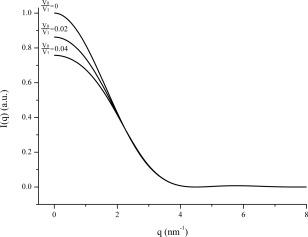
Theoretical scattering curves for monodisperse systems with different volume ratios based on a sphere interference model derived from Eqs. (1) and (2) with K = 1 and R = 1 nm. where K is a constant, R is the radius of the spherically symmetric (or nearly spherically symmetric) particle, V 1 is the average volume offered to each particle, V 0 is the total volume offered to the particles, V 0/V 1 is the well‐defined number of particles contained in V 0, I is scattering intensity, q is the scattering vector, a.u. means arbitrary units.
Figure 2.
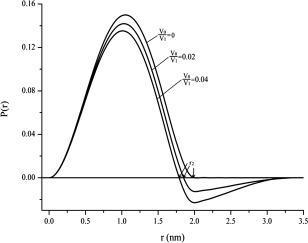
Theoretical distance distribution function P(r) for monodisperse systems with different volume ratios based on a sphere interface model derived from theoretical scattering intensities in Figure 1 using Eq. (3). P(r) is related to the frequency of certain distances r within a particle. r 2 is labeled at which P(r)=0.
The inter‐particle interference effect, i.e., the concentration effect, is well described in the literature1 and associated to a decrease of the intensity at low angles (see Fig. 1) and the occurrence of negative P(r) values (see Fig. 2). From a theoretical point of view, only the scattering at infinite dilution can eliminate the interference contribution, the corresponding P(r) function is always positive for particles with homogenous distribution of electron density and the resultant r 2 value at which P(r)=0, is close to the true diameter D max of the homogenous particle. In practice, samples with non‐negligible concentration are needed to obtain a sufficient signal. Moreover, as long as there is no aggregation, the higher the sample concentration, the lower the scattering intensity at low angles and the smaller the apparent r 2 value at which P(r) goes to zero. Figure 3 shows the variation of r 2 as a function of V 0/V 1 based on the data derived from P(r) versus r data (as Fig. 2 illustrated). The curve in Figure 3 seems like an exponential function as
| (4) |
Figure 3.
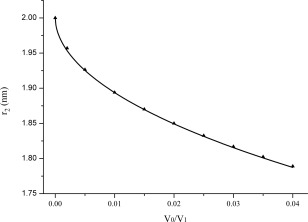
Variation of the apparent r 2 versus V 0/V 1 derived from distance distribution function data. r 2 is labeled at which P(r)=0, V 1 is the average volume offered to each particle, V 0 is the total volume offered to the particles.
Which can be converted into
| (5) |
Where a and b are constants. By least square fitting, we found an approximation which yields a fair representation of the linear part in Figure 4:
| (6) |
and the coefficient of the fit is 0.9998, namely a R‐square = 0.9998. The derived D max value is 2.002 nm, almost coincident with the theoretical value of 2 nm. The volume fraction V 0/V 1 is proportional to the concentration c (usually in unit of mg/mL), so we can change the Eq. (6) as:
| (7) |
where K′ is a constant. Obviously, lnr 2 versus c 0.52 presents a linear line, and D max can be derived from the linear line intercept. Equation (7) is now an empirical formula that gives a mathematical description of the relation between the size of spherically symmetric (or nearly spherically symmetric) particles and the concentration of a solution of a dense monodisperse system. If the particle density is unknown, we need at least two concentrations although additional concentrations will obviously give a better statistical analysis.
Figure 4.
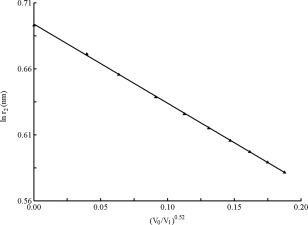
Variation of the apparent lnr 2 versus (V 0/V 1)0.52 based on the data derived from Figure 3. r 2 is labeled at which P(r)=0, V 1 is the average volume offered to each particle, V 0 is the total volume offered to the particles.
Experiments
Solutions of human hemoglobin (Sigma‐H7379) were first used to validate the reliability of Equation (7). Human hemoglobin is well approximated by a sphere.19 The sample concentrations c were 2, 10, 20, and 50 mg/mL, respectively. The experiment was performed at the X33 SAXS station at the storage ring DORIS III of the Deutsches Elektronen Synchrotron (DESY, Hamburg, Germany). The incident X‐ray wavelength was 0.15 nm. The scattering signals were recorded with a 1M PILATUS detector (Dectris, Baden, Switzerland). The data processing was performed with S program package.20
Solutions of horse skeletal muscle myoglobin (Sigma Aldrich) which is also well approximated by a sphere21 were used to further validate the reliability of Equation (7). The sample concentrations c were 5, 10, 20 and 30 mg/ml, respectively. The experiment was performed at the 1W2A SAXS station at Beijing Synchrotron Radiation Facility (BSRF, Beijing, China).22 The incident X‐ray wavelength was 0.154 nm. The scattering signals were recorded with a 1MF PILATUS detector (Dectris, Baden, Switzerland). The data processing was the same as that of human hemoglobin.
Results and Discussion
The measured scattering curves of the human hemoglobin solutions with different concentrations are plotted in Figure 5. Equation (3) was used to compute the distance distribution function P(r). The final curves of P(r) versus r of the human hemoglobin solutions at different concentrations are shown in Figure 6.
Figure 5.
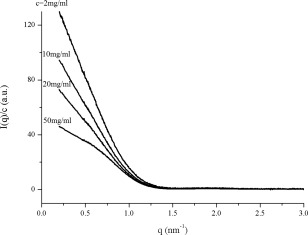
Experimental scattering curves of human hemoglobin solutions at different concentrations measured at the X33 SAXS station at the storage ring DORIS III of the Deutsches Elektronen Synchrotron (DESY, Hamburg, Germany) with the incident X‐ray wavelength of 0.15 nm and a 1M PILATUS (Dectris, Baden, Switzerland) as detector. I is scattering intensity, q is the scattering vector, c is the concentration of samples.
Figure 6.
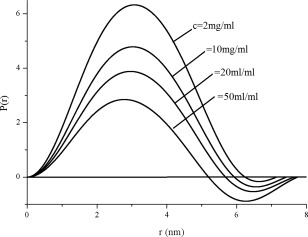
Distance distribution function curves of human hemoglobin solutions at different concentrations c derived from the corresponding scattering curves in Figure 5. P(r) is related to the frequency of certain distances r within a particle.
Obviously, the inter‐particle interference manifests itself in the decrease of the scattered intensity at small angles (Fig. 5) and the occurrence of negative P(r) values (Fig. 6). The higher the sample concentration, the lower the scattering intensity at low angles and the smaller the apparent r 2 value at which P(r)=0. The apparent lnr 2 values obtained from Figure 6 as a function of protein concentration c 0.52 is shown in Figure 7. Fitting data in Figure 7 using Eq. (7) yields a maximum size of the human hemoglobin D max = 6.5 nm, a value extremely close to the value of 6.4 nm available in the literature.6 Data can be considered in good agreement and the empirical formula (7) is reasonably validated.
Figure 7.
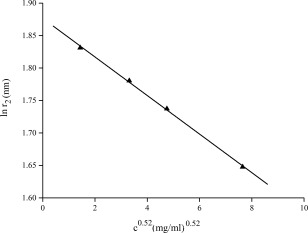
Variation of the apparent lnr 2 values (at which P(r)=0) obtained from Figure 6 versus the concentration c 0.52 of human hemoglobin solutions. r 2 is labeled at which P(r)=0, c is the concentration of samples.
Similar analysis was performed on SAXS data of horse myoglobin solutions. Figure 8 shows the variation of lnr 2 versus c 0.52 of horse myoglobin solution. Fitting the data in Figure 8 using Eq. (7) yields a maximum size of the horse myoglobin D max = 4.7 nm, close to the value of 4.4 nm available in the literature.9 This further indicates that Eq. (7) is valid.
Figure 8.
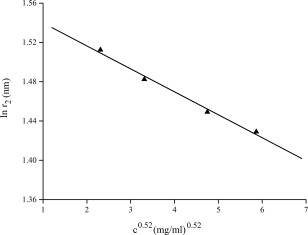
Variation of the apparent lnr 2 values versus the concentration c0.52 of horse myoglobin solutions. SAXS experiments of horse myoglobin solutions were performed at the 1W2A SAXS station at Beijing Synchrotron Radiation Facility (BSRF, Beijing, China) with the incident X‐ray wavelength of 0.154 nm and a 1MF PILATUS (Dectris, Baden, Switzerland) as detector. r 2 is labeled at which P(r)=0, c is the concentration of samples.
Conclusion
A mathematical equation for analysis of SAXS data from a dense monodisperse system, in particular, concentrated solutions of biological macromolecules, is presented. In a framework in which the structure of particles does not depend on the concentration, this mathematical approach describes quantitatively the relation between the apparent size of spherically symmetric (or nearly spherically symmetric) particles with homogenous distribution of electron density and the concentration of the solution. The equation obtained has been validated using protein solutions of human hemoglobin and horse myoglobin. This method provides a new and useful way to evaluate the size of spherically symmetric (or nearly spherically symmetric) particles in a dense monodisperse system that exhibits interference effects in SAXS experiments.
Acknowledgment
The authors wish to thank Dr. Youli Li (University of California, Santa Barbara, USA) for valuable advice.
References
- 1. Glatter O, Kratky O (1982) Small angle X‐ray scattering. New York: Academic Press. [Google Scholar]
- 2. Feigin LA, Svergun DI (1987) Structure analysis by small‐angle X‐ray and neutron scattering. New York: Plenum Press. [Google Scholar]
- 3. Koch MHJ, Vachette P, Svergun DI (2003) Small‐angle scattering: a view on the properties, structures and structural changes of biological macromolecules in solution. Quart Rev Biophys 36:147–227. [DOI] [PubMed] [Google Scholar]
- 4. Svergun DI, Koch MHJ, Timmins PA, May RP (2013) Small angle X‐ray and neutron scattering from solutions of biological macromolecules. Oxford University Press, USA. [Google Scholar]
- 5. Choi MC, Raviv U, Li Y, Miller HP, Needleman DJ, Kim MW, Wilson L, Feinstein SC, Safinya CR (2011) Synchrotron small angle X‐ray scattering quantitatively detects angstrom level changes in the average radius of taxol‐stabilized microtubules decorated with the microtubule‐associated‐protein tau. J Phys Confer Ser 272:012001. [Google Scholar]
- 6. VanOudenhove J, Anderson E, Krueger S, Cole JL (2009) Analysis of PKR structure by small‐angle scattering. J Mol Biol 387:910–920. [DOI] [PMC free article] [PubMed] [Google Scholar]
- 7. Guinier A, Fournet G (1955) Small angle scattering of X‐rays. New York: John Wiley & Sons. [Google Scholar]
- 8. Liu H, Zwart PH (2012) Determining pair distance distribution function from SAXS data using parametric functionals. J Struct Biol 180:226–234. [DOI] [PubMed] [Google Scholar]
- 9. Oleksandr OM, Anthony JR, Nadezhda T, Neal W (2007) The application of distance distribution functions to structural analysis of core–shell particles. J Appl Cryst 40:s506–s511. [Google Scholar]
- 10. Paradies HH (1993) Particle size distribution and determination of characteristic properties of colloidal bismuth‐silica compounds by small‐angle X‐ray scattering and inelastic light scattering. Colloids Surf a Physicochem Eng Asp 74:57–69. [Google Scholar]
- 11. Hong X, Hao Q (2009) High resolution pair‐distance distribution function P (r) of protein solutions. Appl Phys Lett 94:083903. [Google Scholar]
- 12. Goldenberg DP, Argyle B (2014) Self crowding of globular proteins studied by small‐angle x‐ray scattering. Biophys J 106:895–904. [DOI] [PMC free article] [PubMed] [Google Scholar]
- 13. Zhang FJ, Skoda MWA, Jacobs RMJ, Martin RA, Martin CM, Schreiber F (2007) Protein interactions studied by SAXS: effect of ionic strength and protein concentration for BSA in aqueous solutions. J Phys Chem B 111:251–259. [DOI] [PubMed] [Google Scholar]
- 14. Molina C, Dahmouche K, Hammer P, Bermudez VDZ, Carlos LD, Ferrari M, Montagna M, Gonçalves RR, Oliveira LFCD Edwards HGM, Messaddeqa Y Ribeiro SJL (2006) Structure and properties of Ti4+‐ureasil organic‐inorganic hybrids. J Braz Chem Soc 17:443–452. [Google Scholar]
- 15. Cozzolino S, Galantini L, Giglio E, Hoffmann S, Leggio C, Pavel NV (2006) Structure of sodium glycodeoxycholate micellar aggregates from small‐angle X‐ray scattering and light‐scattering techniques. J Phys Chem B 110:12351–12359. [DOI] [PubMed] [Google Scholar]
- 16. Caetano W, Barbosa LRS, Itri R, Tabak M (2003) Trifluoperazine effects on anionic and zwitterionic micelles: a study by small angle X‐ray scattering. J Colloid Interf Sci 260:414–422. [DOI] [PubMed] [Google Scholar]
- 17. Tsao CS, Lin TL, Yu MS (1999) An improved small‐angle X‐ray scattering analysis of δ′ precipitation in Al‐Li alloy with hard‐sphere interaction. Scripta Mater 41:81–87. [Google Scholar]
- 18. Kaburagi M, Bin Y, Zhu D, Xu C, Matsuo M (2003) Small angle X‐ray scattering from voids within fibers during the stabilization and carbonization stages. Carbon 41:915–926. [Google Scholar]
- 19. Muirhead H, Perutz MF (1963) Structure of haemoglobin. Nature 199:633–638. [DOI] [PubMed] [Google Scholar]
- 20. Li ZH (2013) A program for SAXS data processing and analysis. Chin Phys C 37:108002. [Google Scholar]
- 21. Yiu HHP, Botting CH, Botting NP, Wright PA (2001) Size selective protein adsorption on thiol‐functionalised SBA‐15 mesoporous molecular sieve. Phys Chem Chem Phys 3:2983–2985. [Google Scholar]
- 22. Li ZH, Wu ZH, Mo G, Xing XQ, Liu P (2014) A small angle X‐ray scattering station at Beijing Synchrotron Radiation Facility. Instrum Sci Technol 42:128–141. [Google Scholar]


