Abstract
Active metabolic pathways in three-dimensional cancer-cell cultures are potential chemotherapeutic targets that would be effective throughout tumors. Chaotic vasculature creates cellular regions in tumors with distinct metabolic behavior that are only present in aggregate cell masses. To quantify cancer cell metabolism, transformed mouse fibroblasts were grown as spheroids and fed isotopically labeled culture medium. Metabolite uptake and production rates were measured as functions of time. Gas chromatography - mass spectrometry was used quantify the extent of labeling on amino acids present in cytoplasmic extracts. The labeling pattern identified several active and inactive metabolic pathways: glutaminolysis was found to be active, and malic enzyme and gluconeogenesis were inactive. Transformed cells in spheroids were also found to actively synthesize serine, cysteine, alanine, aspartate, glutamate, and proline; and not synthesize glutamine. The activities of these pathways suggest that cancer cells consume glutamine for biosynthesis and not to provide cellular energy. Determining active metabolic pathways indicates how cells direct carbon flow and may lead to the discovery of novel molecular targets for anti-cancer therapy.
Keywords: Tumor metabolism, GC-MS, Spheroids, Pentose phosphate pathway, Glutaminolysis
Introduction
Understanding the metabolism of cancer cells in three-dimensional tissue could play a key role in the development of targeted cancer therapeutics1–2. Identifying active metabolic pathways defines the behavior of cancer cells grown under physiological conditions and can identify enzymatic targets for therapy. Several metabolic pathways have previously been proposed as targets for anti-cancer agents3–6. Inhibitors for the key enzymes in these pathways have been shown to reduce cancer cell growth and are promising therapeutics6–11.
Multicellular spheroids are circular clusters of cells grown suspended in culture medium2, 12–13. Spheroids mimic the distribution of cell populations in tumors and create more realistic cell-cell interactions than monolayer cultures. Similar to tumors in vivo, most cells in spheroids touch neighboring cells on all sides. In addition, the chaotic vasculature in tumors14–15 creates distinct populations of cells with unique physiologies based on their distance to the nutrient supply12. The concentric layers of cell in spheroids replicate the distinct metabolic microenvironments that are arranged around blood vessels in tumors12.
The intracellular metabolism of cancer cells grown as spheroids can be rapidly investigated using stable 13C labeling and gas chromatography mass spectrometry (GC-MS). In a typical isotope experiment, labeled substrates are introduced into cell culture systems and intracellular metabolite labeling is measured. Two common isotope measurement techniques are mass spectrometry (MS) and nuclear magnetic resonance (NMR) spectroscopy1–2, 16–17. The major advantage of mass spectrometry is that it requires considerably less cellular material. Comparatively, NMR has the advantage of being able to identify specific labeling positions1–2. The smaller sample sizes required for GC-MS enables experiments to be run more rapidly and reduces the use of expensive labeled substrates. Increased sensitivity also considerably reduces required culture sizes, reduces mammalian culture apparatus, and increases culture uniformity. Previously, isotopic labeling and GC-MS has been used to measure metabolism in numerous mammalian systems, including hepatic cells18–20, cardiac cells21, and glial cells22.
Here we describe the use of 13C labeling and GC-MS analysis to investigate the metabolism of transformed fibroblasts cells grown as spheroids. Both small and large spheroids were grown to identify the metabolic differences between proliferating and quiescent cells. Basic metabolic behavior was determined by measuring the rates of metabolite uptake and production. The labeling patterns of cytosolic amino acids were determined and used to identify active and inactive metabolic pathways. Metabolic analysis of cancer cells in physiologically relevant, three-dimensional culture is important because it will help identify critical metabolic pathways and future targets for cancer therapeutics.
METHODS
Cell and Spheroid Culture
Mouse embryonic ras-transformed fibroblasts derived from embryonic stem cells were a kind gift from Dr. R. Johnson (University of California, San Diego). This artificially transformed cell line does not directly mimic a specific human tumor, but has been shown to form tumors in mice23. Cells were grown in high glucose Dulbecco Modified Eagle Medium (DMEM; 4.5 g/L glucose) containing 20mM HEPES buffer (pH 7.4) supplemented with 10% fetal bovine serum. All reagents were obtained from Sigma-Aldrich (St. Louis, MO) unless otherwise noted. Cultures were maintained at 37°C with 5% CO2 in a humidified incubator. Spheroids were formed by inoculating a single-cell suspension into flasks coated with poly(2-hydroxyethyl methacrylate) at a density of 106 cells/mL. The methacrylate coating prevented cell adhesion to the flask surface. Average spheroid size was dependent on time in culture as described previously2.
Spheroid size was determined by acquiring microscope images of spheroids suspended in 2–5 ml drops of culture medium, removed from well-mixed T-flasks. Microscopy was performed with an Olympus IX71 inverted microscope equipped with a 10× Plan-APO fluorescence objective and IPLab software (Scanalytics, Fairfax, VA). Diameters were measured by manually fitting ellipses to the spheroid boundaries and measuring the length of the major axis. The number of cells in spheroid cultures was determined by counting the number of cells in 1ml of medium removed from well-mixed T-flasks. Samples were centrifuged and the medium was removed. After washing with 1ml PBS, spheroids were treated with trypsin-EDTA for 10 minutes and dissociated by repeated pipetting. Complete media and trypan blue were added and the number of cells was manually counted using a hemocytometer.
Experimental Protocol
Small and large spheroid cultures were both derived from the same initial spheroid cultures. After seven days of growth, two culture flasks were combined and 25% of the volume was separated. This smaller fraction was allowed to continue growing for 12 additional days to form large spheroids. The remaining 75% of the culture volume containing small spheroids was immediately analyzed. Small, 7-day-old and large, 19-day-old spheroids were analyzed identically. Culture media was replaced with isotopically labeled medium, prepared by supplementing DME base medium with 4.5 g/L 1-13C glucose (Cambridge Isotope Laboratories, Andover, MA) and standard concentrations of L-glutamine (0.584 g/L), phenol red (0.0159 g/L), sodium pyruvate (0.11 g/L) and sodium bicarbonate (3.7g/L). Media samples were taken every 4 hours and the concentrations of glucose, lactate, glutamate and glutamine were measured with a biochemistry analyzer (YSI, Yellow Springs, OH). After 24 hours, the spheroid concentration, average spheroid diameter, and overall cell concentration were measured. The cells in the cultures were then centrifuged at room temperature, resuspended in water and homogenized with a hand-held homogenizer (Ultra-TurraxT25, Rose Scientific Ltd., Edmonton, Alberta) for 3 minutes. The time from centrifugation to homogenization was kept beneath 10 minutes to minimize isotopic rearrangement in intracellular metabolite pools. Water was removed from cell extracts by lyophilization. Each experiment was repeated twice and reported values are averages of the two runs. Extracellular fluxes were calculated by determining the slope of the metabolite concentration profile, multiplying by the volume, and dividing by the number of cells in the culture1–2.
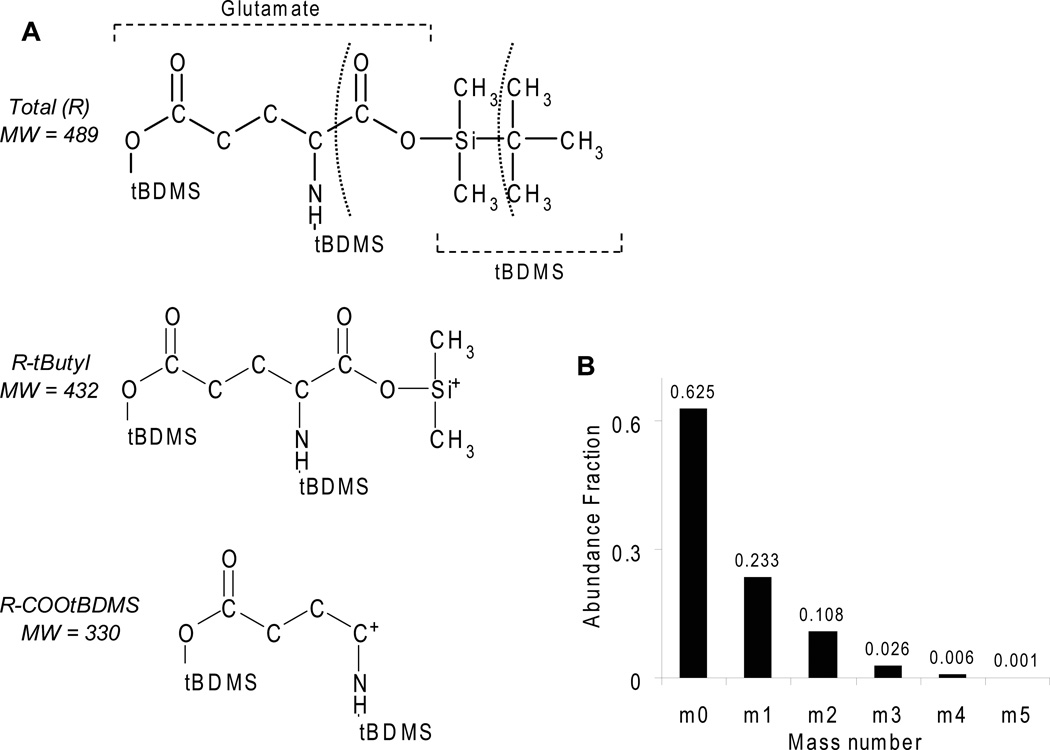
Samples were derivatized and analyzed by GC-MS using procedures similar to those describe previously16–17, 24. Equal parts N,N-dimethylformamide (DMF) and N-methyl-N-(tert-butyldimethyl-silyl) trifluoroacetamide (MTBSTFA) were added to the dry lyophilized extracts. Between 30 and 40 µL of each solvent was used depending on the volume of the extract. The mixtures were stirred and heated at 70° C for 30 minutes. This reaction added a tert-butyldimethylsilyl (tBDMS) group to the carboxyl and amine ends of each amino acid25 (Figure 1A). Analysis was performed by injecting 1.5 µL of derivatized sample into a quadropole GC-MS system (HP 5890 GC and 5894 MS). A single injection was made per sample. The GC was programmed to initiate a thermal ramp starting at 140°C and increase by 3°C per minute until reaching 250°C. The mass spectrometer operated in electron impact ionization mode and fragments were detected with a quadrupole analyzer.
Figure 1.
A) Fragmentation pattern of glutamate derivatized with tert-butyldimethylsilyl (tBDMS). Curved dashed lines indicate two prevalent fragmentation sites that produce the R-tButyl and R-COOtBDMS fragments. B) Mass distribution of the R-tbutyl (M=432) fragment of derivatized glutamate due to natural abundance.
Correction for Natural Isotope Abundance
The mass spectra for each amino acid were corrected for the presence of natural isotopes. The isotope distribution observed for each amino acid was caused by two mechanisms: 1) incorporation of 13C atoms from labeled glucose in the media and 2) the presence of natural isotopes. To determine the extent of label incorporation, the distribution of natural isotopes had to be subtracted from the observed distribution. This subtraction is possible because natural isotope distribution is constant and predictable.
After ionization in the spectrometer, many molecular fragments are produced for each derivatized amino acid. Two of major ionization fragments are the R-tbutyl and the R-COOtBDMS fragments (Figure 1A). As examples, these two fragments of glutamate have molecular weights of 330 and 432. The whole derivatized glutamate molecule contains three tBDMS groups and weighs 489 g/mol. Because the tBDMS group is relatively large (Figure 1A), the probability of a fragment containing a naturally occurring, heavy isotope of carbon, silicon, oxygen or hydrogen is quite large. Specifically, the chance of the 432 fragment of glutamate containing exactly one heavy atom is 23.3% (m1 in figure 1B). Figure 1B shows the entire predicted mass distribution for unlabeled glutamate fragment 432. During analysis, only the R-tbutyl fragment of each amino acid was used because it was the most predominant. This fragment also provided the most information, because it contained all of the original carbon atoms.
To determine the extent of labeling four vectors were defined: the measured mass distribution for each amino acid (D), the mass distribution of each amino acid fragment due to natural isotope abundance (m), the extent of labeling from isotopically labeled glucose (M), and a vector of residual errors (E). For example, the natural isotopic content of the 432 R-tbutyl glutamate fragment () is shown in Figure 1B. The following equation was used to account for the distribution of natural isotopes on each labeled molecule:
| (1) |
Higher order terms were neglected, because peaks greater than M+4 were not detected. The value of the M vector was determined iteratively. An initial value was guessed and subsequently adjusted using a non-linear solver until the sum of least squared errors was minimized. Statistical significance was determined by averaging the labeling from four experiments and calculating the probability that the labeling fraction was zero.
Results and Discussion
Spheroid Size and Extracellular Metabolism
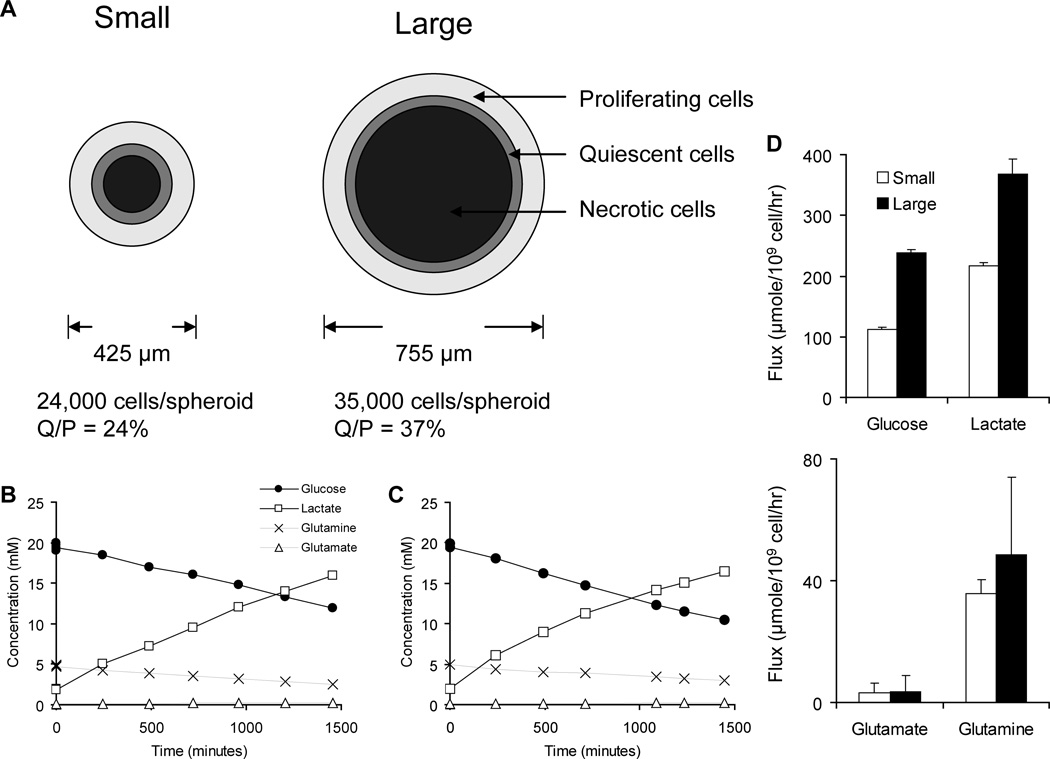
Small and large spheroids contained considerably different populations of cells and had measurably different extracellular metabolism. The average sizes of small and large spheroids were 425 and 755 µm, respectively, and large spheroids contained almost 50% more cells per spheroid (Figure 2). In previous experiments with the same cell line the thicknesses of the proliferating and quiescent regions were determined to be 75 and 40 µm12. Based on these measurements, the ratio of quiescent to proliferating cells in small and large spheroids was 24% and 37%, and large spheroids had 54% more quiescent cells (Figure 2A).
Figure 2.
A) Microenvironment regions present in small and large spheroids. Large spheroids had 54% more cells and a higher ratio of quiescent to proliferating cells. The images are drawn to scale. B,C) Concentration profiles of four extracellular metabolites for (B) small and (C) large spheroids. Glucose and glutamine were consumed, and glutamate and lactate were produced. Cytoplasmic amino acids were extracted immediately after the final time point. D) Absolute values of extracellular fluxes.
Rates of metabolite uptake and production were determined from extracellular concentration profiles (Figure 2B and C). By convention1–2, the absolute value of all fluxes are reported, i.e. glucose and glutamine were consumed and lactate and glutamate were produced (Figure 2D). Large spheroids had higher rates of glucose consumption and lactate production, and the rates of glutamate production and glutamine consumption were similar (Figure 2D). The differences in the extracellular fluxes of glucose and lactate indicate that larger spheroids have higher rates of glycolysis. However, the ratio of lactate produced per glucose molecule drops from 1.93 to 1.55 as spheroid size increases. There are several possibilities that could explain the decrease in this ratio: 1) increased aerobic metabolism facilitated by available oxygen and reuptake of lactate, or 2) diversion of more glucose carbons into the non-oxidative reactions of the pentose phosphate pathway to synthesize ribose.
Amino Acid Labeling in Spheroids
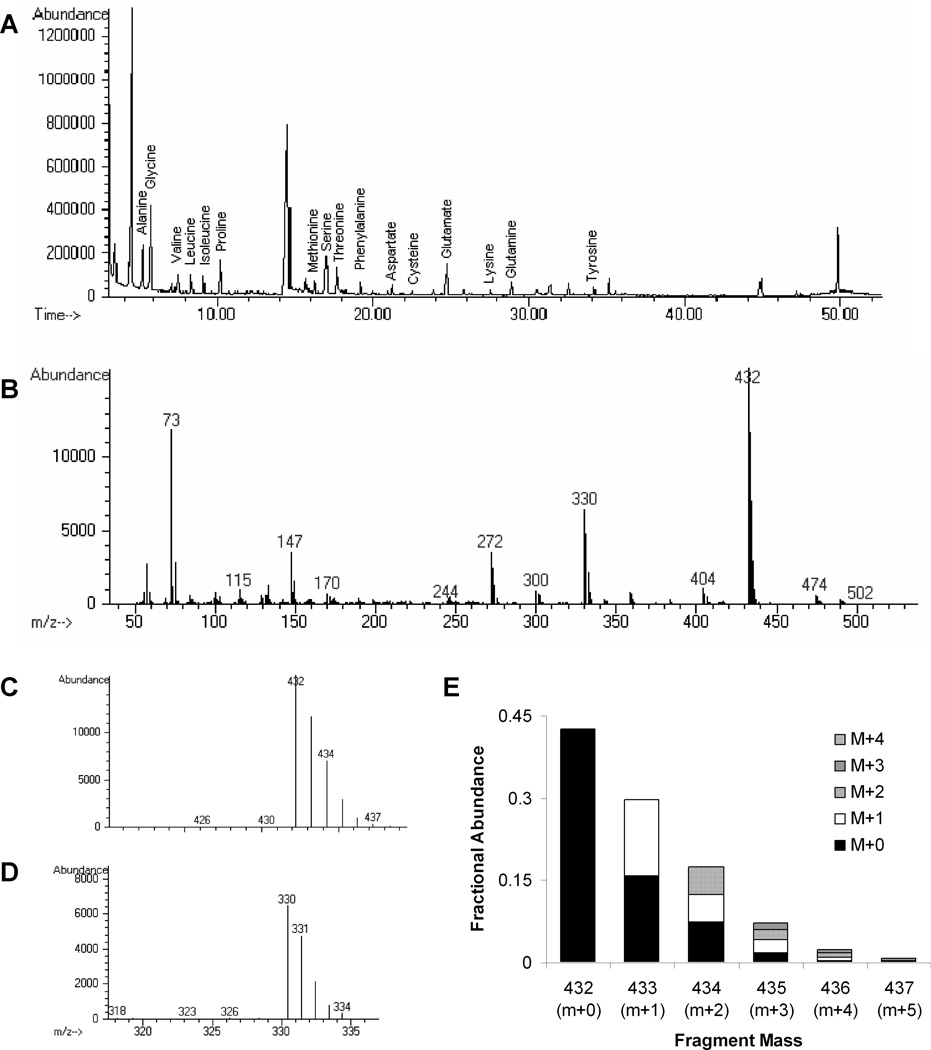
In the homogenized and derivatized cell extracts, 16 amino acids were detected at distinct elution times (Figure 3A) and mass spectra were identified with multiple fragmentation patterns (Figure 3B). As a representative example, the predominant glutamtate peaks at 432 and 330 (Figure 3B) are the R-tbutyl and the R-COOtBDMS fragments17, 25. A mass distribution was observed for each fragment (Figure 3C&D). In most fragments M, M+1, M+2, M+3, M+4 and M+5 peaks were observed. The extent of labeling was determined by accounting for natural isotope abundance. For example, in the mass distribution for glutamate 432 (Figure 3E) the 433 peak contains two species: 1) singly labeled glutamate (M+1, white bar) and 2) unlabeled glutamate (M+0) with one additional mass unit due to naturally abundant isotopes (black bar). For all amino acids, the extent of labeling was identical for both the R-tbutyl and R-COOtBDMS fragments.
Figure 3.
A) Representative chromatogram of total ion abundance over time showing elution of amino acid metabolites. Each amino acid was identified by its mass spectrum and confirmed by its elution order. B) Glutamate mass spectrum showing characteristic fragmentation peaks at 432, 330, and 272. C,D) Expansion of the mass distributions for the glutamate (C) 432, R-tbutyl; and (D) 330, R-COOtBDMS fragments. E) Analysis of the glutamate 432 fragment. Each higher mass species is composed of labeled glutamate and natural abundance isotopes. Degree of labeling was determined by numerical optimization.
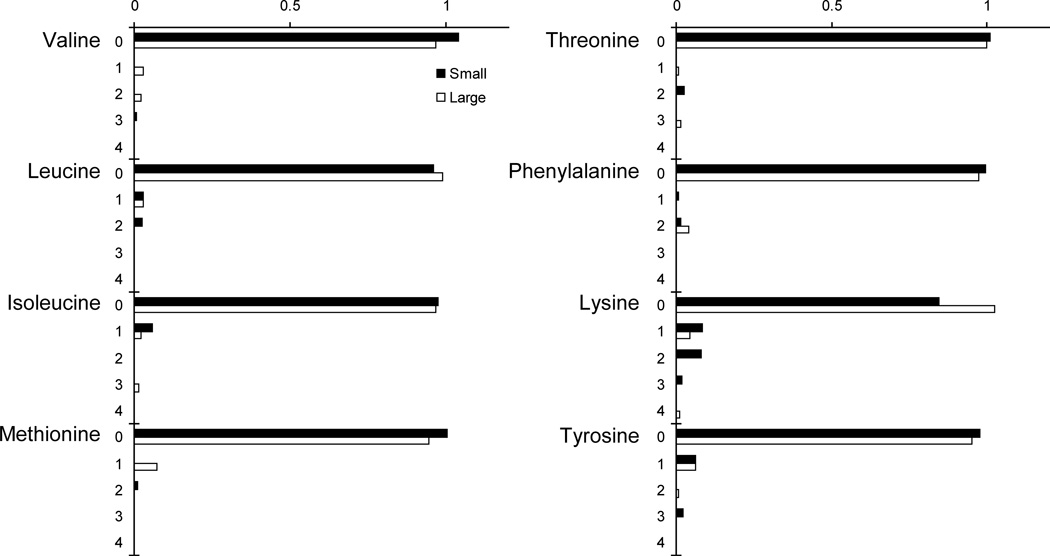
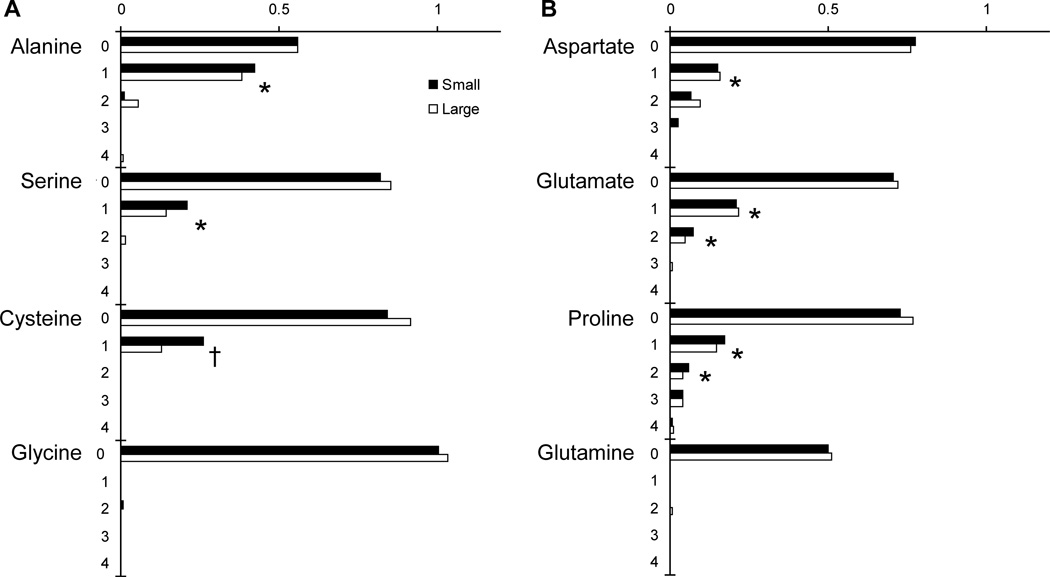
The amino acid isotopomer distribution was almost identical for small and large spheroids (Figures 4 and 5). For both the essential (Figure 4) and non-essential (Figure 5) amino acids, no significant difference in isotope labeling was observed. This suggests that despite differences in spheroid size, quiescent cell content, and extracellular metabolism (Figure 2), intracellular metabolism was similar for both spheroid sizes. No labeling was observed on any essential amino acids (Figure 4), because, as expected, mammalian cells cannot synthesize these. The apparent labeling of lysine was not significantly greater than zero (P=1.3) and was an experimental aberration. These results with essential amino acids provide a check of the method used to subtract naturally abundant isotopes: the observed mass distributions matched that expected due to natural abundance.
Figure 4.
Isotopomer distribution for essential amino acids. Ordinate labels indicate mass number.
Figure 5.
Isotopomer distribution for non-essential amino acids produced from (A) glycolysis and (B) TCA-cycle metabolites. Ordinate labels indicate mass number. Singly labeled species (1, M+1) were observed for alanine, serine, cysteine, aspartate, glutamate and proline; and doubly labeled species (2, M+2) were observed for glutamate and proline (†, P<0.05; *, P<0.01; n=4).
Labeling of Non-Essential Amino Acids
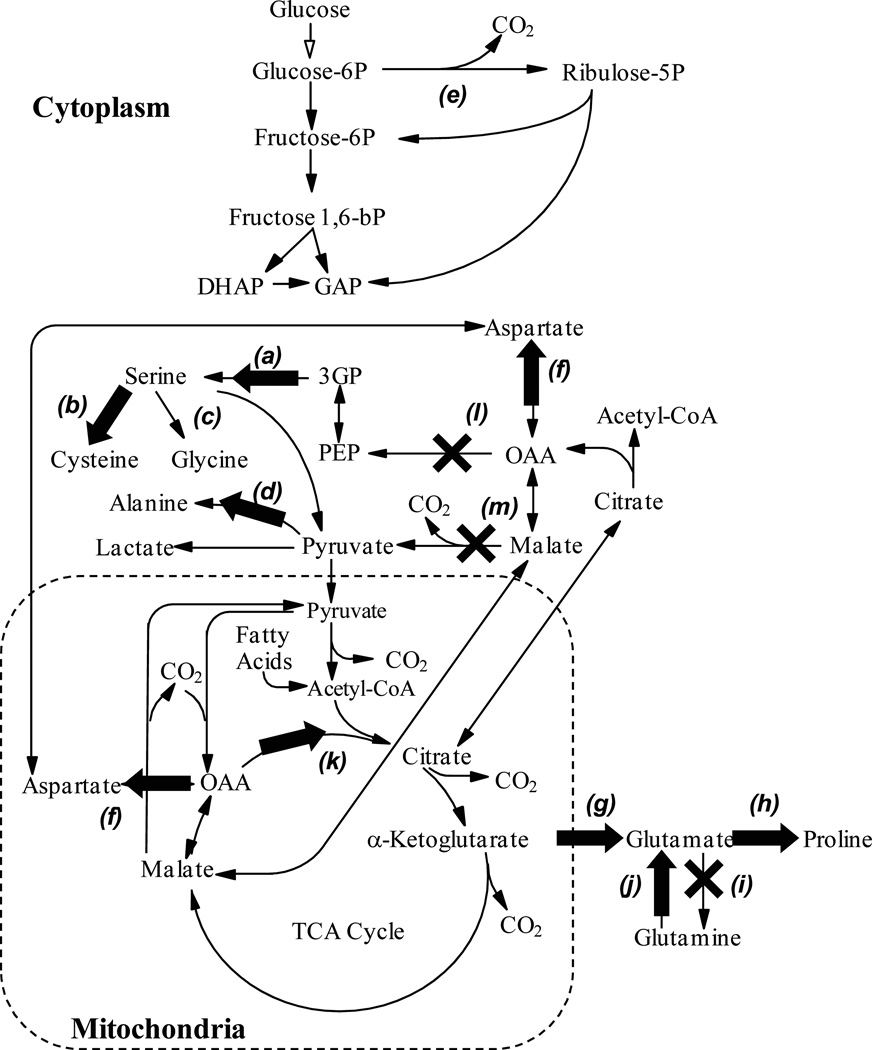
Labeling patterns observed on nonessential amino acids (Figure 5) suggest which intracellular pathways were active in cells grown as spheroids (Figure 6, Table 1). The metabolic map includes the pathways of primary metabolism, including glycolysis, the tricarboxylic acid (TCA) cycle, transport of molecules in and out of mitochondria, and the synthesis of non-essential amino acids (Figure 6). These results describe the intracellular metabolism of transformed cells under cell culture conditions; in vivo metabolism will vary depending on many variables including time, metabolic microenvironment and tumor cite. In culture, at least one other cell line, MCF7 breast cancer cells, has been shown to have similar patterns of pathway activity1. For analysis, amino acids were grouped into those synthesized from glycolysis metabolites (Figure 5A), and those synthesized from TCA-cycle metabolites (Figure 5B).
Figure 6.
Metabolic pathway model, which contains glycolysis, the TCA cycle and some biosynthetic pathways. Labeled pathways are: a) serine synthesis, b) cysteine synthesis, c) glycine synthesis, d) alanine synthesis, e) the pentose phosphate pathway, f) aspartate synthesis, g) glutamate synthesis, h) proline synthesis, i) glutamine synthesis, j) glutamine degradation, k) citrate synthase, l) phosphoenolpyruvate carboxykinase, and m) malic enzyme. Active and inactive pathways are indicated with arrows and X’s, respectively.
Table 1.
Active and Inactive Intracellular Pathways
| Pathway | Primary enzyme(s) | Activity |
|---|---|---|
| a) Serine synthesis | 3-phosphoglycerate dehydrogenase, Phosphoserine phosphatase |
Active |
| b) Cysteine synthesis | Cystathionine β-synthase, Cystathionine γ-lyase |
Active |
| c) Glycine synthesis | Serine hydroxymethyl-transferase | N.D. |
| d) Alanine synthesis | Alanine aminotransferase | Active |
| e) Pentose phosphate pathway or Protein turnover |
Glucose 6-phosphate dehydrogenase Numerous proteases |
Active |
| f) Aspartate synthesis | Aspartate aminotransferase | Active |
| g) Glutamate synthesis | Glutamate dehydrogenase | Active |
| h) Proline synthesis | Pyroline-2-carboxylate reductase | Active |
| i) Glutamine synthesis | Glutamine synthetase | Inactive |
| j) Glutamine degradation | Glutaminase | Active |
| k) TCA cycle | Citrate synthase | Active |
| l) Gluconeogenesis | Phosphoenolpyruvate carboxykinase | Inactive |
| m) TCA-cycle intermediate catabolism |
Malic enzyme | Inactive |
N.D. – not determined
The presence of M+1 labeling on serine (P<0.01) and cysteine (P<0.05; Figure 5A) indicates that serine synthesis (pathways a in Figure 6) and cysteine synthesis (pathways b) are both active. Serine is synthesized from 3-phosphoglycerate by a pathway that includes the enzymes 3-phosphoglycerate dehydrogenase, and phosphoserine phosphatase. The carbon backbone of cysteine is formed from serine by the enzymes cystathionine β-synthase, and cystathionine γ-lyase. In spheroids, these cysteine synthesis enzymes were highly active because the cysteine pool contained relatively the same fraction of labeled molecules as the serine pool (Figure 5A). The metabolic precursor 3-phosphoglycerate was most likely labeled on the third carbon following feeding with 1-13C glucose. Synthesis pathways a and b would have transferred label to the side-chain carbons (carbon-3) of both serine and cysteine. The synthesis of glycine by serine hydroxymethyl-transferase (pathway c) removes the side chain carbon (carbon-3) from serine. Lack of glycine labeling could have been caused by removal of labeled carbon or inactivity of pathway c.
First carbon (M+1) labeling of alanine (P<0.01) indicates that alanine aminotransferase (pathways d) is active. The M+1 labeling on alanine (0.403; 99% CI, 0.370 to 0.436; Figure 5A) was significantly (P>0.01) less than 50%, indicating that pyruvate labeling was diluted. Because alanine is derived directly from pyruvate, the labeling pattern of alanine equals the labeling of pyruvate. Without dilution the extent of pyruvate M+1 labeling would have been expected to be 50%, because two pyruvate molecules are synthesized from each glucose molecule. Two mechanisms could contribute to dilution of pyruvate labeling: 1) the pentose phosphate pathway (pathway e) and 2) protein turnover. If the pentose phosphate pathway was active, pyruvate labeling would have been diminished, because glucose 6-phosphate dehydrogenase removes the labeled first carbon from glucose. Protein turnover would have reduced pyruvate labeling by producing unlabeled amino acids. The breakdown of cysteine, serine, glycine, alanine, threonine and tryptophan would all dilute pyruvate labeling. The M+1 labeling on alanine indicates that at least one of these two pathways is active; however, GC-MS data alone cannot isolate their individual activities. Based on previous NMR studies it is probable both pathways are active1–2.
TCA metabolites
Four of the detected non-essential amino acids are synthesized from TCA cycle metabolites: aspartate, glutamate, glutamine, and proline (Figure 5B). Aspartate is synthesized from oxaloacetate (OAA), and glutamate, glutamine, and proline are synthesized from α-ketoglutarate (Figure 6). Single (M+1) labeling was observed for aspartate (P<0.01), glutamate (P<0.01) and proline (P<0.01) indicating that aspartate aminotransferase (pathway f), aminotransferase (pathway g), and pyroline-2-carboxylate reductase (pathway h) were all active. The lack of any labeling on glutamine (Figure 5B) indicates that glutamine synthetase was inactive and not producing glutamine (pathway i). Because glutamine was consumed (Figure 2), glutaminase (pathway j) was active in the reverse direction producing glutamate from glutamine.
Two of the detected amino acids, glutamate and proline, had significant (P<0.01) double labeling (M+2). The most predominant source of double labeling in primary metabolism is the action of citrate synthase (pathway k), which joins one four-carbon molecule of OAA with one two-carbon molecule of acetyl-CoA. If both molecules are labeled, a doubly labeled molecule of citrate is produced. The double labeling of glutamate and proline indicates that 1) the TCA cycle is active in both small and large spheroids, 2) labeled OAA was produced, and 3) much of the cell’s glutamate and proline are produced from a well mixed α-ketoglutarate pool.
The extent of double labeling on glutamate and proline suggests the rate of diluting pathways into TCA-cycle intermediates is proportional to the rate of the TCA cycle. These diluting fluxes include the degradation of unlabeled proteins, the catabolism of many amino acids, and the breakdown of unlabeled fatty acids into acetyl-coA1–2, 26–27. If these diluting fluxes were slower than the TCA cycle, then the fraction of doubly labeled metabolites would be greater and there would be more higher order, multiply labeled (M+3 and M+4) amino acids. Conversely, if the diluting fluxes were considerably faster, labeled OAA would not be produced and no doubly labeled species would have been observed.
Gluconeogenesis, Malic Enzyme, and Glutaminolysis
The absence of significant double labeling (M+2) on serine, cysteine, and alanine (Figure 5A) indicates that the pathways that connect TCA-cycle metabolites with glycolysis metabolites were minimally active. The primary connecting pathways are phosphoenolpyruvate carboxykinase (PEPCK) and malic enzyme (pathways l and m, respectively). PEPCK, the initial enzyme of gluconeogenesis, was completely inactive because serine, cysteine, and hence, the combined cytosolic 3-phosphoglycerate (3GP) and phosphoenolpyruvate (PEP) pool did not contain any doubly labeled species. It is not surprising that gluconeogenesis is inactive in cultures adequately supplied with glucose.
The absence of significant double labeling on alanine and pyruvate suggests that extra-mitochondrial malic enzyme (pathway m) was minimally active. Reduced activity of malic enzyme suggests that consumed glutamine carbons were used predominantly for biosynthesis. Glutamine consumption is an anapleurotic reaction that increases the pool of TCA-cycle metabolites28. At metabolic steady state, anapleurotic reactions must be balanced by carbon flux out of the mitochondria. Complete oxidation of these carbons to CO2 requires the activity of PEPCK or malic enzyme to produce pyruvate. When these pathways are inactive, glutamine carbons cannot be converted into pyruvate and glutamine consumption must increase flux to cytosolic pools of citrate and aspartate, which are in turn used to synthesize nucleosides, proteins, lipids, and cholesterol1, 28. Although this evidence for glutamine being utilized primarily for biosynthesis is indirect, this phenomenon has been observed previously in multiple cell lines1–2. This observation does not indicate that ras-transformed fibroblasts cannot use glutamine for energy production, only that they are not doing so under these conditions. Similar rates of glutamine consumption in small and large spheroids (Figure 2D) and the absence of any labeling differences (Figure 5) suggests that rates of biosynthesis are similar in both spheroid sizes.
Conclusions
Using gas chromatography – mass spectrometry we have determined whether 13 critical metabolic pathways are active or inactive (Table 1). GC-MS is a powerful technique because it requires considerably less cell material (100-fold less spheroids) to obtain measurable results compared to alternate techniques, i.e. NMR. The most significant results were that 1) cells actively synthesize serine, cysteine, alanine, aspartate, glutamate, and proline; 2) cells do not synthesize glutamine; 3) glutaminolysis was active; and 4) malic enzyme and gluconeogenesis were inactive. The activities of these pathways suggest that cancer cells consume glutamine for biosynthesis and not to provide cellular energy. Determining which pathways are active under physiological meaningful conditions is useful because it indicates how cells direct carbon flow, and because it may lead to the discovery of molecular targets that could act as anti-cancer therapeutics.
References
- 1.Forbes NS, Meadows AL, Clark DS, Blanch HW. Estradiol stimulates the biosynthetic pathways of breast cancer cells: detection by metabolic flux analysis. Metabolic engineering. 2006;8(6):639–652. doi: 10.1016/j.ymben.2006.06.005. [DOI] [PubMed] [Google Scholar]
- 2.Kim BJ, Forbes NS. Flux analysis shows that hypoxia-inducible-factor-1-alpha minimally affects intracellular metabolism in tumor spheroids. Biotechnology and bioengineering. 2007;96(6):1167–1182. doi: 10.1002/bit.21205. [DOI] [PubMed] [Google Scholar]
- 3.Boren J, Montoya AR, de Atauri P, Comin-Anduix B, Cortes A, Centelles JJ, Frederiks WM, Van Noorden CJ, Cascante M. Metabolic control analysis aimed at the ribose synthesis pathways of tumor cells: a new strategy for antitumor drug development. Mol Biol Rep. 2002;29(1–2):7–12. doi: 10.1023/a:1020333730485. [DOI] [PubMed] [Google Scholar]
- 4.Medina MA. Glutamine and cancer. J Nutr. 2001;131(9 Suppl):2539S–2542S. doi: 10.1093/jn/131.9.2539S. discussion 2550S-1S. [DOI] [PubMed] [Google Scholar]
- 5.Medina MA, Sanchez-Jimenez F, Marquez J, Rodriguez Quesada A, Nunez de Castro I. Relevance of glutamine metabolism to tumor cell growth. Mol Cell Biochem. 1992;113(1):1–15. doi: 10.1007/BF00230880. [DOI] [PubMed] [Google Scholar]
- 6.Lobo C, Ruiz-Bellido MA, Aledo JC, Marquez J, Nunez De Castro I, Alonso FJ. Inhibition of glutaminase expression by antisense mRNA decreases growth and tumourigenicity of tumour cells. Biochem J. 2000;348(Pt 2):257–261. [PMC free article] [PubMed] [Google Scholar]
- 7.Boros LG, Brandes JL, Yusuf FI, Cascante M, Williams RD, Schirmer WJ. Inhibition of the oxidative and nonoxidative pentose phosphate pathways by somatostatin: a possible mechanism of antitumor action. Med Hypotheses. 1998;50(6):501–506. doi: 10.1016/s0306-9877(98)90271-7. [DOI] [PubMed] [Google Scholar]
- 8.Cameron Smith M, Orlando C, Serio M, Maggi M. Somatostatin receptors and breast cancer. J Endocrinol Invest. 2003;26(8 Suppl):125–130. [PubMed] [Google Scholar]
- 9.Boros LG, Puigjaner J, Cascante M, Lee WN, Brandes JL, Bassilian S, Yusuf FI, Williams RD, Muscarella P, Melvin WS, Schirmer WJ. Oxythiamine and dehydroepiandrosterone inhibit the nonoxidative synthesis of ribose and tumor cell proliferation. Cancer Res. 1997;57(19):4242–4248. [PubMed] [Google Scholar]
- 10.Boros LG, Cascante M, Lee WN. Metabolic profiling of cell growth and death in cancer: applications in drug discovery. Drug Discov Today. 2002;7(6):364–372. doi: 10.1016/s1359-6446(02)02179-7. [DOI] [PubMed] [Google Scholar]
- 11.Lora J, Alonso FJ, Segura JA, Lobo C, Marquez J, Mates JM. Antisense glutaminase inhibition decreases glutathione antioxidant capacity and increases apoptosis in Ehrlich ascitic tumour cells. Eur J Biochem. 2004;271(21):4298–4306. doi: 10.1111/j.1432-1033.2004.04370.x. [DOI] [PubMed] [Google Scholar]
- 12.Kim BJ, Forbes NS. Single-cell analysis demonstrates how nutrient deprivation creates apoptotic and quiescent cell populations in tumor cylindroids. Biotechnology and bioengineering. 2008;101(4):797–810. doi: 10.1002/bit.21985. [DOI] [PMC free article] [PubMed] [Google Scholar]
- 13.Sutherland RM. Cell and environment interactions in tumor microregions: the multicell spheroid model. Science. 1988;240(4849):177–184. doi: 10.1126/science.2451290. [DOI] [PubMed] [Google Scholar]
- 14.Vaupel P, Kallinowski F, Okunieff P. Blood flow, oxygen and nutrient supply, and metabolic microenvironment of human tumors: a review. Cancer Res. 1989;49(23):6449–6465. [PubMed] [Google Scholar]
- 15.Jain RK. The next frontier of molecular medicine: delivery of therapeutics. Nat Med. 1998;4(6):655–657. doi: 10.1038/nm0698-655. [DOI] [PubMed] [Google Scholar]
- 16.Klapa MI, Aon JC, Stephanopoulos G. Systematic quantification of complex metabolic flux networks using stable isotopes and mass spectrometry. European journal of biochemistry / FEBS. 2003;270(17):3525–3542. doi: 10.1046/j.1432-1033.2003.03732.x. [DOI] [PubMed] [Google Scholar]
- 17.Klapa MI, Aon JC, Stephanopoulos G. Ion-trap mass spectrometry used in combination with gas chromatography for high-resolution metabolic flux determination. BioTechniques. 2003;34(4):832–836. doi: 10.2144/03344pt02. 838, 840 passim. [DOI] [PubMed] [Google Scholar]
- 18.Sriram G, Rahib L, He JS, Campos AE, Parr LS, Liao JC, Dipple KM. Global metabolic effects of glycerol kinase overexpression in rat hepatoma cells. Mol. Genet. Metab. 2008;93(2):145–159. doi: 10.1016/j.ymgme.2007.09.008. [DOI] [PMC free article] [PubMed] [Google Scholar]
- 19.Hofmann U, Maier K, Nicbel A, Vacun G, Reuss M, Mauch K. Identification of metabolic fluxes in hepatic cells from transient C-13-labeling experiments: Part I. Experimental observations. Biotechnology and bioengineering. 2008;100(2):344–354. doi: 10.1002/bit.21747. [DOI] [PubMed] [Google Scholar]
- 20.Vogt JA, Yarmush DM, Yu YM, Zupke C, Fischman AJ, Tompkins RG, Burke JF. TCA cycle flux estimates from NMR- and GC-MS-determined [C-13]glutamate isotopomers in liver. Am. J. Physiol.-Cell Physiol. 1997;272(6):C2049–C2062. doi: 10.1152/ajpcell.1997.272.6.C2049. [DOI] [PubMed] [Google Scholar]
- 21.Des Rosiers C, Lloyd S, Comte B, Chatham JC. A critical perspective of the use of C-13-isotopomer analysis by GCMS and NMR as applied to cardiac metabolism. Metabolic engineering. 2004;6(1):44–58. doi: 10.1016/j.ymben.2003.10.004. [DOI] [PubMed] [Google Scholar]
- 22.Kanamori K, Kondrat RW, Ross BD. C-13 enrichment of extracellular neurotransmitter glutamate in rat brain - Combined mass spectrometry and NMR studies of neurotransmitter turnover and uptake into glia in vivo. Cell. Mol. Biol. 2003;49(5):819–836. [PubMed] [Google Scholar]
- 23.Ryan HE, Poloni M, McNulty W, Elson D, Gassmann M, Arbeit JM, Johnson RS. Hypoxia-inducible factor-1alpha is a positive factor in solid tumor growth. Cancer Res. 2000;60(15):4010–4015. [PubMed] [Google Scholar]
- 24.Christensen B, Nielsen J. Isotopomer analysis using GC-MS. Metabolic engineering. 1999;1(4):282–290. doi: 10.1006/mben.1999.0117. [DOI] [PubMed] [Google Scholar]
- 25.Kitson FG, Larsen BS, McEwen CN. Gas Chromatography and Mass Spectrometry: A Practical Guide. San Diego: Academic Press; 1996. [Google Scholar]
- 26.Portais JC, Schuster R, Merle M, Canioni P. Metabolic Flux Determination in C6 Glioma Cells Using Carbon-13 Distribution Upon [1-C-13]Glucose Incubation. European Journal of Biochemistry. 1993;217(1):457–468. doi: 10.1111/j.1432-1033.1993.tb18265.x. [DOI] [PubMed] [Google Scholar]
- 27.Sharfstein ST, Tucker SN, Mancuso A, Blanch HW, Clark DS. Quantitative in vivo nuclear magnetic resonance studies of hybridoma metabolism. Biotechnology and bioengineering. 1994;43(11):1059–1074. doi: 10.1002/bit.260431109. [DOI] [PubMed] [Google Scholar]
- 28.Forbes NS, Clark DS, Blanch HW. Analysis of metabolic fluxes in mammalian cells. In: Schügerl K, Bellgardt KH, editors. Bioreaction Engineering: Modeling and Control. Chap 4.4. Berlin: Springer Verlag; 2000. [Google Scholar]


