Abstract
Enzyme-sensitive hydrogels are promising for cell encapsulation and tissue engineering, but result in complex spatiotemporal degradation behavior that is characteristic of reaction-diffusion mechanisms. An experimental and theoretical approach is presented to identify dimensionless quantities that serve as a design tool for engineering enzyme-sensitive hydrogels with controlled degradation patterns by tuning the initial hydrogel properties and enzyme kinetics.
Keywords: hydrogel, enzyme degradation, reaction-diffusion, tissue engineering, computational models
Graphical Abstract
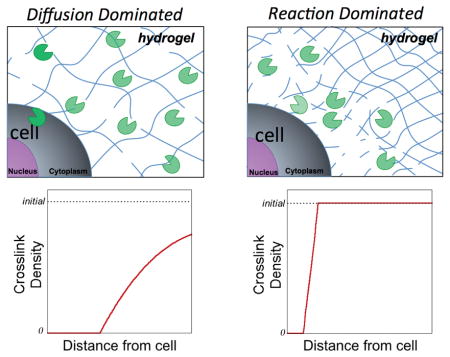
Synthetic-based hydrogels containing peptide crosslinks that degrade by cell-mediated mechanisms are promising platforms for cell encapsulation and tissue regeneration. To date, there has been significant progress towards demonstrating the feasibility of this type of hydrogel platform for a wide range of tissue engineering applications.[1,2,3] However, selecting a hydrogel design a priori to achieve desired hydrogel properties that evolve in space and time is challenging. Soft hydrogels (e.g., ≤ 1 kPa) are often employed such that a relatively low enzyme concentration is required to locally cleave the hydrogel crosslinks.[1,4] However, in a low crosslinked hydrogel, enzymes can readily diffuse leading to a combination of local and bulk degradation of the hydrogel, resulting in un-predictable changes in the hydrogel’s macroscopic properties (e.g., transport and mechanics). Controlling the macroscopic properties of the hydrogel is particularly important given that cells sense and respond to their extracellular environment, which can influence their phenotype and function.[5] In addition, successful translation of these materials in vivo will require control over the hydrogel properties to enable, for example, continuous mechanical integrity while simultaneously supporting tissue development. Given the promise of enzyme-sensitive hydrogels for cell encapsulation, a better understanding of their degradation behavior and the key parameters that control local and bulk degradation is needed.
Designing such a hydrogel whose crosslinks are sensitive to cell-secreted enzymes presents a design challenge that is characteristic of classic reaction-diffusion systems. Enzymes are synthesized by embedded cells, released on their boundary and later transported into the extracellular space. On the one hand, enzyme diffusion through the hydrogel is dictated by the relative size of the enzyme compared to that of the polymer mesh. On the other hand, enzymes react with their substrate (i.e., the hydrogel) and as crosslinks are cleaved, hydrogel degradation proceeds. A competition therefore exists between the characteristic times of enzyme diffusion and enzyme reaction with its substrate. If the former dominates, enzymes will readily diffuse through the hydrogel and degradation will be characteristic of a bulk degrading hydrogel. If the latter dominates, enzymes react immediately with their substrate leading to a highly localized degradation in the immediate vicinity of the cell with minimal bulk degradation. Understanding how design parameters influence this competition will thus be critical to tuning and controlling the dynamics of hydrogel degradation.
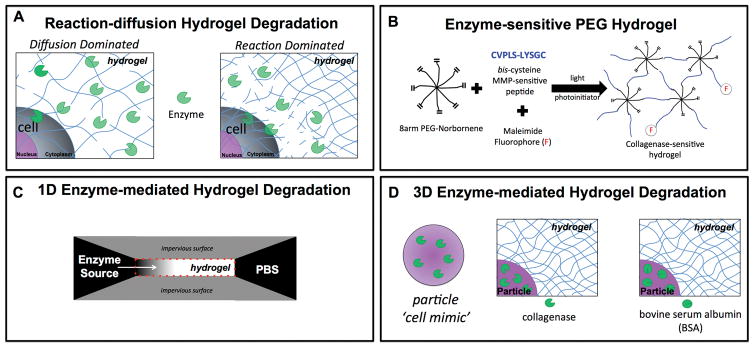
Herein, we introduce a combined experimental and theoretical approach to identify key design parameters that control reaction-diffusion degradation mechanisms in an enzyme sensitive hydrogel that is being degraded by embedded cells (Scheme 1A). We employed a multi-phasic mixture model that we have previously developed and applied to poly(ethylene glycol) (PEG) hydrogels.[6,7] We investigated a hydrogel platform based on a thiol-norbornene PEG hydrogel system with peptide crosslinks comprised of the collagenase-sensitive peptide VPLS-LYSG (Scheme 1B).[8] The enzyme that was used in this study was a commercially available collagenase blend. We first calibrated and validated our model with a simple one-dimensional (1D) experimental system (Scheme 1C) and then applied it to a more complex three-dimensional (3D) experimental hydrogel system mimicking enzyme-releasing cells (Scheme 1D). The governing equations in the mathematical model are given in Equations S1–S8 in the Supplemental Information. Once calibrated and validated, the model was non-dimensionalized to identify key dimensionless quantities whose magnitude can describe the role of enzyme (e.g., size), hydrogel (e.g., initial crosslink density), and kinetics of the enzyme-substrate pair (i.e., Michaelis-Menten) on the complex behavior of hydrogel degradation in time and space. The new dimensionless quantities can then serve as a guide for predicting and ultimately tuning the spatiotemporal hydrogel degradation behavior for a given application.
Scheme 1.
A) Schematic (left) represents diffusion-dominated hydrogel degradation where enzymes readily diffuse away from the encapsulated cell while simultaneously cleaving the crosslinks. Schematic (right) represents reaction-dominated hydrogel degradation where enzyme diffusion is restricted and/or enzymes are highly reactive to their substrate leading to hydrogel degradation immediately surrounding the encapsulated cell, leaving the bulk hydrogel in its original state. B) Schematic of the enzyme-sensitive poly(ethylene glycol) (PEG) hydrogel used in the study, which is fabricated by photopolymerization of an 8 arm PEG functionalized with norbornene and a bis-cysteine peptide that is sensitive to collagenases. The hydrogel was fluorescently labeled by introducing a maleimide fluorophore, which reacts with pendant thiols. C) Schematic of the 1D experimental system for studying enzyme-mediated hydrogel degradation. D) Schematic of the 3D experimental system for studying enzyme-mediated hydrogel degrdation whereby enzyme-loaded microparticles serve as cell-mimetics, which release enzymes with time but are not complicated by deposition of extracellular matrix.
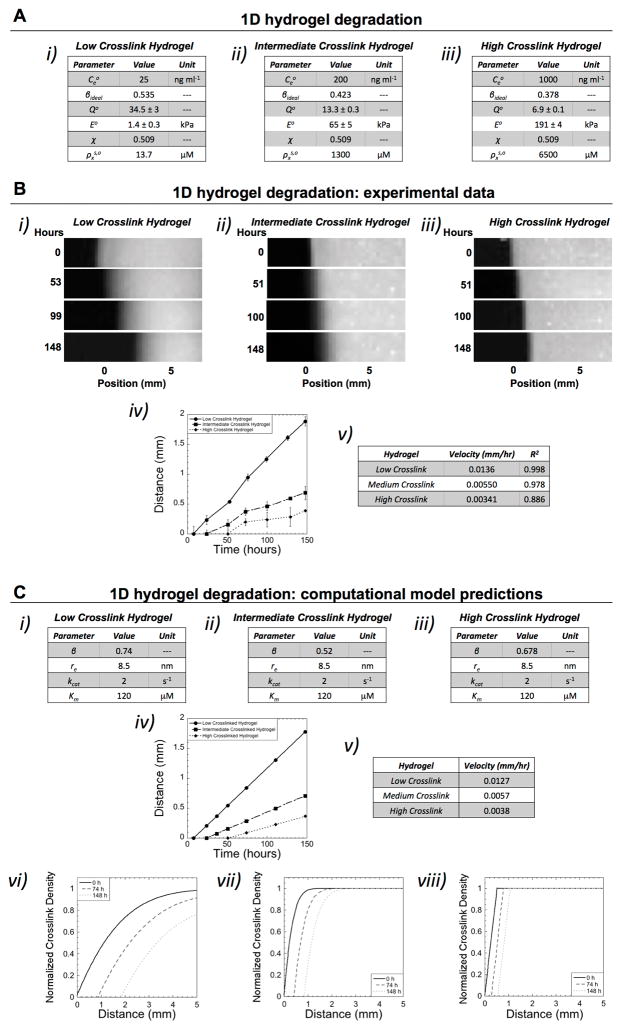
We first applied the 1D experimental set-up (Scheme 1C) to study degradation of enzyme-sensitive PEG hydrogels where the initial hydrogel crosslink density and enzyme concentration were varied (Figure 1A). The PEG hydrogel was labeled with a fluorescent molecule (as shown in Scheme 1B) to monitor changes to the hydrogel over time and in particular to identify the point when the hydrogel reaches reverse gelation. Reverse gelation refers to the point when a critical number of crosslinks have been cleaved and the hydrogel transitions from a crosslinked solid polymer (i.e., fluorescent regions) to a soluble polymer where the polymer chains rapidly diffuse out into the bath (i.e., non-fluorescent regions). This critical point is correlated to the degree of network connectivity during hydrogel formation (i.e., the gel point), which has been described for an ideal network using a statistical network formation model (Equation S2).[9] Experimentally, we observe a degradation front where the region of the hydrogel adjacent to the enzyme source is completely degraded, which advances along the length of the hydrogel, away from the enzyme source over time. By measuring the distance of the front as a function of time, front velocities were determined for each hydrogel system (Figure 1B). The hydrogel with the fewest crosslinks that must be cleaved to reach reverse gelation (i.e., low crosslink hydrogel) exhibited the fastest front velocity (Figure 1B i, iv, and v). On the other hand, the hydrogel with the most number of crosslinks that must be cleaved to reach reverse gelation exhibited the slowest front velocity (Figure 1B iii, iv, and v). Although the enzyme concentration was higher with increasing initial crosslinking, the enzyme concentration was not sufficient to overcome the higher number of crosslinks that had to be cleaved to reach velocities similar to the low crosslink hydrogel.
Figure 1.
Characterization of hydrogel degradation in 1D. A) Three hydrogels with differing enzyme concentrations were investigated with their properties of: enzyme concentration ( ), which was maintained throughout the experiment, network connectivity (β), initial volumetric swelling ratio (Qo), initial compressive modulus (Eo), polymer-solvent interaction parameter (χ), and initial crosslink density in the swelling solvent (i.e., phosphate buffered saline) ( ).B) Using the experimental set-up described in Scheme 1C, fluorescent images are shown for each hydrogel case as a function of time whereby position ‘0 mm’ indicates the initial edge of the hydrogel prior to degradation (i–iii). The enzyme source is located to the left of the hydrogel. The front, corresponding to reverse gelation, can be observed advancing away from the initial position (i.e., 0 mm) of the hydrogel over time. The velocity of the front was determined by plotting distance of the front as a function of time and using a linear fit (n=3, data are mean with standard deviation as error bars) (iv–v). B) The mathematical model was fit to the experimental data by varying network connectivity (β), radius of active enzyme (re), and the Michaelis-Menten kinetic constants (kcat and Km), which are unknowns (i–iii). The propagating front (distance versus time) and the corresponding velocity are shown for each hydrogel case (iv–v). In addition, spatiotemporal pattern of crosslink density as a function of distance away from the enzyme source are shown for each crosslink hydrogel case for the initial time prior to degradation and after 74 and 148 hours (vi–viii). The initial variation in crosslink density was determined from the experimental system (at time 0), which arises from unconfined swelling at the edges of the hydrogel.
The computational model was fit to the experimental front velocity data (Figure 1C vi-v) by varying enzyme radius, hydrogel connectivity, and reaction kinetics with realistic constraints (see Supplemental Information). Initial values for hydrogel, based on experimentally determined equilibrium swelling ratio and compressive modulus, were used as inputs to the model to estimate the initial crosslink density in a non-solvent using Flory-Rehner and Rubber elasticity theory[10] and a recently developed self-learning algorithm to estimate the polymer-solvent interaction parameter.[7] The computational model was able to capture the experimental front velocity using an average enzyme radius of 8.5 nm and values for the Michaelis-Menten kinetic constants, kcat with a value of 2 s−1 and Km with a value of 120 μM, which were used for all hydrogel crosslink cases. The value for network connectivity (β) was varied independently for each hydrogel case (Figure 1C i–iii) and assumed to be higher than the ideal value of β (Figure 1A i–iii) due to crosslinking imperfections (e.g., cyclization and dangling ends). Overall, we demonstrate that the computational model is able to capture the experimentally determined front velocities for each of the hydrogel cases.
In addition to front velocity, a second characteristic feature of the spatiotemporal degradation behavior of these hydrogels is the width of the front. The width of the front is defined as the distance from the point of reverse gelation (i.e., ρx = 0) near the enzyme source to the point where the gel is at its initial crosslink density (i.e., ). In the case where reaction dominates diffusion, the width of the front is narrow and the crosslink density of the bulk hydrogel is similar to the initial crosslink density prior to degradation. On the contrary, when diffusion dominates reaction, the width of the front becomes very large. For gels of finite thickness, this condition results in an overall decrease in crosslink density of the bulk hydrogel (i.e., bulk degradation). Using the same parameters identified for the simulations that match front velocity, the model was used to describe crosslink density as a function of distance away from the enzyme source over time (Figure 1C vi–viii). In the low crosslinked hydrogel case, a wide front that propagates quickly is observed resulting in an overall decrease in the crosslink density of the bulk hydrogel for finite distances (e.g., at 5 mm) (Figure 1C vi). In the intermediate and high crosslink hydrogel cases, a sharp front is observed and the initial bulk hydrogel properties are largely maintained (Figure 1C vii–viii). We demonstrate that the model is able to capture the propagating front and front width, especially for the intermediate and high crosslink hydrogel cases (Figure S4). However due to limitations in the experimental set-up, the fluorescence in the low crosslinked hydrogel does not directly correlate to crosslink density and therefore the front width could not be matched to the model (see Supplemental Information and Figure S4). Nonetheless, the model can be used to describe the spatiotemporal changes in crosslink density for each of the three hydrogel cases.
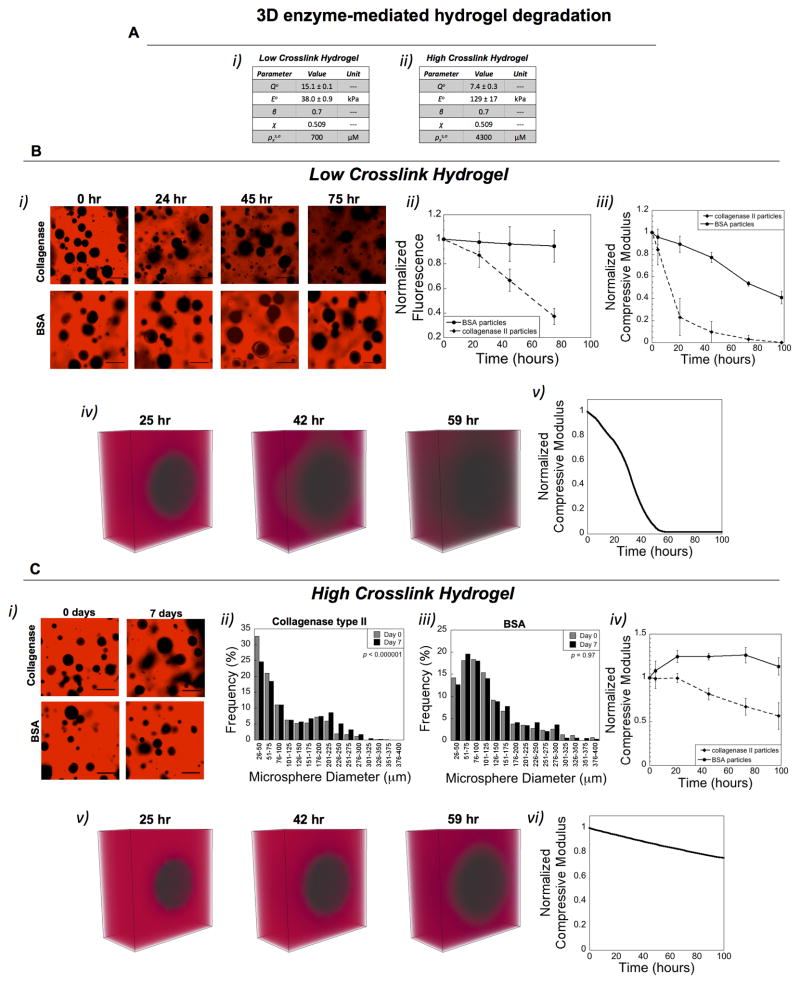
We next extended the experimental and computational analysis to 3D, using a low and high crosslinked hydrogel with formulations given in Table S1 and initial properties in Figure 2A. Experimentally, we developed a ‘cell-mimetic’ platform (Scheme 1C) using collagenase-loaded PLGA microparticles encapsulated in the enzyme-sensitive PEG hydrogel. Prior to encapsulation, release of collagenase from the microparticles was characterized by a rapid burst release followed by a slow yet sustained release of enzyme (Figure S5). This release profile, as a function of time, was input into the computational model to demonstrate the model’s capability of incorporating complex enzyme release profiles. Hydrogels were encapsulated with either collagenase-loaded microparticles or BSA-loaded microparticles and the spatiotemporal degradation behavior and macroscopic properties were evaluated over time. In the low crosslinked hydrogel, bulk degradation was evident by a rapid and overall decrease in hydrogel fluorescence (Figure 2B i–ii). Further, the compressive modulus (Figure 2B iii) decreased exponentially while the hydrogel wet weights (Figure S6) increased over time, consistent with the occurrence of bulk degradation. Simulations showed similar findings with respect to a diffuse boundary surrounding the cell-mimetic and a rapid loss in the compressive modulus of the bulk hydrogel (Figure 2B iv–v). On the contrary in the high crosslink hydrogel, degradation appeared to be restricted more locally in the region immediately surrounding the cell-mimetic. This observation is supported by the following results: (a) the hydrogel fluorescence was largely maintained over time, but the size of the non-fluorescent regions (originally correlating to the microspheres, which exhibited a distribution of sizes) increased statistically with time (Figure 2C i–iii), (b) the compressive modulus decreased over time, but the change was gradual (Figure 2C iv), and (c) hydrogel wet weights were maintained over time (Figure S6). Simulations showed similar results with a relatively sharp boundary surrounding the cell-mimetic and a modulus that gradually decreased over time (Figure 2D v–vi). In addition, dual labeling of the hydrogel and enzyme qualitatively showed the spatiotemporal distribution of the hydrogel and enzyme over time, further supporting the above observations (Figure S7).
Figure 2.
Characterization of hydrogel degradation in 3D. A) Two hydrogels with the same microparticles were investigated with their properties of: initial volumetric swelling ratio (Qo), initial compressive modulus (Eo), polymer-solvent interaction parameter (χ), network connectivity (β) as determined by the model, and initial crosslink density in the swelling solvent (i.e., phosphate buffered saline) ( ). In experiments, the set-up described in Scheme 1D was used with a fluorescently labeled (red) hydrogel. In simulations, the enzyme radius and Michaelis-Menten kinetic constants determined in the 1D experiments were used and the hydrogel was labeled red. B) Degradation of the low crosslink hydrogel is shown by representative confocal microscopy images of the hydrogel with void spaces (i), which at 0 hr correspond to the microparticles. Over time, the overall fluorescence (ii) decreased as well as the compressive modulus (iii) for the hydrogel containing the collagenase-loaded microparticles. Hydrogels with BSA-loaded microparticles showed no change in overall fluorescence (ii) and a slow decrease in the compressive modulus (iii), corresponding to degradation of the microparticles. Simulation results matched experiments showing a diffuse front surrounding the microparticles (iv) and a rapid loss in the compressive modulus (v). C) Degradation of the high crosslink hydrogel is shown by representative confocal microscopy images of the hydrogel with void spaces (i), which at 0 hr correspond to the microparticles. Over time, the overall fluorescence was maintained, but the void spaces became significantly larger in the hydrogel containing the collagenase-loaded microparticles, as shown in the histogram plot (ii). Hydrogels with BSA-loaded microparticles showed no change in the size of the voids, as shown in the histogram plot (iii). Statistical analysis was performed using a non-parametric Kolmogorov-Smirnov test (α = 0.05, n=800–1300). The compressive modulus (iv) decreased slowly over time in the hydrogels with the collagenase-loaded microparticles, but no change was observed in the BSA-loaded microparticles. Simulation results matched experiments showing a relatively sharp front surrounding the microparticles with a slight loss in hydrogel crosslinking (v) and correspondingly a slow loss in the compressive modulus (v) over time.
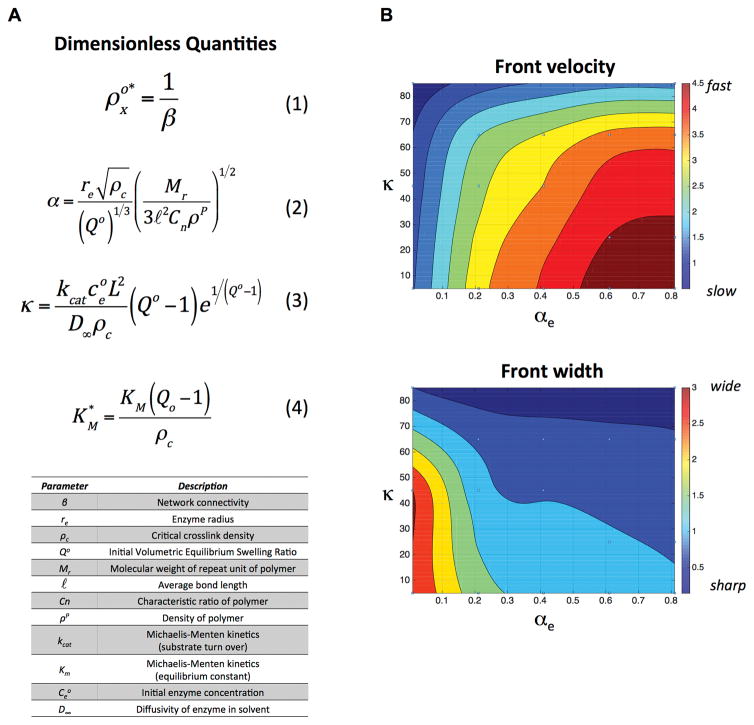
Overall, the 1D and 3D experimental and computational results point towards a degradation profile that is more characteristic of diffusion-dominated degradation in the low crosslinked hydrogel and more characteristic of reaction-dominated degradation in the high crosslinked hydrogels. Having verified the multi-phasic computational model with experimental results, we sought to identify dimensionless quantities that could be used to design hydrogels that are tuned to exhibit a desired reaction-diffusion degradation profile. To this end, we non-dimensionalized the governing equations in the model to extract a set of dimensionless quantities that describe the spatiotemporal patterns in degradation, specifically the front velocity and the width of the front. The derivation can be found in the Supplementary Information (Equations S9–S15). We identified four dimensionless quantities (Figure 3A) that are based on the properties of the polymer, initial hydrogel properties (e.g., equilibrium volumetric swelling ratio, Qo), the degree of network connectivity, the radius of the enzyme, and the Michaelis-Menten kinetics (i.e., kcat and Km).
Figure 3.
A) Dimensionless quantities identified by non-dimensionalizing the governing equations for diffusion (Fick’s second law) and reaction kinetics (Michaelis-Menten kinetics) for enzyme-sensitive hydrogels. These four quantities are based on initial hydrogel properties, enzyme characteristics, and enzyme-substrate kinetics. The parameters and their description are listed in the table. B) An example of contour plots for front velocity (in mm/hr) and front width (mm) as a function of κ and αe for the case with a β = 0.6, Km = 10 μM, and characteristic length of 2 mm.
The two dimensionless quantities that have the most significant effect on the spatiotemporal degradation pattern are αe and κ. On the one hand, the quantity, αe, is a measure of the relative enzyme radius to the mesh size of the hydrogel. Thus, the smaller the value of αe the more easily the enzyme can diffuse through the hydrogel. On the other hand, the quantity, κ, describes the competition between reaction and diffusion, relating kcat, enzyme concentration, diffusivity and crosslink density. Thus for high values of κ, reaction dominates diffusion and vice versa, for low values of κ, diffusion dominates reaction. We illustrate the effects of αe and κ on front velocity and front width for a given value of and (Figure 3B). In brief, the non-dimensionalized equations were solved for crosslink density as a function of time and distance (e.g., Figure 1C) for a range of values for αe (i.e., 0 to 0.8) and κ (i.e., 0 to 90). From these plots, a front velocity and front width were determined and the data combined to generate the contour plots shown in Figure 3B. For very high values of κ, the front is sharp (i.e., narrow front width) and the front velocities are high regardless of the size of the enzyme. This is expected since the reactivity of the enzyme to its substrate is high. As the value of κ becomes smaller, the width and speed of the front depend largely on the relative size of the enzyme to the hydrogel mesh. When the enzyme is small compared to the mesh size, the front speed is fast, but the front width is large (characteristic of the low crosslink density case in this study). On the contrary, when the enzyme is large and closer to the size of the hydrogel mesh, the front velocity slows, while the front becomes sharper (characteristic of the high crosslink density case). Increasing β, which indicates that fewer crosslinks must be cleaved to reach reverse gelation, leads to a shift to high magnitudes for front velocity and low magnitudes for front widths, but the overall shape of the contour plot remains. Finally, the quantity is significant only for cases where the crosslink density in the swelling solvent is of similar magnitude (or lower) than Km. This was true for the low crosslink density hydrogels using in the 1D experiment. Increasing Km (and hence ) slows the front velocity and widens the front width. However, for more tightly crosslinked hydrogels, has no effect on degradation.
Overall by tuning the initial hydrogel properties and the enzyme-substrate pair, it is possible to achieve a wide range of spatiotemporal degradation patterns. The governing equations are appropriate for any neutral hydrogel[11] and therefore the dimensionless quantities reported in Figure 3 can be broadly applied to hydrogel chemistries beyond those explored in this work. Furthermore with information regarding the enzyme radius, the concentration of enzyme released by the cell, and the Michaelis-Menten kinetics for the enzyme-substrate (i.e., crosslink) pair, one can select an initial hydrogel crosslink density to achieve the desired degradation behavior. In summary, the above set of dimensionless quantities can be used as a design tool for engineering enzyme-sensitive hydrogels with controlled degradation patterns of reaction-dominated, diffusion-dominated, or a combination of reaction and diffusion behaviors.
Experimental Section
Hydrogel synthesis and characterization
PEG hydrogels were formed by a photoclickable reaction between 8-arm PEG amine (MW 10k and 20k) that was functionalized with norbornene[3] and CVPLS-LYSGC in the presence of a photoinitiator (0.05 wt% Irgacure 2959) and 352 nm light at 6 mW cm−2 for 8 minutes. Hydrogels were formed with varying monomer concentration, monomer molecular weights, and thiol:ene ratios (Table S1). Hydrogels were characterized by equilibrium volumetric swelling ratio, Q, which was estimated from mass swelling rato and corresponding polymer and solvent densities. Compressive modulus was measured from the linear region of the stress-strain curve by compressing hydrogels at a rate of 10%/min to 15% strain (n = 3–4).
Cell-mimetics
PLGA microspheres were synthesized via a double emulsion technique[12] and loaded with protein encapsulants of BSA or collagenase type II. This process led to a distribution of particle sizes. Protein release in solution was quantified (NanoOrange protein quantification kit) over time in PBS at 37 °C in an infinite sink by continually replenishing with fresh PBS. Microparticles (50 mg/ml) were encapsulated in PEG hydrogels (5 mm diameter, 1 mm height) and their wet weights and compressive modulus assessed (n = 3–4).
Degradation experiments
The 1D and 3D experimental set-up is described in the Supplementary Information. Fluorescent hydrogels were prepared by introducing 0.01 mM AlexaFluor-546 C5 maleimide in the precursor solution prior to polymerization. In the 1D experiments, the hydrogels were allowed to equilibriate in PBS for 24 hours prior to being exposed to enzyme and is referred to as the 0 hr time point. At one side, the PBS bath was replaced with an enzyme bath, which was replaced daily to maintain a contant enzyme concentration. Fluorescence intensity of the degrading hydrogel was measured over time for each sample using an imaging system (BioRad VersaDoc 4000MP system). Fluorescence intensity at each time point was normalized to its maximum value for each condition and time point. In the 3D experiments for the low crosslink density hydrogels, total fluorescence was measured per image over time (n = 24 images per time point). For the high crosslink density hydrogels, void space diameters were measured (n = 800–1300 measurements per time point), and the non-parametric Kolmogorov-Smirnov test was used to determine changes in the void size distributions changed after 7 days (α = 0.05).
Simulations
The mathematical model of coupled enzyme diffusion and hydrogel degradation is described in the Supplementary Information. The dynamics of the hydrogel/enzyme system was investigated with a coupled system of partial differential equations consisting of a degenerate nonlinear diffusion equation for enzyme transport and a Michaelis-Menten degradation equation for the crosslink density. The model therefore captured the dependency of enzyme diffusion with hydrogel degradation and, conversely, the increase in hydrogel degradation with enzyme transport. Due to the strong nonlinearity of the system, we sought a numerical solution of these equations with a finite-element procedure relying on a Newton-Raphson approach and an implicit, backward-Euler algorithm for time integration. A convergence analysis of the method was performed for both the 1D and 3D analyses, which allowed us to select appropriate time step size and discretization that ensured maximum accuracy and low computational cost. Algorithms were written in Matlab.
Supplementary Material
Acknowledgments
SJB and FV acknowledge financial support from NIH 1R01AR065441.
Footnotes
Supporting Information is available from the Wiley Online Library or from the author.
Contributor Information
Dr. Stacey C. Skaalure, Department of Chemical and Biological Engineering.
Umut Akalp, Department of Mechanical Engineering.
Prof. Franck J. Vernerey, Department of Mechanical Engineering, Material Science and Engineering Program, University of Colorado, Boulder, CO 80309, USA
Prof. Stephanie J. Bryant, Department of Chemical and Biological Engineering, Material Science and Engineering Program, BioFrontiers Institute, University of Colorado, Boulder, CO 80303, USA
References
- 1.Lutolf MR, Weber FE, Schmoekel HG, Schense JC, Kohler T, Muller R, Hubbell JA. Nat Biotechnol. 2003;21:513. doi: 10.1038/nbt818. [DOI] [PubMed] [Google Scholar]
- 2.Bahney CS, Hsu CW, Yoo JU, West JL, Johnstone B. FASEB J. 2011;25:1486. doi: 10.1096/fj.10-165514. [DOI] [PMC free article] [PubMed] [Google Scholar]; Rice JJ, Martino MM, De Laporte L, Tortelli F, Briquez PS, Hubbell JA. Advanced Healthcare Materials. 2013;2:57. doi: 10.1002/adhm.201200197. [DOI] [PubMed] [Google Scholar]; Leight JL, Tokuda EY, Jones CE, Lin AJ, Anseth KS. Proc Natl Acad Sci U S A. 2015;112:5366. doi: 10.1073/pnas.1505662112. [DOI] [PMC free article] [PubMed] [Google Scholar]
- 3.Skaalure SC, Chu S, Bryant SJ. Advanced Healthcare Materials. 2015;4:420. doi: 10.1002/adhm.201400277. [DOI] [PMC free article] [PubMed] [Google Scholar]
- 4.Singh SP, Schwartz MP, Lee JY, Fairbanks BD, Anseth KS. Biomaterials Science. 2014;2:1024. doi: 10.1039/C4BM00022F. [DOI] [PMC free article] [PubMed] [Google Scholar]
- 5.Keung AJ, Kumar S, Schaffer DV. In: Annual Review of Cell and Developmental Biology. Schekman R, Goldstein L, Lehmann R, editors. Vol. 26. 2010. p. 533. [DOI] [PMC free article] [PubMed] [Google Scholar]; Rehfeldt F, Engler AJ, Eckhardt A, Ahmed F, Discher DE. Adv Drug Delivery Rev. 2007;59:1329. doi: 10.1016/j.addr.2007.08.007. [DOI] [PMC free article] [PubMed] [Google Scholar]; Bissell MJ, LaBarge MA. Cancer Cell. 2005;7:17. doi: 10.1016/j.ccr.2004.12.013. [DOI] [PMC free article] [PubMed] [Google Scholar]
- 6.Dhote V, Vernerey FJ. Biomech Model Mechanobiol. 2014;13:167. doi: 10.1007/s10237-013-0493-0. [DOI] [PMC free article] [PubMed] [Google Scholar]; Vernerey FJ, Greenwald EC, Bryant SJ. Comput Methods Biomech Biomed Engin. 2012;15:1197. doi: 10.1080/10255842.2011.585973. [DOI] [PMC free article] [PubMed] [Google Scholar]
- 7.Akalp U, Chu S, Skaalure SC, Bryant SJ, Doostan A, Vernerey FJ. Polymer (Guildf) 2015;66:135. doi: 10.1016/j.polymer.2015.04.030. [DOI] [PMC free article] [PubMed] [Google Scholar]
- 8.Fairbanks BD, Schwartz MP, Halevi AE, Nuttelman CR, Bowman CN, Anseth KS. Adv Mater (Weinheim, Ger) 2009;21:5005. doi: 10.1002/adma.200901808. [DOI] [PMC free article] [PubMed] [Google Scholar]; Amer LD, Holtzinger A, Keller G, Mahoney MJ, Bryant SJ. Acta Biomater. 2015 doi: 10.1016/j.actbio.2015.04.013. [DOI] [PMC free article] [PubMed] [Google Scholar]
- 9.Miller DR, Macosko CW. Macromolecules. 1976;9:206. doi: 10.1021/ma60050a003. [DOI] [PubMed] [Google Scholar]
- 10.Flory PJ, Rehner R., Jr J Chem Phys. 1943;11:521. [Google Scholar]
- 11.Peppas NA. Hydrogels in medicine and pharmacy. Vol. 1. CRC Press; Boca Raton, Fl: 1986. [Google Scholar]; Peppas NA, Hilt JZ, Khademhosseini A, Langer R. Adv Mater (Weinheim, Ger) 2006;18:1345. [Google Scholar]
- 12.Ashton RS, Banerjee A, Punyani S, Schaffer DV, Kane RS. Biomaterials. 2007;28:5518. doi: 10.1016/j.biomaterials.2007.08.038. [DOI] [PubMed] [Google Scholar]; Cohen S, Yoshioka T, Lucarelli M, Hwang LH, Langer R. Pharm Res. 1991;8:713. doi: 10.1023/a:1015841715384. [DOI] [PubMed] [Google Scholar]
Associated Data
This section collects any data citations, data availability statements, or supplementary materials included in this article.


