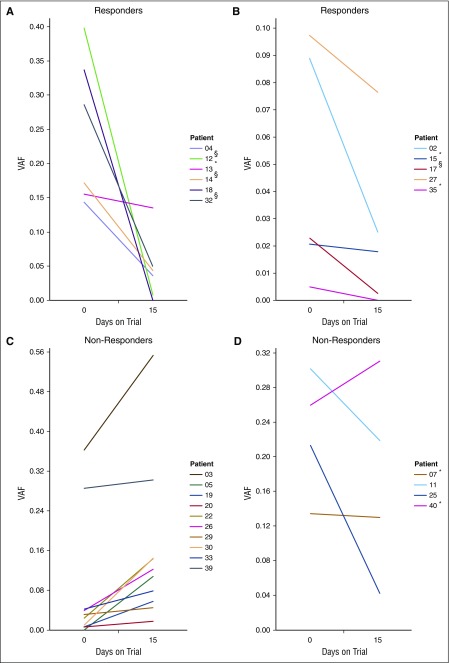
Figure 3.
Correlating treatment response with ctDNA fluctuations. Shown are the ctDNA levels in all patients with detectable ctDNA in at least 1 of 2 samples collected at day 0 (entry to trial) and day 15. Patients for whom the changes in ctDNA levels did not attain statistical significance between days 0 and 15 are marked with an asterisk (*). (A-B) ctDNA levels in patients who had responded to panobinostat at the first clinical assessment. Although not all differences achieved statistical significance (eg, patient 13), there was a consistent trend toward reduced ctDNA. (C-D) ctDNA levels for patients who did not respond to the drug, with patients showing a concordant trend of increasing ctDNA in (C), and those who did not in (D). §Patients showed initial response at the first assessment but were not considered responders as per the study protocol (<6 months CR or PR). Patient 39 had progressive disease for the duration of the trial.

