Abstract
BMI1 is a key component of the PRC1 complex (polycomb repressive complex-1) required for maintenance of normal and cancer stem cells. Its aberrant expression is detected in chronic myeloid leukemia and Ph+ acute lymphoblastic leukemia (ALL), but no data exist on BMI1 requirement in ALL cells.
We show here that BMI1 expression is important for proliferation and survival of Ph+ ALL cells and for leukemogenesis of Ph+ cells in vivo.
Levels of BIM, interferon-α (IFNα)-regulated genes, and E2F7 were upregulated in BMI1-silenced cells, suggesting that repressing their expression is important for BMI1 biological effects. Consistent with this hypothesis, we found that: i) downregulation of BIM or E2F7 abrogated apoptosis or rescued, in part, the reduced proliferation and colony formation of BMI1 silenced BV173 cells; ii) BIM/E2F7-double silencing further enhanced colony formation and in vivo leukemogenesis of BMI1-silenced cells; iii) overexpression of BIM and E2F7 mimicked the effect of BMI1 silencing in BV173 and SUP-B15 cells and iv) treatment with IFNα suppressed proliferation and colony formation of Ph+ ALL cells.
These studies indicate that the growth-promoting effects of BMI1 in Ph+ ALL cells depend on suppression of multiple pathways and support the use of IFNα in the therapy of Ph+ ALL.
Keywords: BMI1, Ph+ ALL, Leukemia, Bim, E2F7, IFNα
Introduction
p210 and p190BCR-ABL1 transform hematopoietic stem cells (HSCs) and/or committed lymphoid progenitors respectively, causing chronic myeloid leukemia (CML) and Ph+ ALL, two diseases markedly different in outcome and response to therapy (1). Transformation by BCR-ABL1 oncogenic proteins depends on their constitutive tyrosine kinase activity and rests on the ability to activate proliferative and survival signaling pathways essential for leukemogenesis such as RAS, PI-3K/AKT and STAT 5 (2–6). The tyrosine kinase activity of p190BCR-ABL1 is more potent than that of p210BCR-ABL1 (7); however, this does not explain the different outcome of CML and Ph+ ALL: 40–50% of Ph+ ALL patients express p210BCR-ABL1 and yet they may have slightly worse outcome of those expressing p190BCR-ABL1 (8,9). An explanation for the different clinical behavior of CML and Ph+ ALL may rest in the cell of origin of the disease as BCR-ABL1-transformed HSCs are less prone to secondary mutations than committed B-cell progenitors (5,10). Some, if not all, of the secondary mutations in Ph+ ALL may be caused by aberrant RAG-dependent recombination (i.e. deletion of IKAROS or the INK4A/ARF locus) and/or AID-dependent somatic hypermutation (mutation of BCL-6 or BCR-ABL1 itself) (11–13). Thus, inhibiting the BCR-ABL1 kinase is insufficient to eradicate most Ph+ ALL cell clones and alternative BCR-ABL1-dependent and independent pathways need to be targeted for an effective treatment of Ph+ ALL.
We recently found that the Polycomb group (PcG) family BMI1 gene (14) is required for the proliferation and colony formation of p190BCR-ABL1-transformed B cells (15).
The BMI1 protein functions as a key regulatory component of the PRC1 complex (16) and promotes the maintenance of normal and cancer stem cells (17–21). Aberrant expression of BMI1 is detected in several human malignancies (22), often correlating with metastatic disease and therapy failure (23–25).
Several findings support the importance of BMI1 in BCR-ABL1-positive leukemias, especially the lymphoid ones. First, BMI1 overexpression correlates with more advanced disease stages and with shorter time from CML-chronic phase to blast crisis (26, 27). Second, BMI1 collaborates with BCR-ABL1 in transformation of CD34 cord blood cells and these cells induce a transplantable leukemia in NOD/SCID mice with a predominant lymphoid immunophenotype (28). Third, ectopic expression of BMI1 in BCR-ABL1-transformed HSCs enhanced the frequency of B-ALL-initiating cells in vitro and in mice, although BCR-ABL1 activity was still required for disease maintenance (29).
The oncogenic effects of BMI1 depend, in part, on silencing of the INK4A/ARF (CDKN2A) tumor suppressor locus that encodes the p16 (INK4A) and p14 (alternative reading frame, ARF) proteins (30,31). However, BMI1 can also exert its oncogenic effects through CDKN2A-independent pathways (32,33), but the precise mechanism(s) by which BMI1 overexpression contributes to Ph+ ALL, especially in cases with deletion of the INK4A/ARF locus, have yet to be elucidated.
We show here that BMI1 is required for the proliferation, survival and maintenance of Ph+ ALL cells in vitro and in mice and that the effects are mediated, at least in part, through repression of BIM and E2F7 expression and downregulation of the interferon-α (IFNα)-response pathway.
Materials and Methods
Cell culture
Cell lines were tested for mycoplasma contamination (PCR Mycoplasma detection set, Takara Bio Inc., Japan) every 6 months. BV173 (CML- lymphoid blast crisis cell line) and SUP-B15 (Ph+ ALL cell line) cells were cultured in Iscove Modified Dulbecco’s Medium (Lonza Inc., Basel, Switzerland) supplemented with 10% heat-inactivated FBS, 1% penicillin- streptomycin, 1% L-glutamine, at 37°C, 5% CO2.
Primary Ph+ adult ALL (n=6) or CML-lymphoid blast crisis (n=1) cells derived from the peripheral blood (n=2) or the bone marrow (n=5) (average 77% blasts; range: 52–98%) were kindly provided by Dr Michael Caligiuri (Ohio State University, Columbus, OH) and Dr Martin Carroll (University of Pennsylvania, Philadelphia, PA) and were maintained in SFEM (Stem Cell Technology, Vancouver, Canada) supplemented with IL-3 (10 ng/ml), IL-7 (10 ng/ml), Flt3-L (20 ng/ml) and SCF (30 ng/ml) (ProSpec, Israel).
Short hairpin RNA plasmids and lentiviral infection
Control shRNA, shBMI1#1, shBMI1#2 (cloned into the inducible pLKO-Tet-On puromycin vector) and shBIM (cloned into the pLKO-Tet-On neomycin vector) were kindly provided by Dr. Jagani (34). shE2F7 (#1-4) lentiviral vectors were purchased from Applied Biological Materials (Richmond, Canada).
For lentiviral infections, infectious supernatant of 293T cells transiently transfected with the indicated plasmids was collected at 48 and 72 hours and used to infect BV173, SUP-B15 and primary Ph+ ALL/CML-lymphoid blast crisis cells. 24 hours later, cells were subjected to antibiotic selection for 5 (puromycin; 3μg/ml) or 14 (G418; 400 mg/ml) days.
BIM or E2F7 ectopic expression in BV173 or SUP-B15 cells
The human BIM coding sequence was obtained by PCR from cDNA of BV173 cells with the following primers: Fw 5′-GTACTCTAGAATGGCAAAGCAACCTTCTGA-3′, Rv 5′-TAGAGGATCCTCAATGCATTCTCCACACC-3′. The BIM sequence was then cloned in the GFP-pUltra plasmid (Addgene) at the XbaI and BamHI restriction enzyme sites.
The human E2F7 coding sequence was cloned from the mammalian Gene Collection p- pCR4-TOPO-Human E2F7 sequence-verified cDNA (MHS6278-213243493 glycerol stock from Dharmacon) by PCR using the following primers: Fw 5′-AGTCTCTAGAATGGAGGTAAATTGTTTAACACTAAAA-3′, Rv 5′-TACTGAATTCTTAGTCAGCGCCGCCG-3′. The E2F7 sequence was cloned in the GFP- pUltra plasmid at the XbaI and EcoRI restriction enzyme sites.
Three subsequent lentiviral infections were carried out as described above and 18 hours after the last infection, transduced cells were sorted based on GFP positivity and used for western blot and colony assays after 1–2 h recovery in fresh medium.
Cell proliferation, cell cycle analysis and colony formation assay
Proliferation of shRNA-transduced BV173 and SUP-B15 cells was assessed by seeding 5 × 10⁴ cells/ml with or without doxycycline (Doxy, 2.5μg/ml; Research Product International, Mt. Prospect, IL, USA) and with or without imatinib (IM) (1μM added every 12h) (LC Laboratories, Woburn, MA, USA) and counting the cells every 24h by trypan blue exclusion.
Cell cycle analyses were performed by propidium iodide staining and sub-G1 cells were considered apoptotic.
For colony-formation assays, Ph+ cell lines transduced with different lentiviral shRNAs or treated with IFNα were plated in methylcellulose (Stem Cell Technologies) with or without 2.5μg/ml Doxy (4 hours of pre-treatment in liquid culture and then added to the plates) and with or without imatinib (0.5–2μM). Colonies were counted 6 days later. Data shown represent the mean of technical triplicates of three independent experiments.
Ph+ ALL or CML-lymphoid blast crisis primary cells (lentivirus shRNA-transduced or drug-treated) were plated in methylcellulose supplemented with IL-3, IL-6, IL-7, Flt3-L, and SCF at the concentrations indicated above and colonies were counted 10 days later.
Animals
Six-to-seven week-old NOD/SCID/IL-2Rγnull mice (The Jackson Laboratory, Sacramento, CA, USA) were intravenously injected with parental, scramble, BMI1shRNA-transduced BV173 or SUP15 cells, or BMI1/BIM/E2F7shRNA-transduced BV173 cells (2×10⁶ cells/mouse). Mice injected with parental cells were left untreated, while those injected with shRNA-BV173 or -SUP-B15 cells were continuously treated, starting 72 hours post-injection, with Doxy (2g/L) in D(+)-sucrose-supplemented (30g/L) drinking water to induce BMI1 or BMI1 and BIM downregulation in vivo.
Experiments were performed according to Animal Care and Use Committee’s guidelines.
Sorting of leukemic cells from NSG mice
Leukemic mice were humanely euthanized and bone marrow cells were purified and stained with PE-anti-human CD10 Antibody (BD Pharmingen, Franklin Lakes, NJ, USA). Dead cells were excluded by DAPI staining and cells were then sorted based on PE positivity using a BD FACS Aria.
Real-time quantitative PCR analyses
For real-time quantitative PCR (qPCR), total RNA was isolated from BV173-sh scramble, BV173-shBMI1#1 cells using the RNeasy Plus Mini kit (Qiagen, Limburg, The Netherlands) and reverse-transcribed (2 μg) the High-Capacity cDNA Reverse Transcription Kit (ThermoFisher Scientific, Waltham, MA USA. First-strand cDNA was used as PCR template. Reactions were done in triplicate, and RNA extracted from 2 separate experiments.
Primers used were: IFI6 Fw: 5′-GGTGGAGGCAGGTAAGAAAAAG-3′; IFI6 Rv: 5′-GAGATAC TTGTGGGTGGCGT-3′; IFI44 Fw: 5′-AGGGAGTTGGTAAACGCTGG-3′; IFI44 Rv: 5′-TCCT CCCTTAGATTCCCTATTTGC-3′; IRF9 Fw: 5′-AGAAAGGGGCGGAGAGATCA-3′; IRF9 Rv: 5′-TGCCATCCTGAGTTGCTGTC-3′; OAS1 Fw: 5′-AACCCAGGCCTGTGATCCTG-3′; OAS1 Rv: 5′-GGATCGTCGGTCTCATCGTC-3′; IFIT1 Fw: 5′-TGGGCCTTGCTGAAGTGTGGA-3′; IFIT1 Rv: 5′-AGCCATCCAGGCGATAGGCAG-3′; IFIT3 Fw: 5′-CACAGACCTAACAGCACC CT-3′; IFIT3 Rv: 5′-GACCTCACTCATGATGGCTGTTTC-3′; E2F7 Fw: 5′-CAGAACCGAGCAGCCCGTA; E2F7 Rv: 5′-TGCTTGATGGAGGCACCACT-3′
Microarray Analysis
Total RNA was isolated from BV173 shBMI1#1 cells, untreated or treated with Doxy (2.5 μg/ml), purified with RNeasy Column (Qiagen) and used (5μg) to generate biotin-labeled cRNA using an oligo T7 primer in a reverse transcription reaction followed by in vitro transcription reaction with biotin labeled UTP and CTP. 10 μg of cRNA were fragmented and hybridized to HuGene 2.0 chip (Affymetrix, Santa Clara, CA). Hybridized arrays were stained according to the manufacturer’s protocols on a Fluidics Station 450 and scanned on an Affymetrix scanner 3000. Signal values were determined using the Gene Chip Operating System 1.0 (GCOS, Affymetrix). For identification of genes associated with specific biological processes, we used EPLtool, an automatic gene clustering tool developed by Wyeth Bioinformatics for Affymetrix qualifiers and Ingenuity Pathway Analysis (Qiagen).
Western Blotting
Antibodies used were: anti-BMI1 (ab38295, Abcam, Cambridge, MA, USA), anti BIM (H-191), anti β-ACTIN (C4), anti HSP90 (4F10) and anti-GRB2 (C23), all purchased from Santa Cruz Biotechnology (Dallas, TX, USA), and anti-E2F7 (ab56022, Abcam).
Statistical analyses
Data (means + SD, 3 experiments) were analyzed for statistical significance by unpaired, 2-tailed Student t test or by One way Anova. P < 0.05 was considered statistically significant. Kaplan-Meier plots for mice survival experiments were generated using Graphpad Prism software. Statistical significance of differences in survival of mice injected with control, BMI1-silenced, or BMI1/BIM/E2F-7-silenced BV173 cells was assessed by log rank test.
Results
Proliferation, survival and colony formation is markedly suppressed in BMI1-silenced Ph+ ALL cells
In a previous study (15), we showed that proliferation and colony formation of SUP-B15 and Z-181 Ph+ ALL cell lines, in which BMI1 expression was downregulated by BMI1 siRNAs, was markedly suppressed compared to scramble siRNA-transfected cells. To further assess the requirement of BMI1 expression in Ph+ ALL cells and to investigate the underlying mechanisms, we generated two cell lines (BV173 and SUP-B15) expressing doxycycline-inducible Bmi-1 shRNAs (#1 and #2) shown to inhibit Bmi-1 expression in multiple myeloma cells (34). In BV173 cells, BMI1 expression was markedly decreased after a 48h treatment with doxycycline and was almost undetectable at 72 or 96h (Supplementary Fig. 1A).
Downregulation of BMI1 expression induced a decrease of viable (trypan blue-negative) BV173 cells, especially evident after a 7-day doxycycline treatment (Supplementary Fig. 1B). DNA content analysis of BMI1-silenced cells revealed an increase of sub-G1, apoptotic cells and, especially in shBMI1#2 BV173 cells, a marked decrease of S and G2 phase cells (Supplementary Fig. 1C). The increase in apoptotic cells was especially evident after a 96h treatment with doxycycline, a time point at which BMI1 expression was essentially undetectable. The effect of BMI1 silencing was also assessed by methylcellulose colony formation assays; as shown in Supplementary Fig. 1D, BMI1-silenced BV173 cells were markedly less clonogenic than the doxycycline-treated controls.
Cell counts and colony formation of BMI1-silenced SUP-B15 cells were significantly decreased compared to controls (Supplementary Fig. 2A and B); however, the decrease in colony formation was less striking than in BV173 cells (Supplementary Fig. 1D), probably reflecting incomplete BMI1 downregulation (Supplementary Fig. 2C).
An increase in apoptotic cells was also noted in BMI1-silenced SUP-B15 cells Supplementary Fig. 2D); consistent with the results of all other assays, apoptosis was also lower than in BV173 cells.
We also tested if BMI1 silencing (Fig. 1A; example of BMI1 downregulation in sample ALL #674) suppressed colony formation of primary Ph+ ALL cells; for these experiments, primary Ph+ ALL cells were transduced with the doxycycline-inducible BMI1 ShRNA lentiviruses and plated in methylcellulose in the presence of puromycin alone or puromycin and doxycycline. Colonies were counted 10 days later. Colony formation of doxycycline-treated BMI1 shRNA-transduced cells was lower than that of the corresponding untreated cells (n=4) (Fig. 1B), in agreement with the effects in the Ph+ ALL cell lines.
Fig. 1. BMI1 downregulation inhibits colony formation of Ph+ ALL primary cells.
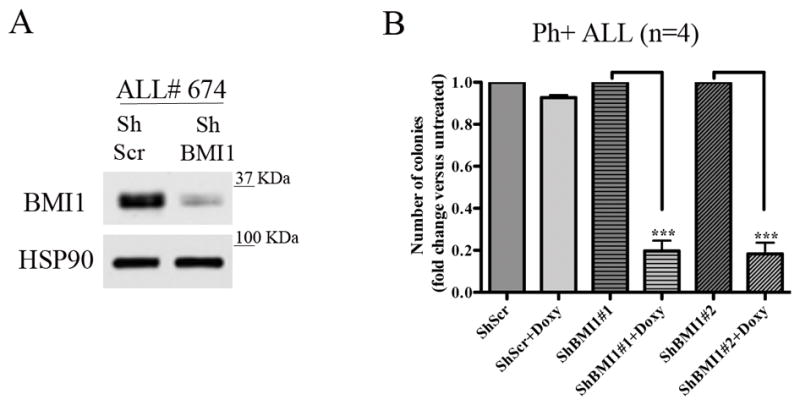
(A) BMI1 levels in ALL# 674 cells transduced with the shBMI1 #1 lentivirus; (B) methylcellulose colony formation (mean + SD of four independent experiments) of untreated or Doxy-treated (2.5μg/ml) parental, shBMI1#1- or shBMI1#2-transduced peripheral blood (n=2) or bone marrow (n=2) derived Ph+ ALL cells. Colonies were counted 10 days after seeding 4 × 10⁴ cells/plate.
Since imatinib treatment had no effect on the expression of BMI1 in BV173 cells (Fig 2A), we also assessed whether BMI1 silencing enhanced the inhibitory effect of imatinib on proliferation and colony formation of BV173 cells. Treatment with imatinib or with doxycycline markedly reduced the number of shBMI1#1 and #2-transduced BV173 cells compared to control cells especially after 7 days of treatment (Fig. 2B); however, co-treatment with imatinib and doxycycline further reduced the number of shBMI1#1 and #2 BV173 cells after 7 days of co-treatment (Fig. 2B).
Fig. 2. BMI1 silencing enhances imatinib-induced inhibition of cell proliferation and colony formation of BV173 cells.
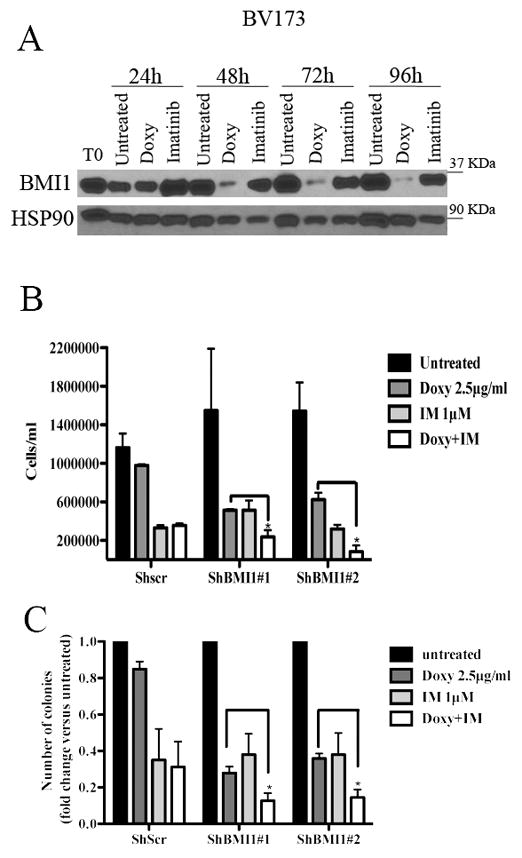
(A) Western blot shows BMI1 expression in imatinib (IM)- or Doxy-treated shBMI1 BV173 cells; (B) cell counts at 168h post treatment or (C) colony formation of untreated shBMI1 BV173 cells or cells treated with Doxy (2.5μg/ml), IM (1μM), or the Doxy/IM combination. Data represent the mean + SD of three independent experiments. Statistical analysis: one way Anova with Bonferroni’s correction. *<0.05.
Likewise, co-treatment with imatinib and Doxy was more inhibitory than either treatment on colony formation of shBMI1#1 or #2 BV173 cells (Fig. 2C). Same effects were observed in shBMI1 SUP-B15 cells (Supplementary Fig. 3), suggesting that imatinib treatment and BMI1 silencing suppress proliferation of BV173 and SUP-B15 cells through non-overlapping pathways.
BMI1 silencing suppresses in vivo growth of BV173 and SUP-B15 cells
To determine whether BMI1 expression is also necessary for in vivo growth of BV173 and SUP-B15 cells, NOD/SCID/IL-2Rγnull (NSG) mice were intravenously injected with parental, scramble or shBMI1-transduced BV173 cells (2 × 10⁶ cells/mouse) or with shBmi-1-transduced SUP-B15 cells. Mice injected with parental cells were left untreated, while those injected with scramble or shBMI1-BV173 cells were continuously treated, starting 72 hours post-injection, with Doxy in the drinking water to induce BMI1 downregulation in vivo. Mice injected with parental or shscramble BV173 cells (n=10; 5 mice/group) were all dead after 65 days and there was no difference in the survival of untreated and Doxy-treated mice (Fig. 3A); by contrast, mice injected with shBMI1 (#1 or #2) BV173 cells and treated with doxycycline (n=14; 7 mice/group) survived much longer (approximately 128 days) (P<0.0001) than the control mice (Fig. 3A), indicating that BMI1-regulated pathways are required for in vivo growth of BV173 cells. To assess whether death of the mice was due to the outgrowth of leukemic cells in which BMI1 expression was no longer silenced, terminally ill mice (n=3) injected with scramble or shBMI1 BV173 cells and continuously treated with doxycycline were sacrificed and CD10+ (BV173) cells were isolated from the bone marrow and lysed to assess BMI1 levels. Anti-BMI1 western blotting of CD10+ cell lysates revealed that BMI1 expression remained silenced upon doxycycline treatment of mice injected with shBMI1 BV173 cells (Fig. 3B), suggesting that, by itself, BMI1 silencing can slow down but not suppress entirely the process of leukemia.
Fig. 3. BMI1 inhibition suppresses growth of BV173 or SUP-B15 cells in NSG mice.
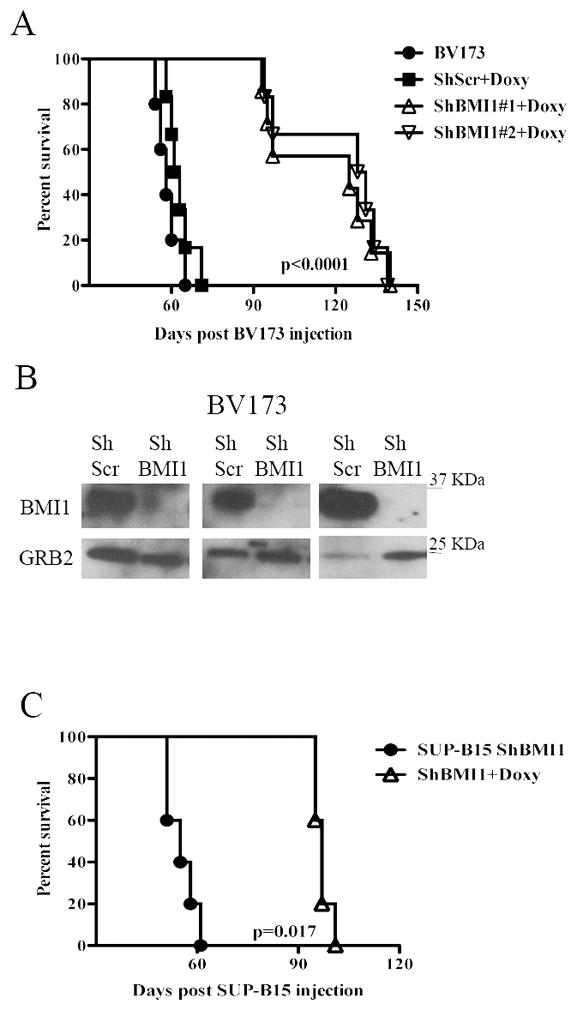
(A, C) Kaplan-Meier plots show survival of NSG mice injected with 2×10⁶ parental, scramble, or shBMI1 silenced (shBMI1 #1 and #2) BV173 (A) or SUP-B15 (C) cells. Mice injected with parental cells were left untreated while those injected with scramble, shBMI1 #1 and #2 BV173 cells or shBMI1 SUP-B15 cells were continuously treated with Doxy in the drinking water (2 g/L) starting three days post-cell injection. (B) Expression of BMI1 in CD10-cALLA+ cells sorted from the bone marrow of 3 leukemic NSG mice injected with shScr BV173 (ShScr) or with shBmi-1 BV173 cells (ShBmi-1). GRB2 expression was used as loading control.
The effect of BMI1 silencing for in vivo leukemogenesis was also assessed in NSG mice injected with shBMI1 SUP-B15 cells. In this model, the five mice left untreated were all dead after 61 days; by contrast, the Doxy-treated mice (n=5) survived much longer (mean survival of 97 days) (P=0.0017) (Fig. 3C). Persistence of BMI1 downregulation was also noted in CD19+ cells isolated from a terminally ill doxycycline-treated mouse injected with SUP-B15 cells (data not shown).
Downregulation of BIM expression rescues apoptosis but not the impaired colony formation of BMI1-silenced BV173 cells
The CDKN2A locus, which is a target of BMI1-dependent repression, is deleted in the Ph+ ALL cell lines used in this study (35) which do not express p16INK4A or p14ARF (not shown). Thus, the growth-inhibitory effects of BMI1 silencing in BV173 cells are INK4A/ARF-independent. Previous studies in BMI1-silenced myeloma lines showed that expression of pro-apoptotic BIM is upregulated and that inhibition of BIM expression rescued, in part, the enhanced apoptosis of these cells (34). Thus, we assessed BMI1-dependent expression and requirement of BIM in BV173 cells; as shown in Fig. 4A, expression of BIM was upregulated in BMI1-silenced BV173. Thus, BV173 cells were transduced with three doxycycline-inducible BIM shRNA lentiviruses and selected in the presence of G418; western blot analysis of Doxy-treated cells revealed that BIM expression was downregulated only in cells transduced with the BIM shRNA#1 lentivirus (Supplementary Fig 4A). Proliferation and colony formation assays of double-silenced BMI1/BIM BV173 cells showed that cell numbers and methylcellulose colonies were identical to those of BMI1-silenced cells (Fig. 4B and 4C) or BMI1-silenced/scramble-transduced cells (not shown), indicating that enhanced expression of BIM alone cannot explain the impaired growth of BMI1-silenced BV173 cells.
Fig. 4. BIM silencing rescues apoptosis but not the BMI1-mediated inhibition of cell proliferation and colony formation of BV173 cells.
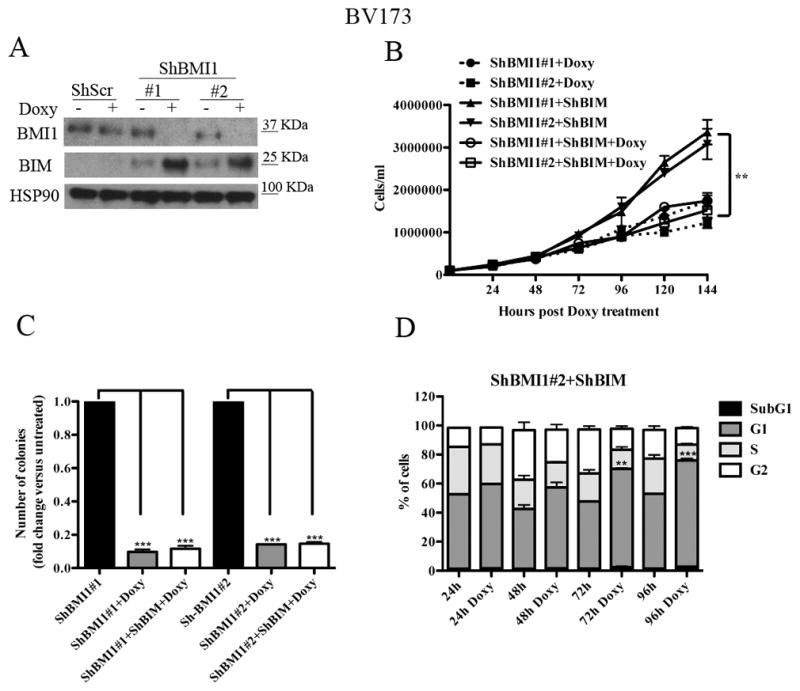
(A) Western blot shows expression of BIM in untreated or Doxy-treated (2.5μg/ml; 72 h) shScr or shBMI1-transduced BV173 cells (A); HSP90 expression was examined as loading control. (B) Cell counts, (C) methylcellulose colonies, and (D) % apoptosis (mean+ SD of three independent experiments) of untreated or Doxy-treated shBMI1/ShBIM BV173 cells. Statistical analysis: one way Anova with Bonferroni’s correction. **<0.01, ***<0.001.
However, DNA content analysis of BMI1- and BMI1/BIM-silenced BV173 cells showed that apoptosis susceptibility (sub-G1 fraction) of BMI1-silenced cells was completely rescued by BIM downregulation (Fig 4D and Supplementary Fig. 4B), indicating that BMI1 regulates proliferation and survival of BV173 cells through different effectors. Of interest, BMI1/BIM-silenced cells exhibited an increased percentage of G1 cells which was not evident in BMI1-silenced BV173 cells (Supplementary Fig. 1); this observation probably reflects the increased apoptosis of these cells (Supplementary Fig. 1) compared to BMI1/BIM double-silenced cells in which apoptosis is completely abrogated (Fig. 4D). The accumulation of BMI1/BIM double-silenced cells in the G1 phase of the cell cycle likely explains why BIM silencing did not rescue the proliferation and colony formation of shBMI1-silenced BV173 cells.
BMI1 silencing enhances the expression of interferon-α-regulated genes and E2F7
To search for INK4A/ARF- and BIM-independent pathways involved in cell cycle regulation that may explain the growth inhibition of BMI1-silenced Ph+ ALL cells, we assessed the gene expression profile of BMI1-silenced BV173 cells. For these experiments, total RNA was isolated from untreated or Doxy-treated (48h) shBMI1#1 BV173 cells and used for oligonucleotide microarray hybridization to identify global changes in gene expression resulting from BMI1 knockdown. Treatment with doxycycline almost abolished BMI1 expression (not shown); the majority (69 out of 115) of genes showing a > 2-fold change in expression upon BMI1 silencing were upregulated, consistent with the transcription repression function of BMI1; among the 836 genes showing at least a 1.5 fold change in expression in Doxy-treated ShBmi-1#1 BV173 versus the untreated control (FDR<0.05), 380 were also downregulated, possibly via indirect mechanisms. Many IFNα-regulated genes and E2F7 were among those upregulated in BMI1-silenced cells (Supplementary Table 1). The volcano plot of differential expression analysis shows that most genes were centered around zero, confirming the correct normalization of the datasets (Supplementary Figure 5A).
Moreover, hierarchical clustering of differentially expressed genes in the two biological replicates of Doxy-treated versus untreated shBMI1#1 BV173 cells suggests that the two samples have distinct gene signatures (Supplementary Figure 5B). To assess the top canonical pathways enriched in BMI1-silenced cells, we performed Ingenuity Pathway Analysis (www.ingenuity.com) on differentially expressed genes and found that the second most enriched pathway was that of the IFNα response (Supplementary Figure 6). To further confirm this finding, changes in the expression of IFIT3 (interferon-induced protein with tetratricopeptide repeats 3), IRF-9 (interferon regulatory factor 9), IFI44 (interferon induced 44), IFI6 (interferon induced 6), IFIT1 ((interferon-induced protein with tetratricopeptide repeats 1), 2′-5′ oligoadenylate synthetase 1 (OAS1) and E2F7 were validated by real time PCR (Supplementary Fig. 7).
E2F7 or E2F7/BIM downregulation rescues, in part or almost entirely, the growth inhibition of BMI1-silenced BV173 cells
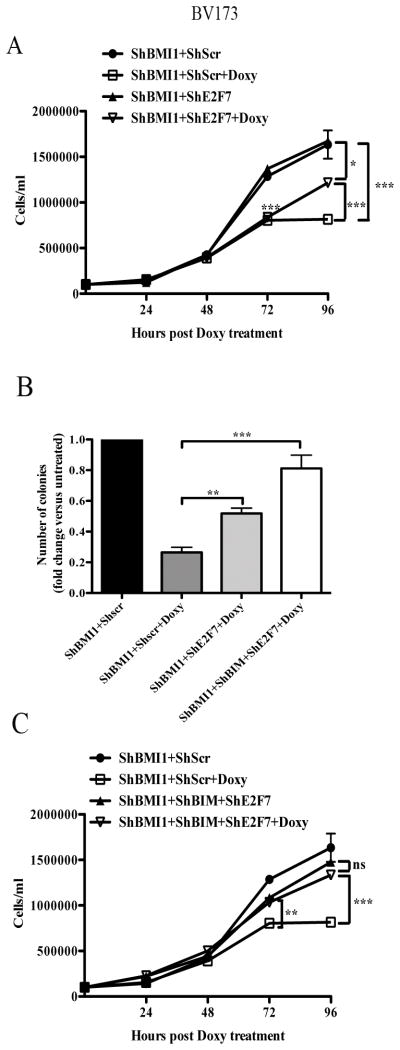
E2F7 inhibits cell proliferation by binding multiple G1/S- regulated genes and repressing their transcription and by interacting with E2F1 and blocking its transcription-activation function (36,37). Thus, we assessed whether the impaired proliferation of BMI1-silenced BV173 cells could be rescued by E2F7 silencing. Real-time PCR of shBMI1 BV173 cells transduced with different shE2F7/GFP lentiviruses revealed that E2F7 expression was downregulated only in cells transduced with the hE2F7/GFP#3lentivirus (Supplementary Fig. 8). Proliferation and colony formation assays of double-silenced BMI1/E2F7 BV173 cells showed that cell numbers and methylcellulose colonies were more numerous than those of BMI1-silenced cells (Fig. 5A and 5B), suggesting that enhanced expression of E2F7 can, in part, explain the impaired growth of BMI1-silenced BV173 cells; by contrast, apoptosis susceptibility (sub-G1 fraction) of BMI1-silenced cells was not rescued by E2F7 downregulation (not shown).
Fig. 5. Effect of E2F7 or E2F7/BIM silencing on BMI1-dependent inhibition of proliferation and survival of BV173 cells.
Cell counts (A, C) and colony formation (B) (mean SD of three independent experiments) of untreated or doxycycline-treated shBMI1, double-transduced-shBMI1/shE2F7, or triple-transduced shBMI1/shBIM/shE2F7 BV173 cells. Statistical analysis: one way Anova with Bonferroni’s correction. *<0.05, **<0.01, ***<0.001.
Since BIM silencing did not enhance the proliferation but completely blocked the apoptosis of BMI1-silenced BV173 cells (Fig. 4), we also assessed the effects of simultaneous downregulation of BIM and E2F7 in BMI1-silenced cells. BIM/E2F7 downregulation rescued almost entirely the reduced colony formation and cell growth of BMI1-silenced BV173 cells (Fig. 5B and C), but the size of the colonies was smaller than that of untreated shBMI1/BIM/E2F-7 BV173 cells (not shown); as expected, BMI1/BIM/E2F-7-silenced BV173 cells did not undergo apoptosis (not shown).
To determine whether the molecular interplay among BMI1, BIM and E2F7 exists also in primary cells, we assessed the expression of BIM and E2F7 in BMI1-silenced Ph+ ALL cells and found increased expression of both compared to control cells (Fig 6A, ALL#1222 is shown as example).
Fig. 6. E2F7 and BIM are BMI1 targets in Ph+ ALL primary cells and E2F7/BIM silencing rescues, in part, the leukemogenesis of BMI1-silenced BV173 cells in NSG mice.
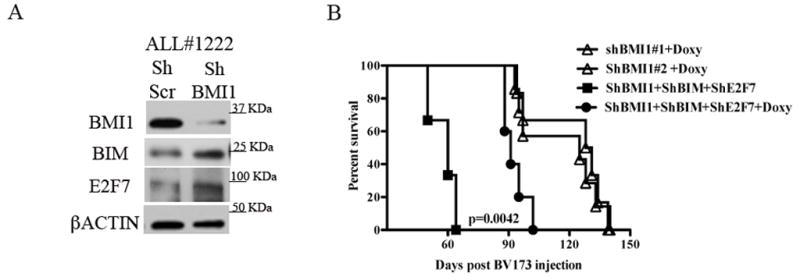
(A) Western blot shows the increased expression of BIM and E2F7 in Ph+ ALL#1222 patient derived primary cells. βACTIN is shown as loading control.
(B) Kaplan-Meier plot shows survival of NSG mice injected with 2×10⁶ untreated or Doxy-treated BIM/E2F7-silenced shBMI1-BV173 cells. In the Doxy-treated group, mice were continuously treated with Doxy in the drinking water (2 g/L) starting three days post-cell injection. Survival curves of Doxy treated mice injected with shBMI1-BV173 cells are shown as control. Statistical analysis: log rank test..
Moreover, Doxy-treated NSG mice injected with shBMI1/BIM/E2F7 BV173 cells (n=7) exhibited a shorter survival than Doxy-treated mice injected with shBMI1 BV173 cells (median survival of 94.5 vs 128 days; P= 0.0042) (Fig. 6B). By contrast, survival of untreated mice injected with shBMI1/BIM/E2F7 BV173 cells (n=3) was 60 days (Fig. 6B), undistinguishable from that of mice injected with parental BV173 cells or Doxy-treated mice injected with shscr BV173 cells (Fig. 3A).
BIM or E2F7 overexpression mimics the effect of BMI1 silencing on colony formation of BV173 cells
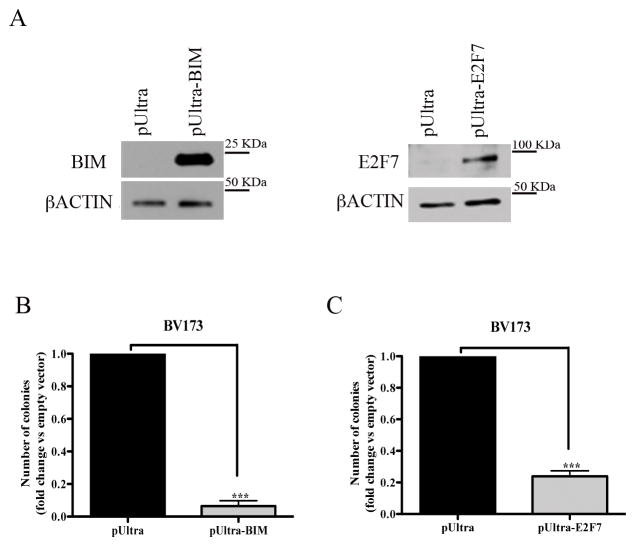
To further assess whether BIM and E2F7 are, at least in part, responsible for the biological effects of BMI1 silencing, BV173 or SUP-B15 cells were transduced with a pUltra lentivirus driving BIM or E2F7 expression, sorted by GFP positivity, and plated in methylcellulose. Compared to controls, BV173 cells transduced with the pUltra-BIM or the pUltra-E2F7 vector exhibited high levels of ectopic BIM or E2F7 expression (Fig. 7A) and were markedly less clonogenic (Fig. 7B and C). Similar results were obtained in pUltra-BIM- or pUltra-E2F7- transduced SUP-B15 cells (Supplementary Fig. 9).
Fig. 7. Overexpression of BIM or E2F7 suppresses colony formation of BV173 cells.
(A) Western blots show overexpression of BIM or E2F7 in pUltra-BIM- or pUltra-E2F7-transduced BV173 cells. βACTIN expression is shown as loading control; (B, C) Colony formation of pUltra-BIM (B) or pUltra-E2F7 (C)-transduced BV173 cells. Data represent the mean + SD of two independent experiments. Statistical analysis: 2-tailed Student t test. ***<0.001
IFNα treatment inhibits colony formation of Ph+ ALL cells
Since microarray analysis of BMI1-silenced BV173 cells revealed increased expression of IFNα regulated genes (Supplemetary Table 1), and the activation of this pathway may be also important for the growth inhibition of BMI1-silenced BV173 cells, we performed colony formation assays of IFNα-treated Ph+ ALL cells. As shown in Fig 8A, treatment with INFα inhibited colony formation of BV173 cells and this effect was enhanced by co-treatment with imatinib. Moreover, colonies derived from IFNα-treated BV173 cells were smaller than those derived from untreated cells (192 ± 11 vs 308 ± 48 cells/colony, respectively) and colonies from BV173 cells treated with IFNα and imatinib were smaller than those from cells treated with imatinib only (37 ± 6 vs 47.5 ± 2 cells/colony). Of greater importance, treatment with IFNα markedly suppressed colony formation of primary Ph+ ALL samples (n=4) (Fig. 8B and C), and the effect was further increased by co-treatment with imatinib (n=3) (Fig. 8B) or dasatinib in a sample insensitive to imatinib (Fig. 8C).
Fig. 8. Effect of IFNα- and/or imatinib or dasatinib on colony formation of Ph+ ALL.
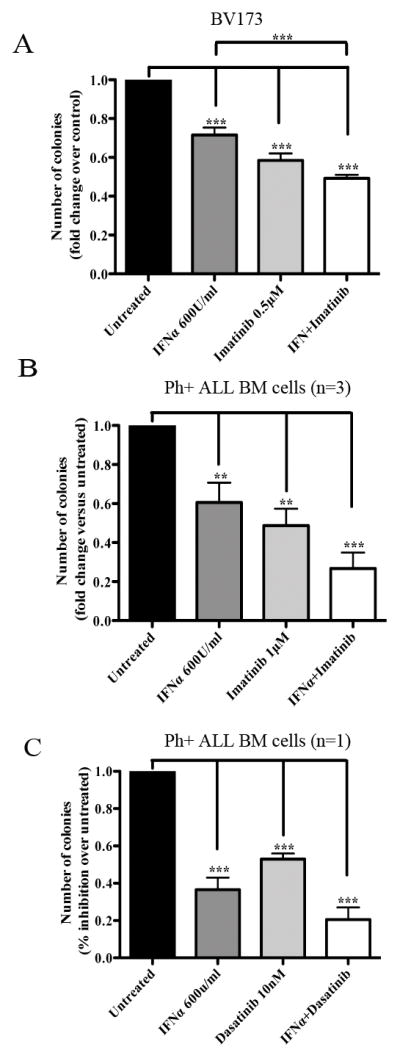
Methylcellulose colony formation of BV173 (mean+ SD of three independent experiments) or primary bone marrow Ph+ ALL cells (mean+ SD of triplicate plates) treated with IFNα and/or imatinib (A and B, respectively) or with the IFNα and/or dasatinib (C). In (B), four samples were treated with IFNα only while three samples were treated with imatinib alone or the IFNα/imatinib combination. Results are expressed as % inhibition of colony formation of untreated vs treated cells. Statistical analysis: one way Anova with Bonferroni’s correction. **<0.01, ***<0.001.
The effects of BMI1 silencing are, in part, mimicked by treatment with the BMI1 inhibitor PTC-209
A small molecule inhibitor of BMI1, PTC-209, has recently been described and shown to inhibit the self-renewal of colorectal cancer-initiating cells resulting in suppression of tumor growth (38). Thus, we tested whether treatment of Ph+ ALL cells with PTC-209 would mimic the effects of BMI1 silencing. As shown in Supplementary Fig. 10, treatment with PTC-209 markedly suppressed proliferation and colony formation of Ph+ BV173 cells (panels A and B) and colony formation of Ph+ primary ALL cells (panel C). Analysis of BMI1 and BMI1 target expression revealed that BMI1 levels were reduced after a 48–72 h treatment specially at the 10μM drug concentration (panel D), while inhibition of proliferation and colony formation was observed also at the 1μM (panels A and B) and 0.5μM (not shown) concentrations; of interest, expression of BIM showed a steady increase starting at 16 h during the 3–72 h PTC-209 treatment (panel D), while RNA levels of BMI1-regulated BIM, IFNα-response genes and E2F7 in PTC-209-treated cells showed no changes or were different from those in BMI1-silenced cells (compare Supplementary Fig. 7 and Supplementary Fig. 10, panel E).
Discussion
We show here that BMI1, a component of the Polycomb-repressive complex 1 essential for stem cell maintenance in many cell types, is required for proliferation, survival and leukemogenesis of Ph+ ALL cells.
In particular, BMI1-silenced Ph+ ALL cells proliferated less, formed fewer colonies, and exhibited enhanced sensitivity to imatinib treatment than control cells; and NSG mice injected with Tet-On-shBMI1 BV173 or SUP-B15 cells and treated with Doxy to silence BMI1 expression exhibited markedly prolonged survival, compared to control mice.
Of interest, ALL cells sorted from the bone marrow of terminally ill Doxy-treated mice revealed persistent downregulation of BMI1 expression, indicating that silencing BMI1 alone can only delay the process of leukemogenesis and/or that Ph+ ALL cells may escape BMI1 inhibition through the activation of other growth-promoting pathways.
BMI1 expression is known to promote tumorigenesis through transcriptional silencing of ARF (p14) and INK4A (p16) expression (30,31). However, the INK4A/ARF locus is homozygously deleted in the cell lines and in some of the primary Ph+ ALL samples used here, strongly suggesting that BMI1 is required by Ph+ ALL cells through INK4A/ARF-independent pathways (32,33). In multiple myeloma cells, the growth-promoting effects of BMI1 were also INK4A/ARF-independent and were, in part, mediated through repression of the pro-apoptotic BIM gene (34).
Consistent with these findings, expression of BIM was also enhanced in BMI-silenced BV173 cells and Ph+ primary ALL cells. However, downregulating BIM expression abolished the apoptosis of BMI1 silenced cells, but did not rescue their impaired proliferation and colony formation, most likely because of an increase in the fraction of G1 phase cells.
Therefore, we searched for novel BMI1-regulated genes whose modulation may explain the reduced proliferation of Ph+ ALL cells through INK4A/ARF-independent mechanisms. Of interest, expression of E2F7, a member of the E2F family with cell cycle inhibitory activity (36,37), and of many IFNα-responsive genes was upregulated in BMI1-silenced cells, raising the possibility that the effects of BMI1 may be due, in part, to repression of E2F7- and/or IFNα-regulated pathways. Indeed, E2F7 downregulation reversed, in part, the inhibition of cell proliferation and colony formation induced by BMI1 silencing, but apoptosis susceptibility of BMI1/E2F7-silenced cells was only rescued when BIM expression was also downregulated; moreover, E2F7/BIM downregulation accelerated the leukemogenesis of shBMI1-silenced BV173 cells, further confirming that BMI1 promotes cell growth and survival of Ph+ ALL cells through distinct pathways. In addition, overexpression of BIM or E2F7 in BV173 and SUP-B15 cells mimicked the effects of BMI1 silencing.
The observation that BMI1 silencing induced the upregulation of many IFNα-response genes suggests that the growth-promoting effects of BMI1 in Ph+ ALL cells may also depend, at least in part, on negative regulation of the IFNα-response pathway, providing a rationale for targeting this pathway. Indeed, treatment with IFNα inhibited the colony formation of primary Ph+ ALL cells and this effect was enhanced by co-treatment with imatinib or dasatinib; these findings support a therapeutic strategy for Ph+ ALL simultaneously targeting the BCR-ABL1 tyrosine kinase and harnessing the growth-suppressive effects of IFNα.
Despite recent improvements through integrated therapeutic approaches consisting of tyrosine kinase inhibitors (TKIs), stem cell transplantation (SCT) and chemotherapy (39), most Ph+ ALL patients still have a poor outcome because of the rapid development of resistance to TKIs (40,41).
Few pilot studies that examined the effects of concomitant administration of IFNα with TKIs, chemotherapy or SCT in patients with Ph+ ALL have reported encouraging results (42–44); however, larger patients’ cohorts and longer follow-ups are necessary to determine whether IFNα has a useful role in the therapy of Ph+ ALL.
Although targeting specific BMI1-regulated pathways may be a useful approach for the therapy of Ph+ ALL, direct inhibitors of BMI1 may prove far better therapeutic agents due to the ability to activate the full spectrum of BMI1-regulated growth-suppressive pathways.
In experiments using PTC-209, a recently discovered BMI1 small molecule inhibitor (38), we found that it markedly suppressed the growth of Ph+ BV173 cells and primary Ph+ ALL cells (Supplementary Fig. 10). However, the effects were observed at drug concentrations that did not significantly reduce BMI1 levels and the expression of BMI1-regulated genes, although PTC-209 treatment induced BIM expression. The reason for these apparently contradictory findings is unclear since PTC-209 was identified in a high-throughput screening of compounds inhibiting Luciferase activity regulated by the BMI1 5′ and 3′ untranslated (UTR) regions (38), implying that decreased BMI1 expression is the primary mechanism of action of PTC-209. In a recent study (45), treatment with PTC-209 led to a clear decrease of BMI1 expression in CML cells; this observation suggests that the difference with our findings in Ph+ ALL cells may be, perhaps, explained by cell type-specific effects influencing levels and/or kinetics of BMI1 and BMI1 targets expression in response to PTC-209. It is also possible that the effects of PTC-209 in Ph+ ALL cells may be, in part, BMI1-independent.
In summary, we have shown here that BMI1 expression is required by Ph+ ALL cells and we have identified novel targets that appear to be mechanistically involved in its growth-promoting effects. Targeting BMI1 or essential BMI1-regulated pathways has the potential to improve the outcome of Ph+ ALL patients.
Supplementary Material
Acknowledgments
This work was supported, in part, by NCI grant RO1 CA167169 (to BC) and by SKCC support grant P30 CA056036. Dr Samanta A. Mariani was supported, in part, by an AIRC-Marie Curie international fellowship.
Footnotes
The authors declare no conflict of interest
Supplementary information is available at Leukemia’s website
References
- 1.Melo JV. The diversity of BCR-ABL fusion proteins and their relationShip to leukemia phenotype. Blood. 1996;88:2375–2384. [PubMed] [Google Scholar]
- 2.Goga A, McLaughlin J, Afar DE, Saffran DC, Witte ON. Alternative signals to RAS for hematopoietic transformation by the BCR-ABL oncogene. Cell. 1995;82:981–988. doi: 10.1016/0092-8674(95)90277-5. [DOI] [PubMed] [Google Scholar]
- 3.Nieborowska-Skorska M, Wasik MA, Slupianek A, Salomoni P, Kitamura T, Calabretta B, et al. Signal transducer and activator of transcription (STAT)5 activation by BCR/ABLis dependent on intact Src homology (SH)3 and SH2 domains of BCR/ABL and is required for leukemogenesis. J Exp Med. 1999;189:1229–1242. doi: 10.1084/jem.189.8.1229. [DOI] [PMC free article] [PubMed] [Google Scholar]
- 4.Skorski T, Bellacosa A, Nieborowska-Skorska M, Majewski M, Martinez R, Choi JK, et al. Transformation of hematopoietic cells by BCR-ABL requires activation of a PI-3k/Akt-dependent pathway. EMBO J. 1997;16:6151–6161. doi: 10.1093/emboj/16.20.6151. [DOI] [PMC free article] [PubMed] [Google Scholar]
- 5.Perrotti D, Calabretta B. The biology of CML blast crisis. Blood. 2004;103:4010–4022. doi: 10.1182/blood-2003-12-4111. [DOI] [PubMed] [Google Scholar]
- 6.Perrotti D, Jamieson C, Goldman J, Skorski T. Chronic myeloid leukemia: mechanisms of blastic transformation. J Clin Invest. 2010;120:2254–2264. doi: 10.1172/JCI41246. [DOI] [PMC free article] [PubMed] [Google Scholar]
- 7.Lugo TG, Pendergast AM, Muller AJ, Witte ON. Tyrosine kinase activity and transformation potency of bcr-abl oncogene products. Science. 1990;247:1079–1082. doi: 10.1126/science.2408149. [DOI] [PubMed] [Google Scholar]
- 8.Kantarjian H, Talpaz M, Dhingre K, Estey E, Keating MJ, et al. Significance of P210 versus P190 molecular abnormalities in adults with Philadelphia chromosome positive acute leukemia. Blood. 1991;78:2411–2418. [PubMed] [Google Scholar]
- 9.Cimino G, Pane F, Elia L, Finocezzi E, Fazi P, et al. The role of BCR/ABL isoforms in the presentation and outcome of patients with Philadelphia-positive acute lymphoblastic leukemia: a seven year update of the GIMENA 0496 trial. Haematologica. 2006;91:377–380. [PubMed] [Google Scholar]
- 10.Williams RT, Sherr CJ. The INK4-ARF (CDKN2A/B) locus in hematopoiesis and BCR-ABL-induced leukemias. Cold Spring Harbor Symposia Quant Biol. 2008;73:461–467. doi: 10.1101/sqb.2008.73.039. [DOI] [PubMed] [Google Scholar]
- 11.Mullighan CG, Miller CB, Radtke I, Phillips LA, Dalton J, et al. BCR-ABL1 lymphoblastic leukemia is characterized by the deletion of Ikaros. Nature. 2008;453:110–114. doi: 10.1038/nature06866. [DOI] [PubMed] [Google Scholar]
- 12.Klemm L, Duy C, Iacobucci I, Kuchen S, von Levetzow G, et al. The B cell mutator AID promotes B lymphoid blast crisis and drug resistance in chronic myeloid leukemia. Cancer Cell. 2009;16:232–245. doi: 10.1016/j.ccr.2009.07.030. [DOI] [PMC free article] [PubMed] [Google Scholar]
- 13.Gruber TA, Chang MS, Sposto R, Müshen M. Activation-induced cytidine deaminase accelerates clonal evolution in BCR-ABL1-driven B cell lineage acute lymphoblastic leukemia. Cancer Res. 2010;70:7411–7420. doi: 10.1158/0008-5472.CAN-10-1438. [DOI] [PMC free article] [PubMed] [Google Scholar]
- 14.van Lohuizen M, Frasch M, Wientjens E, Berns A. Sequence similarity between the mammalian bmi-1 proto-oncogene and the Drosophila regulatory genes Psc and Su(z)2. Nature. 1991;353:353–355. doi: 10.1038/353353a0. [DOI] [PubMed] [Google Scholar]
- 15.Waldron T, De Dominici M, Soliera AR, Audia A, Iacobucci I, Lonetti A, et al. c-Myb and its target Bmi1 are required for p190BCR/ABL leukemogenesis in mouse and human cells. Leukemia. 2012;26:644–653. doi: 10.1038/leu.2011.264. [DOI] [PMC free article] [PubMed] [Google Scholar]
- 16.Cao R, Tsukada Y, Zhang Y. Role of Bmi-1 and Ring1A in H2A ubiquitylation and Hox gene silencing. Mol Cell. 2005;20:845–854. doi: 10.1016/j.molcel.2005.12.002. [DOI] [PubMed] [Google Scholar]
- 17.Lessard J, Sauvageau G. Bmi-1 determines the proliferative capacity of normal and leukaemic hematopoietic stem cells. Nature. 2003;423:255–260. doi: 10.1038/nature01572. [DOI] [PubMed] [Google Scholar]
- 18.Park IK, Qian D, Kiel M, Becker MW, Pihalja M, et al. Bmi-1 is required for maintenance of adult self-renewing hematopoietic stem cells. Nature. 2003;423:302–305. doi: 10.1038/nature01587. [DOI] [PubMed] [Google Scholar]
- 19.Molofsky AV, Pardal R, Iwashita T, Park IK, Clarke MF, Morrison SJ. Bmi-1 dependence distinguishes neural stem cell self-renewal from progenitor proliferation. Nature. 2003;425:962–967. doi: 10.1038/nature02060. [DOI] [PMC free article] [PubMed] [Google Scholar]
- 20.Sparmann A, van Lohuizen M. Polycomb silencers control cell fate, development and cancer. Nat Rev Cancer. 2006;6:846–856. doi: 10.1038/nrc1991. [DOI] [PubMed] [Google Scholar]
- 21.Sauvageau M, Sauvageau G. Polycomb group proteins: multi-facet regulators of somatic stem cells and cancer. Cell Stem Cell. 2010;7:299–313. doi: 10.1016/j.stem.2010.08.002. [DOI] [PMC free article] [PubMed] [Google Scholar]
- 22.Jiang L, Li J, Song L. Bmi-1, stem cells and cancer. Acta Biochim Biophys Sin (Shanghai) 2009;41:527–534. doi: 10.1093/abbs/gmp040. [DOI] [PubMed] [Google Scholar]
- 23.Cao L, Bombard J, Cintron K, Sheedy J, Weatall ML, Davis TW. BMI1 as a novel target for drug discovery in cancer. J Cell Biochem. 2011;112:2729–2741. doi: 10.1002/jcb.23234. [DOI] [PubMed] [Google Scholar]
- 24.Glinsky GV. Death-from-cancer signatures and stem cell contribution to metastatic cancer. Cell Cycle. 2005;4:1171–1175. doi: 10.4161/cc.4.9.2001. [DOI] [PubMed] [Google Scholar]
- 25.Glinsky GV, Berezovska O, Glinskii AB. Microarray analysis identifies a death-from-cancer signature predicting therapy failure in patients with multiple types of cancer. J Clin Invest. 2005;115:1503–1521. doi: 10.1172/JCI23412. [DOI] [PMC free article] [PubMed] [Google Scholar]
- 26.Mohty M, Yong AS, Szydlo RM, Apperley JF, Melo JV. The polycomb group BMI1 gene is a molecular marker for predicting prognosis of chronic myeloid leukemia. Blood. 2007;110:380–383. doi: 10.1182/blood-2006-12-065599. [DOI] [PubMed] [Google Scholar]
- 27.Bhattacharyya J, Mihara K, Yasunaga S, Tanaka H, Hoshi M, et al. BMI-1 expression is enhanced through transcriptional and posttranscriptional regulation during the progression of chronic myeloid leukemia. Ann Hematol. 2009;88:333–340. doi: 10.1007/s00277-008-0603-8. [DOI] [PubMed] [Google Scholar]
- 28.Rizo A, Horton SJ, Olthef S, Dontje B, Aurema A, et al. BMI1 collaborates with BCR-ABL in leukemic transformation of human CD34+ cells. Blood. 2010;116:4621–4630. doi: 10.1182/blood-2010-02-270660. [DOI] [PubMed] [Google Scholar]
- 29.Sengupta A, Ficker AM, Dunn SK, Madhu M, Cancelas JA. Bmi-1 reprograms CML B-lymphoid progenitors to become B-ALL-initiating cells. Blood. 2012;119:494–502. doi: 10.1182/blood-2011-06-359232. [DOI] [PMC free article] [PubMed] [Google Scholar]
- 30.Jacobs JJ, Kieboom K, Marino S, DePinho RA, van Lohuizen M. The oncogene and Polycomb-group gene bmi-1 regulates cell proliferation and senescence through the ink4a locus. Nature. 1999;397:164–168. doi: 10.1038/16476. [DOI] [PubMed] [Google Scholar]
- 31.Jacobs JJ, Scheijen B, Vonchen JW, Kieboom K, Berns A, van Lohuizen M. Bmi-1 collaborates with c-Myc in tumorigenesis by inhibiting c-Myc-induced apoptosis via INK4a/ARF. Genes Dev. 1999;13:2678–2690. doi: 10.1101/gad.13.20.2678. [DOI] [PMC free article] [PubMed] [Google Scholar]
- 32.Douglas D, Hsu JH, Hung L, Cooper A, Abdueva D, et al. BMI-1 promotes Ewing sarcoma tumorigenicity independent of CDKN2A repression. Cancer Res. 2008;68:6507–6511. doi: 10.1158/0008-5472.CAN-07-6152. [DOI] [PMC free article] [PubMed] [Google Scholar]
- 33.Bruggeman SW, Hulsman T, Tanger E, Buckle T, Blom M, et al. Bmi1 controls tumor development in an Ink4a/arf-independent manner in a mouse model for glioma. Cancer Cell. 2007;12:328–341. doi: 10.1016/j.ccr.2007.08.032. [DOI] [PubMed] [Google Scholar]
- 34.Jagani Z, Wiederschain D, Loo A, He D, Mosher R, et al. The Polycomb group protein Bmi-1 is essential for the growth of multiple myeloma cells. Cancer Res. 2010;70:5528–5538. doi: 10.1158/0008-5472.CAN-09-4229. [DOI] [PubMed] [Google Scholar]
- 35.Feldhahn N, Henke N, Melchior K, Duy C, Soh BN, et al. Activation-induced cytidine deaminase acts as a mutator in BCR-ABL1-transformed acute lymphoblastic leukemia cells. J Exp Med. 2007;204:1157–1166. doi: 10.1084/jem.20062662. [DOI] [PMC free article] [PubMed] [Google Scholar]
- 36.Westendorp B, Mokry M, Groot Koerkamp Mj, Holstege FC, Cuppen E, de Bruin A. E2F7 represses a network of oscillating cell cycle genes to control S-phase progression. Nucleic Acids Res. 2012;40:3511–3523. doi: 10.1093/nar/gkr1203. [DOI] [PMC free article] [PubMed] [Google Scholar]
- 37.Liu B, Shats I, Angus SP, Gatza ML, Nevins JR. Interaction of E2F7 transcription factor with E2F1 and C-terminal binding protein (CtBP) provides a mechanism for E2F7-dependent transcription repression. J Biol Chem. 2013;288:24581–24589. doi: 10.1074/jbc.M113.467506. [DOI] [PMC free article] [PubMed] [Google Scholar]
- 38.Kreso A, van Galen P, Pedley NM, Lima-Fernandes E, Frelin C, et al. Self-renewal as a therapeutic target in human colorectal cancer. Nature Medicine. 2014;20:29–38. doi: 10.1038/nm.3418. [DOI] [PubMed] [Google Scholar]
- 39.Ottmann OG, Pfeifer H. First-line treatment of Philadelphia chromosome-positive acute lymphoblastic leukemia (Ph+ ALL) in adults. Curr Opin Oncol. 2009;Suppl 1:S43–46. doi: 10.1097/01.cco.0000357476.43164.6b. [DOI] [PubMed] [Google Scholar]
- 40.Branford S, Rudzki Z, Walsh S, et al. High frequency of point mutations clustered within the adenosine triphosphate-binding region of BCR/ABL in patients with chronic myeloid leukemia or Ph-positive acute lymphoblastic leukemia (Ph+ ALL) who develop imatinib (STI571) resistance. Blood. 2002;99:3472–3475. doi: 10.1182/blood.v99.9.3472. [DOI] [PubMed] [Google Scholar]
- 41.Pfeifer H, Wassmann B, Pavlova A, Wunderle L, Oldenburg J, et al. Kinase domain mutations of BCR-ABL frequently precede imatinib-based therapy and give rise to relapse in patients with de novo Philadelphia-positive acute lymphoblastic leukemia (Ph+ ALL) Blood. 2007;110:727–734. doi: 10.1182/blood-2006-11-052373. [DOI] [PubMed] [Google Scholar]
- 42.Visani G, Isidori A, Malagola M, Alberti D, Capdeville R, et al. Efficacy of imatinib mesylate (STI571) in conjunction with alpha-interferon: long-term quantitative molecular remission in relapsed P-190BCR-ABL-positive acute lymphoblastic leukemia. Leukemia. 2002;16:2159–2161. doi: 10.1038/sj.leu.2402729. [DOI] [PubMed] [Google Scholar]
- 43.Wassmann B, Scheuring U, Pfeifer H, Binckebanck A, Kabish A, et al. Efficacy and safety of imatinib mesylate (Glivec) in combination with interferon-alpha (IFN-alpha) in Philadelphia chromosome-positive acute lymphoblastic leukemia (Ph+ ALL) Leukemia. 2003;17:1919–1924. doi: 10.1038/sj.leu.2403093. [DOI] [PubMed] [Google Scholar]
- 44.Piccaluga PP, Martinelli G, Isidori A, Malagola M, Rondoni M, Paolini S, et al. long-term molecular complete remission with IFN-α in Ph+ adult acute lymphoid leukemia patients. Leukemia. 2008;22:1617–1618. doi: 10.1038/leu.2008.10. [DOI] [PubMed] [Google Scholar]
- 45.Mourgues L, Imbert V, Nebout M, Colosetti P, Neffati Z, et al. The BMI1 polycomb protein represses cyclin G2-induced autophagy to support proliferation in chronic myeloid leukemia cells. Leukemia. 2015;29:1993–2002. doi: 10.1038/leu.2015.112. [DOI] [PubMed] [Google Scholar]
Associated Data
This section collects any data citations, data availability statements, or supplementary materials included in this article.


