Abstract
Thyroid hormone (T3) has been suggested to play a role in HSV-1 replication. It was previously reported that HSV-1 replication was suppressed by T3 in mouse neuroblastoma cells overexpressing Thyroid Hormone Receptor β1 (TRβ1). Using a human neuro-endocrine cells LNCaP differentiated by androgen deprivation, HSV-1 replication was active but decreased by T3 at very low moi, probably due to low copy of TRβ1. In this study, a recombinant HSV-1 was constructed expressing TRβ1 (HSV-1/TRβ1). Infection of Vero cells (very little TRβ1 expression) with HSV-1/TRβ1 exhibited increased replication in the presence of T3 compared to the counterpart without TRβ1 overexpression. Interestingly, HSV-1/TRβ1 infection of differentiated LNCaP cells showed strong suppression of viral replication by T3 and the removal of hormone did not fully reversed the suppression as was observed in parent virus. Quantitative analyses indicated that ICP0 expression was blocked using HSV-1/TRβ1 for infection during T3 washout, suggesting that overexpression of TRβ1 is likely to delay its inhibitory effect on viral gene expression. Together these results emphasized the importance of TRβ1 in the regulation of HSV-1 replication in differentiated environment with neuronal phenotype.
Keywords: Herpes Simplex Virus, Thyroid Hormone, Differentiation, Neurons, Plaque Assay, Thyroid Hormone Receptor beta 1
INTRODUCTION
Herpes Simplex Virus 1 (HSV-1) affected millions of people worldwide by causing various degrees of complications from mild fever blister to severe keratitis and encephalitis [1]. Like many other herpesviruses, it may establish latency in patients and leans to maintain a quiescent state of infection in the sensory neurons of trigeminal ganglia (TG) [1]. However, it is still not clear how the virus initiated and maintained the quiescent state in neurons. A number of mechanisms have been suggested to participate in this complex process such as immune response alteration [2, 3], virus-mediated anti-apoptosis [4-8], microRNAs-triggered gene silencing [9, 10], tissue specific neuronal suppression [11-14], repressive chromatin [15-21], and hormonal abnormality [22-25].
Thyroid hormonal (T3) fluctuation was recently proposed to play a role in regulating HSV-1 replication in neurons [26-29]. It exerts its physiological and biological functions primarily through its nuclear receptor thyroid hormone receptor (TR) [30]. There are at least two isoforms, TRα and TRβ, encoded on human chromosomes 17 and 3, respectively [31] and they are ubiquitously expressed with different distribution [32]. In general, TRα mRNA has highest expression in skeletal muscle and brown fat, whereas TRβ mRNA has highest expression in brain, liver, and kidney [30]. There are two TRβ proteins, designated as TRβ1 and TRβ2, and they are coded by two promoters [31, 33]. The majority of amino acid sequences such as the DNA binding domain (DBD), hinge region, and ligand binding domains (LBDs) of these two isoforms are identical nonetheless the regions of amino-termini exhibit no homology [30]. Both isoforms are genuine nuclear receptors as they bind their DNA target TREs and hormone with high affinity and thus initiate T3-dependent transcription regulation. TRβ1 has mRNA expression profile in brain, liver, and kidney. TRβ2 protein, however, demonstrated tissue-specific expression in other parts of the brain, for example, the anterior pituitary gland, specific areas of the hypothalamus, as well as the developing brain and inner ear [30].
It was shown that viral replication in mouse neuro-2a cells overexpressing TRβ1 [34] was down-regulated by T3, suggesting an important role of TRβ1 in this novel regulation [35, 36]. The expression of TRβ1 in epithelial cells such as Vero is quite low and showed no regulatory effect on HSV-1 replication [37]. TRβ1 was present in TG neurons but the concentration is undetermined [38]. Using differentiated human neuroendocrine cells LNCaP as a model for T3-mediated HSV-1 regulation studies indicated that T3/TRβ1 suppressed viral replication [37]. However, it is our observation that human cells are very prone to HSV-1 infection compared to mouse cells and the moi needs to be kept very low or the cells died after 24-48 hpi (unpublished data). It is challenging to perform molecular studies due to the low copy number of the virus within infected cells. It is also of interest to see how the viruses behave with TRβ1 over expression.
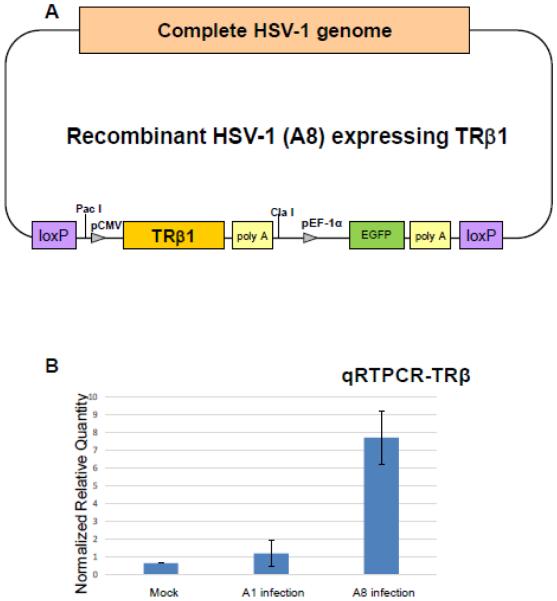
In this study a recombinant virus HSV-1 carrying TRβ1 gene (Fig. 1A) was created to analyze the effects of TRβ1 overexpression on viral replication in epithelial cells as well as differentiated LNCaP exhibiting neuronal physiology. Our results showed that additional expression of TRβ1 exhibited different regulatory outcomes of viral replication between epithelial and differentiated LNCaP and the presence of T3 and differentiation status were critical.
Fig. 1. Construction of recombinant HSV-1 over-expressing TRβ1 (A8).
A. The construction was based on the HSV-1 BAC and Cre-Lox P system described in Materials and Methods. The BAC was inserted between the HSV-1 UL3 and UL4 genes and the resulting virus retained same capacity of gene expression and replication as the wild-type virus.
B. Quantitative RTPCR to measure the TRβ1 mRNA level in Vero cells infected with A1 or A8. Mock is a no infection control. The TRβ1was normalized by cellular gene PPIA.
RESULTS
Infection of Vero cells with HSV-1/TRβ1 (A8 virus) increased the TRβ1 expression
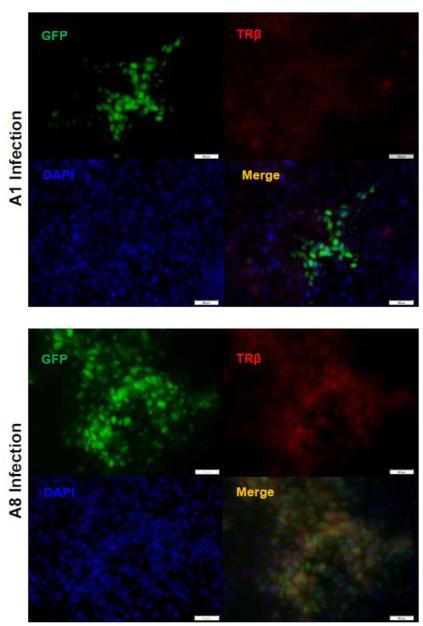
It was shown that Vero cells have very low TRβ1 expression [37]. The infection of Vero cells with A1 virus, the HSV-1 without TRβ1 transgene, did not increase the expression (Fig. 1B). However, Vero infection using TRβ1 expressing virus A8 depicted in Fig. 1A exhibited escalated expression of TRβ1 by as many as 15-fold compared to no infection control (Fig. 1B). Effects of T3 addition on TRβ1 expression in Vero cells were tested and showed modest increase (data not shown). To further confirm the expression of TRβ by A8, immunofluorescence analyses was performed on cells infected by A8 as well as A1 for comparison. Since both are recombinant HSV-1 constitutively expressing GFP, infected cells can be easily detected (Fig. 2). After appropriate fixation, blocking, and incubation with TRβ antibody, the results supported the previous observation that TRβ protein (red) was co-expressed in the cells infected with A8 virus (Fig. 2). Together these results indicated that A8 virus was sufficient to produce TRβ1 during infection and augment its expression.
Fig. 2. Immunofluorescence analyses exhibited expression of TRβ in A8 infected cells.
Immunofluorescent microscopy indicated that TRβ (red) is abundant in the cells infected with A8 recombinant virus in comparison to infection of A1 as controls, which showed weak TRβ expression.
T3 enhanced A8 replication in Vero cells
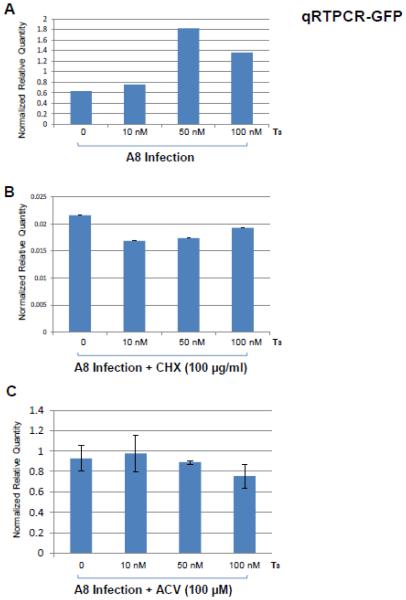
The replication of A8 in Vero cells was first evaluated by GFP expression since this virus also included a GFP expression cassette (Fig. 1A). The qRT-PCR results normalized by host gene PPIA showed that T3 at 50 nM had greatest effect to increase GFP transcription by at least 3-fold comparing to no hormone treatment (Fig. 3A). This increase was abolished while the de novo protein syntheses were blocked, (Fig. 3B). Similar infections were performed using acyclovir (ACV) to block viral replication and the results indicated that hormone-mediated GFP transcript increase was reversed, suggesting that GFP transcription increase was not created by direct T3, but due to increase of viral replication (Fig. 3C). In addition, infection of A1 did not show this regulatory consequence [37], indicating this T3-mediated replication increase resulted from the presence of TRβ1.
Fig. 3. Evaluation of T3 effects on viral replication in Vero cells by qRTPCR.
A. Vero cells were infected by A8 at moi of 1 with different concentration of T3 (10nM, 50nM, and 100nM) and the total RNA was isolated at 22 hpi followed by qRTPCR using GFP primers. Cellular gene PPIA was measured as internal control and the results were presented as relative quantity normalized by host gene PPIA.
B. The same experiments were repeated in the presence of CHX (100 µg/ml) to inhibit the influence of viral gene products and viral replication.
C. Additional approach using ACV (100 µM) to block viral replication strengthened the hypothesis that hormone increased the viral replication in Vero cells in the presence of TR.
T3 increased the release of infectious A8 in Vero cells
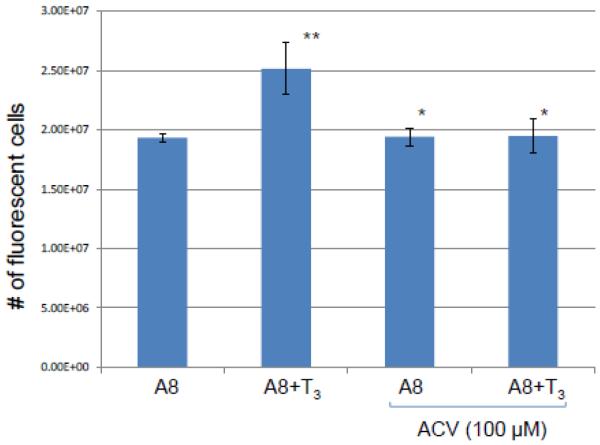
The analyses of A8 replication during Vero infection was further investigated by automated high throughput fluorescent imaging. It showed that upon A8 infection the presence of T3 slightly increased the viral replication measured by the number of fluorescent cells at 24 hpi and replication inhibitor acyclovir (ACV) treatment eliminated this increase (Fig. 4). Collectively these results indicated that T3 enhanced the viral replication in Vero cells while the TRβ1 was present.
Fig. 4. Examination of T3 effects on viral replication in Vero cells by plaque assays.
The viral replication was evaluated by measuring the number of fluorescent cells at 24 hpi. Vero cells were infected by A8 with T3 concentration of 100 nM. ACV aT concentration of 100 µM was added to block the replication as a control.
TRβ overexpression in differentiated cells has suppressive effect of viral replication and infectious virus release during T3 washout
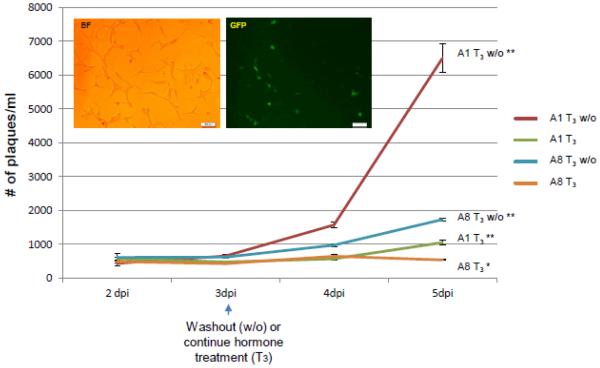
The outcomes of T3 and its subtraction on viral replication in resting cells similar to neurons were addressed by infecting differentiated LNCaP cells (Materials and Methods, T3 removal assays). Fluorescent microscopy showed that cells infected with A8 incubated with T3 exhibited normal healthy morphology (Fig. 5). Time course experiments indicated that at 3 days post-infection (3 dpi) the infectious virus release between A1 and A8 were similar while both cell cultures were still under T3 influence (Fig. 5). Hormone washout was performed right after 3 dpi and it can be seen that the release of A1 virus started to rise at 4 dpi and reached 6,497 pfu/ml at 5 dpi (Fig. 5, red line). The release of A8 infectious virus, however, exhibited only slight increase at 4 dpi upon T3 washout and eventually achieved 1,725 pfu/ml, approximately 74% decrease in comparison to A1 release at 5 dpi (Fig. 5, blue line). Both A1 and A8 remained relatively quiescent while T3 was in place throughout the experiment. Nonetheless at 5 dpi the modest infectious virus release of A1 was 1,047 pfu/ml, a 2-fold increase compared to A8 at 534 pfu/ml (Fig. 5, green and orange lines). Together these results demonstrated that overexpression of TRβ1 participated in a mechanism that impaired the viral replication in the presence of T3.
Fig. 5. Assessment of hormone washout effects on viral replication via time course.
Differentiated cells were infected and media supernatants were collected every day for plaque assays. Bright field and fluorescent microscopy, taken at 5 dpi, showed that A8 infected cells maintained healthy morphology. All supernatants were collected at 2, 3, 4, and 5 dpi followed by plaque assays and statistical analyses by ANOVA. The changes in viral release between 2 dpi and 3 dpi are negligible and no significant differences were observed among all treatments. At 4 dpi the viral release of washout samples started to rise significantly in comparison to hormone treated ones, which showed no significant increase. At 5 dpi viral release from all samples showed significant increase (symbolized as **) except T3 treated A8 infected culture (orange line), which still maintained no significanT increase (denoted as *). The RNA samples from infected cells at 5 dpi were purified for subsequent experiments described in Fig. 6.
TRβ overexpression increased LAT transcription but abolished the ICP0 reactivation upon T3 washout
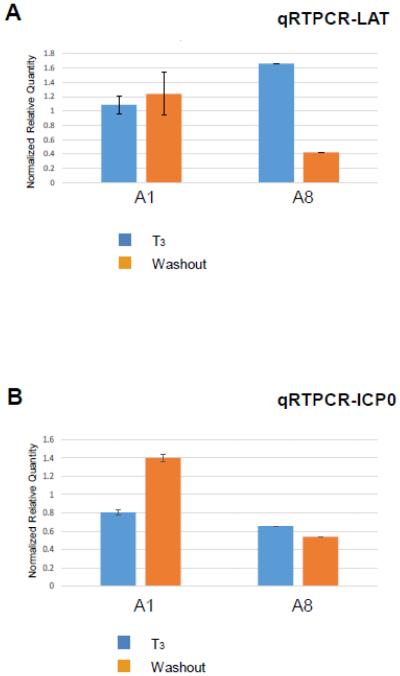
The observation of sustained repression of A8 replication prompted us to examine its gene expression status. Prviously we identified positive TREs located within LAT regulatory sequences and results showed that T3 bound to these TREs, increased LAT transcription, and decreased ICP0 transcription in plasmids containing LAT region transfected into differentiated neuronal cells [35]. This novel regulation of LAT was not observed during infection and it may be due to influence of transactivation from other viral proteins. It is also possible that LAT TREs are weakly bound by TRβ1, and the over-expression would help if this is the case. This hypothesis was tested in A8 infection and the results demonstrated that overexpression was sufficient to show decrease of LAT transcription upon hormonal washout (Fig. 6A), perhaps due to stronger TRβ1 occupancy at the LAT TRE causing the release of co-activator and recruitment of co-repressor in the absence of T3.
Fig. 6. Effect of T3 washout on HSV-1 LAT and ICP0 transcription in the presence or absence of TRβ1 over-expression.
A. The regulatory effect of T3 removal and TRβ1 over-expression on LAT transcription was also evaluated by qRT-PCR. GFP level was analyzed as infection control.
B. Total RNA isolated from Fig. 5 was subjected to qRT-PCR to analyze ICP0 transcription upon hormone washout. GFP expression was evaluated as infection control.
The transcription regulation of ICP0, one of the important IE genes during viral reactivation, was analyzed by qRT-PCR at 5 dpi. In A1 infection ICP0 transcription was increased upon washout of T3, suggesting that the lift of T3-mediated barrier stimulated viral replication perhaps from the effects of ICP0 (Fig. 6B). In contrast, ICP0 expression triggered by hormonal washout in A1 was not observed in A8 infection (Fig. 6B). These results suggested that overexpression of TRβ1, at least in part, exerted its inhibitory effects on replication via repression of ICP0.
DISCUSSION
In this study, we attempted to have TRβ1 overexpression in target cells using recombinant virus A8 carrying this gene to investigate the regulatory effects of T3 on HSV-1 expression/replication. This recombinant virus appeared to have several intriguing differences comparing to its counterpart. First of all, it is not clear why T3 increased viral replication in Vero cells, yet produced suppressive effects in differentiated LNCaP cells when the TRβ1 is present. Vero cell is known to have low TRβ1 level and it seemed that un-differentiation status of the cells with T3 generated a condition in favor of viral replication. Gene expression profile studies will provide more information in light of this novel regulation. On the other hand, it is not understood why T3/TRβ1 can produce this repression in differentiated cells. Epigenetic regulation may play a role in this differentiation-related suppression. It is likely that a combination of differentiation, T3, and TR exert a novel suppressive mechanism repressing viral gene expression and replication, supported by the finding that HSV-1 thymidine kinase (TK) gene was repressed by T3, and TR only in differentiated neuronal cells [36, 37]. Moreover, our preliminary pathway analyses showed that several key components of PI3K pathway were up-regulated only in the differentiated LNCaP with T3. These results may provide interpretation of how T3 interact with this differentiated environment to trigger HSV-1 gene repression using novel non-genomic mechanisms.
Next, in the presence of T3, A8 has a more quiescent state of infection than A1 in differentiated LNCaP even at higher moi and hormonal washout failed to relieve this T3-mediated repression. It is likely due to the amount of TRβ1 in differentiated cells. Based on our hypothesis, we suggest that TRβ1 is a limiting factor participating in the HSV latency. TR is not abundant in human. In comparison to other nuclear receptor, TR appeared to have very low level although it produced very important physiological functions throughout the body. For example, approximately 3,000-5,000 TR molecules per cell were estimated to be expressed in murine liver tissue [39] in contrast to the fact that 460,000 GR molecules were present per cell in liver [40]. RNA-seq data further showed that the TR binding sequence exhibited relative low frequency, reflecting the low abundance of this receptor in tissues [41]. The amount of TRβ1 in TG neurons is not known but assumed to be quite low in comparison to other tissues [39]. Perhaps the TRβ1 overexpression altered the host cell gene expression profile or exhibited increased occupancy to HSV-1 genome. It is thus of interest to analyze this novel regulation when the nuclear receptor is sufficient.
It is important to keep in mind that this differentiated LNCaP cell culture platform serves as a good tool to study the roles of T3/TRβ1 in the regulation of HSV-1 gene expression as well as replication in a differentiated state with similarity to the neuronal environment. We have not established an absolutely quiescent state of infection resembling the latency but certainly can learn its potential roles in that regard. Our observation further suggested that cultured neuronal cells were vulnerable to HSV-1 infection and multiple copies were detrimental to the cells. It is probably due to the fact that the cells were infected through direct contact. Various studies suggested that following ocular scarification, HSV-1 productive infection in TG neurons can be detected as early as 2 to 3 days but disappeared at 7 dpi within the infected ganglia [42]. After the latency establishment, less than 5% of TG neurons were considered latently infected based on the measurement of LAT as determined by different methods [42, 43]. As for the number of viral genome copies in single neurons, it is suggested to have a wide range of distribution. Among all HSV genome positive neurons studied, about 40% of the neurons have 5 to 10 copies and 30% have 10 to 20 copies [44]. This discussion may provide explanation why A8 virus was resistant to reactivation since more TRβ1 was introduced to the infected cells conferring suppressive effect. In addition, infection via two-chamber system would be helpful to achieve the higher copies of infection.
Another important finding of this study is that during A8 infection the hormone washout did not de-repress the ICP0 expression as we observed in A1 and on the contrary diminished the viral replication. Prior investigation indicated that ICP0 promoter did not have TREs and was not directly regulated by T3/TRβ1 and further studies revealed that liganded TRβ1 promoted the recruitment of chromatin insulator CTCF to the LAT CCCTC/TRE and repressed ICP0 transcription by adding repressive chromatin [35]. Our unpublished data showed that CTCF recruitment to the LAT TRE of A8 was increased in the presence of T3 compared to A1 but washout released it efficiently. It is likely other mechanisms were involved to contribute to this novel regulation.
In conclusion, our results demonstrated that TRβ1 was successfully overexpressed by the recombinant virus A8 and the T3/TRβ1 appeared to promote viral replication within the first 24 h in undifferentiated Vero cells. This is an opposite observation in differentiated cells with neuronal phenotype as we previously showed that T3/TRβ1 repressed viral replication [35-37]. Overexpression of TRβ1 rendered the infected cells suppressive to viruses and were more resistant to viral reactivation upon T3 removal. These results supported our hypothesis that T3 and its nuclear receptor TRβ1 exerted regulatory effects on HSV-1 gene expression/replication and differentiation status was required in modulating this process.
MATERIALS AND METHODS
Cells, culture conditions, viruses, and infection
Vero cell (ATCC Cat#: CCL-81) culture were supplemented with 10% FBS and grown in DMEM. Cells were maintained at 5% CO2 and 37°C in a cell culture incubator. Human prostate cancer cell line LNCaP was purchased from ATCC (Cat#: CRL-1740) and maintained in RPMI −1640 supplemented with 10% FBS. Control virus HSV-1 expressing GFP without was used for infection and comparison [36, 45, 46]. This virus given a name of A1 throughout the study. The protocol of infection was described previously [35-37].
Construction of recombinant HSV-1 expression TRβ1
The strategy was to insert TRβ1 within the viral genome by replacing the BAC sequences using the Cre recombinase. The methodology was previously described [46]. In short, the BAC plasmid was introduced into the HSV-1 UL3 and UL4 genes during the original construction of pYEbac102 infectious clone that contains the HSV-1 (F) genome. The Cre recombinase was provided by recombinant adenovirus AxCANCre and was used to excise the BAC sequences from the viral genome. To facilitate insertion of TRβ1, a gene cassette was constructed that contained Pac I and ClaI for cloning the TRβ1 gene flanked by Lox P sites. In this construct TRβ1 was expressed by HCMV immediate early promoter followed by another gene cassette expressing green fluorescent protein (GFP) under the control of the elongation factor 1α (EF-1 α) promoter. This resulting virus was given a name of A8. A schematic representation of the construction is shown in Fig. 2. The titers of A1 and A8 were determined by infections of serial diluted viral stocks followed by a high throughput quantitative fluorescent microscopic plate reader. This method allowed us to detect single cell infected by viruses and the titer was calculated using inverse Poisson’s distribution (this method was described in a manuscript under revision). The result showed that A1 and A8 exhibited similar growth properties in Vero cells.
Neuroendocrine differentiation (NED) induction
For differentiation, cells were plated onto culture dishes at a density of 4×10³ cells per cm2 of growth area. The differentiation was initiated by androgen deprivation and maintained for at least 5 days prior to further treatment. A comprehensive protocol was depicted previously [37].
T3 removal assays
It was essentially described previously [37]. In short, T3-treated cells were infected with same condition. At 48 hpi the media of one infected cells were removed and the cells were washed with PBS and treated with T3 free differentiation media as the washouT group. The other cells were treated accordingly but with hormone. At 96 hpi the conditions both groups were prepared for analysis of either chromatin imunooprecipitation-quantitative PCR or quantitative reverse transcription PCR.
Plaque Assay
Cell monolayers such as Vero cells were prepared at 2.0×10⁵cells/ml a day before the experiment in 24 well plates. Supernatant dilution collected from infected cells were prepared followed by incubation with monolayer for 48 hours. The incubated monolayer were either fixed with methanol followed by staining with crystal violet and plaques were counted or counted by automated high throughput imaging described in the next paragraph. Data were analyzed in triplicates by ANOVA and differences were marked with p<0.05 if found to be statistically significant.
Automated high throughput fluorescent imaging
The fluorescent imaging system was performed on the Cytation 3 Cell Imaging Multi-Mode Reader from Bio-Tek (Cat#: CYT3V, Winooski, VT, USA) with Gen5™ software (Cat#: Gen5). The protocol is essentially described according to the manufacturer.
Fluorescent Microscopy
Approximately 20,000 cells per plate were prepared on a multi-chamber slide (Cat# 354104, BD Falcon) prior to the experiment. After the infection, cells were rinsed once followed by fixation with 100% methanol at −20°C. Slides were then treated with 2% normal blocking serum and incubated with fluorescent mounting medium containing DAPI. The images were detected by Olympus fluorescence microscope (IX71) coupled with an Olympus digital camera photo apparatus (DP71). Analysis was completed using Olympus DP controller software. Exposure time between treatments was equivalent among different samples.
Immuno-fluorescence Analyses (IFA)
The protocol of IFA was described in detail previously [47]. In short, target cells were plated approximately 20,000 cells/well on a multi-chamber slide (Cat# 354104 BD Falcon). These cells were infected accordingly and washed once with 2 ml PBS for 5 min followed by fixation with 100% methanol at −20°C. These slides were incubated with 2% blocking serum followed by addition of primary antibody overnight at 4°C. Fluorescent conjugated secondary antibody (Invitrogen cat#A21424) was added at RT for 1 hr. Finally, the fluorescent mounting media containing DAPI was added for microscopic detection. The detections (EGFP, red fluorescence, and DAPI) were recorded using Olympus fluorescence microscope IX71 connected with a digital camera photo apparatus DP71.
q-RTPCR
Quantitative analyses of gene expression were performed by qRTPCR using myiQ SYBR green supermix and iScript One-Step RT-PCR kits (BIO-RAD). Experiments were performed in triplicate with one set of primers per reaction. The primer sequences for RTPCR are as follows: PPIA: 5′-AGC ATA CGG GTC CTG GCA TCT-3′ and 5′-CAT GCT TGC CAT CCA ACC ACT CA-3 [48]; ICP0: 5’-GAC GGG CAA TCA GCG GTT C-3’ and 5’-GTA GTC TGC GTC GTC CAG GT-3’. GFP: 5′-GCA GAA GAA CGG CAT CAA GGT G-3′ and 5′-TGG GTG CTC AGG TAG TGG TTG TC-3′; TR.1: 5’-TTC CAA ACG GAG GAG AAG AA-3’ and 5’-TAG TGA TAC CCG GTG GCT TT-3’.
The qRTPCR reactions were carried out at 45°C for 10 minutes, 94°C for 2min, followed by 35 cycles of 94°C for 15s, 69°C for 15s, and 72°C for 15s.
The calculation of normalized gene expression was described essentially by manufacturer. In short, the Relative Quantity (RQ) was first measured by this formula below;
Where E= Efficiency of primer set and CT is the cycle of threshold. After getting the RQ of tested sample and control (same method), the normalized expression was calculated by this formula;
Statistical Analyses
All data were collected from three independent experiments and the results were represented as mean ± SD. Statistical analyses were calculated via ANOVA and a p value less than 0.05 was treated as significant with a label of **. A p value larger than 0.05 was treated as not significant with a label of *.
Acknowledgement
This project is supported by R01NS081109 to SVH from NIH and the content is solely the responsibility of the authors and does not necessarily represent the official views of the NINDS/NIH. The authors appreciate the assistance of the editorial staff at UMES.
Abbreviation
- HSV-1
Herpes Simplex Virus Type-1
- T3
Thyroid Hormone
- qPCR
quantitative Polymerase Chain Reaction
- qRT-PCR
quantitative reverse transcription Polymerase Chain Reaction
- moi
multiplicity of infection
- GFP
Green Fluorescent Protein
- DAPI
4',6-diamidino-2-phenylindole
- PPIA
peptidylprolyl isomerase A
- dpi
days post infection
- CHX
cycloheximide
- TRβ1
Thyroid Hormone Receptor Beta 1
- TRE
Thyroid Hormone Receptor Element
- ACV
acyclovir
Footnotes
Conflict of Interest
The authors declare no conflict of interest.
References
- 1.Knipe DM, Howley PM. Fields virology. 6th Vol. 2. Wolters Kluwer/Lippincott Williams & Wilkins Health; Philadelphia, PA: 2013. [Google Scholar]
- 2.Bystricka M, Russ G. Immunity in latent Herpes simplex virus infection. Acta Virol. 2005;49(3):159–67. [PubMed] [Google Scholar]
- 3.Koelle DM, Corey L. Herpes Simplex: Insights on Pathogenesis and Possible Vaccines. Annu Rev Med. 2008;59:381–395. doi: 10.1146/annurev.med.59.061606.095540. [DOI] [PubMed] [Google Scholar]
- 4.Bloom DC. HSV LAT and neuronal survival. Int Rev Immunol. 2004;23(1-2):187–98. doi: 10.1080/08830180490265592. [DOI] [PubMed] [Google Scholar]
- 5.Branco FJ, Fraser NW. Herpes simplex virus type 1 latency-associated transcript expression protects trigeminal ganglion neurons from apoptosis. J Virol. 2005;79(14):9019–25. doi: 10.1128/JVI.79.14.9019-9025.2005. [DOI] [PMC free article] [PubMed] [Google Scholar]
- 6.Carpenter D, et al. Stable cell lines expressing high levels of the herpes simplex virus type 1 LAT are refractory to caspase 3 activation and DNA laddering following cold shock induced apoptosis. Virology. 2007;369(1):12–8. doi: 10.1016/j.virol.2007.07.023. [DOI] [PMC free article] [PubMed] [Google Scholar]
- 7.Peng W, et al. Mapping herpes simplex virus type 1 latency-associated transcript sequences that protect from apoptosis mediated by a plasmid expressing caspase-8. J Neurovirol. 2004;10(4):260–5. doi: 10.1080/13550280490468690. [DOI] [PubMed] [Google Scholar]
- 8.Perng GC, et al. Virus-induced neuronal apoptosis blocked by the herpes simplex virus latency-associated transcript. Science. 2000;287(5457):1500–3. doi: 10.1126/science.287.5457.1500. [DOI] [PubMed] [Google Scholar]
- 9.Cui C, et al. Prediction and identification of herpes simplex virus 1-encoded microRNAs. J Virol. 2006;80(11):5499–508. doi: 10.1128/JVI.00200-06. [DOI] [PMC free article] [PubMed] [Google Scholar]
- 10.Umbach JL, et al. MicroRNAs expressed by herpes simplex virus 1 during latent infection regulate viral mRNAs. Nature. 2008;454(7205):780–3. doi: 10.1038/nature07103. [DOI] [PMC free article] [PubMed] [Google Scholar]
- 11.Block T, et al. Long term herpes simplex virus type 1 infection of nerve growth factor-treated PC12 cells. J Gen Virol. 1994;75:2481–7. doi: 10.1099/0022-1317-75-9-2481. Pt 9. [DOI] [PubMed] [Google Scholar]
- 12.Moxley MJ, et al. Herpes simplex virus type 1 infection prevents detachment of nerve growth factor-differentiated PC12 cells in culture. J Gen Virol. 2002;83:1591–600. doi: 10.1099/0022-1317-83-7-1591. Pt 7. [DOI] [PubMed] [Google Scholar]
- 13.Su YH, et al. The HSV 1 genome in quiescently infected NGF differentiated PC12 cells can not be stimulated by HSV superinfection. J Neurovirol. 2000;6(4):341–9. doi: 10.3109/13550280009030760. [DOI] [PubMed] [Google Scholar]
- 14.Su YH, et al. Stability and circularization of herpes simplex virus type 1 genomes in quiescently infected PC12 cultures. J Gen Virol. 2002;83:2943–50. doi: 10.1099/0022-1317-83-12-2943. Pt 12. [DOI] [PubMed] [Google Scholar]
- 15.Amelio AL, McAnany PK, Bloom DC. A chromatin insulator-like element in the herpes simplex virus type 1 latency-associated transcript region binds CCCTC-binding factor and displays enhancer-blocking and silencing activities. J Virol. 2006;80(5):2358–68. doi: 10.1128/JVI.80.5.2358-2368.2006. [DOI] [PMC free article] [PubMed] [Google Scholar]
- 16.Bedadala GR, Pinnoji RC, Hsia SC. Early growth response gene 1 (Egr-1) regulates HSV-1 ICP4 and ICP22 gene expression. Cell Research. 2007;17(5):1–10. doi: 10.1038/cr.2007.44. [DOI] [PMC free article] [PubMed] [Google Scholar]
- 17.Chen Q, et al. A CTCF-dependent chromatin boundary element exists between the LAT and ICP0 promoters in the HSV-1 genome. J Virol. 2007 doi: 10.1128/JVI.02447-06. [DOI] [PMC free article] [PubMed] [Google Scholar]
- 18.Kubat NJ, et al. The herpes simplex virus type 1 latency-associated transcript (LAT) enhancer/rcr is hyperacetylated during latency independently of LAT transcription. J Virol. 2004;78(22):12508–18. doi: 10.1128/JVI.78.22.12508-12518.2004. [DOI] [PMC free article] [PubMed] [Google Scholar]
- 19.Kubat NJ, et al. Specific histone tail modification and not DNA methylation is a determinant of herpes simplex virus type 1 latent gene expression. Journal of Virology. 2004;78(3):1139–49. doi: 10.1128/JVI.78.3.1139-1149.2004. [DOI] [PMC free article] [PubMed] [Google Scholar]
- 20.Pinnoji RC, et al. Repressor element-1 silencing transcription factor/neuronal restrictive silencer factor (REST/NRSF) can regulate HSV-1 immediate-early transcription via histone modification. Virol J. 2007;4:56. doi: 10.1186/1743-422X-4-56. [DOI] [PMC free article] [PubMed] [Google Scholar]
- 21.Knipe DM, Cliffe A. Chromatin control of herpes simplex virus lytic and latent infection. Nat Rev Microbiol. 2008;6(3):211–21. doi: 10.1038/nrmicro1794. [DOI] [PubMed] [Google Scholar]
- 22.Garza HH, Jr., Hill JM. Effect of a beta-adrenergic antagonist, propranolol, on induced HSV-1 ocular recurrence in latently infected rabbits. Curr Eye Res. 1997;16(5):453–8. doi: 10.1076/ceyr.16.5.453.7051. [DOI] [PubMed] [Google Scholar]
- 23.Hardwicke MA, Schaffer PA. Differential effects of nerve growth factor and dexamethasone on herpes simplex virus type 1 oriL- and oriS-dependent DNA replication in PC12 cells. J Virol. 1997;71(5):3580–7. doi: 10.1128/jvi.71.5.3580-3587.1997. [DOI] [PMC free article] [PubMed] [Google Scholar]
- 24.Marquart M, et al. Ocular reactivation phenotype of HSV-1 strain F(MP)E, a corticosteroid-sensitive strain. Curr Eye Res. 2003;26(3-4):205–9. doi: 10.1076/ceyr.26.3.205.14890. [DOI] [PubMed] [Google Scholar]
- 25.Noisakran S, et al. Role of the hypothalamic pituitary adrenal axis and IL-6 in stress-induced reactivation of latent herpes simplex virus type 1. J Immunol. 1998;160(11):5441–7. [PubMed] [Google Scholar]
- 26.Ajavon A, et al. Influence of thyroid hormone disruption on the incidence of shingles. Epidemiol Infect. 2015:1–15. doi: 10.1017/S0950268815000655. [DOI] [PMC free article] [PubMed] [Google Scholar]
- 27.Hsia SC, Bedadala GR, Balish MD. Effects of thyroid hormone on HSV-1 gene regulation: implications in the control of viral latency and reactivation. Cell Biosci. 2011;1(1):24. doi: 10.1186/2045-3701-1-24. [DOI] [PMC free article] [PubMed] [Google Scholar]
- 28.Hsia SH, Hsia SV. A Cohort Historical Analysis of the Relationship between Thyroid Hormone Malady and Alpha-Human Herpesvirus Activation. J Steroids Horm Sci. 2014;5(2):133. doi: 10.4172/2157-7536.1000133. [DOI] [PMC free article] [PubMed] [Google Scholar]
- 29.Varedi M, et al. Effects of hypo- and hyperthyroid states on herpes simplex virus infectivity in the rat. Endocr Res. 2014;39(2):50–5. doi: 10.3109/07435800.2013.808208. [DOI] [PubMed] [Google Scholar]
- 30.Yen PM. Physiological and molecular basis of thyroid hormone action. Physiol Rev. 2001;81(3):1097–142. doi: 10.1152/physrev.2001.81.3.1097. [DOI] [PubMed] [Google Scholar]
- 31.Lazar MA. Thyroid hormone receptors: multiple forms, multiple possibilities. Endocr Rev. 1993;14(2):184–93. doi: 10.1210/edrv-14-2-184. [DOI] [PubMed] [Google Scholar]
- 32.Hodin RA, Lazar MA, Chin WW. Differential and tissue-specific regulation of the multiple rat c-erbA messenger RNA species by thyroid hormone. J Clin Invest. 1990;85(1):101–5. doi: 10.1172/JCI114398. [DOI] [PMC free article] [PubMed] [Google Scholar]
- 33.Hodin RA, et al. Identification of a thyroid hormone receptor that is pituitary-specific. Science. 1989;244(4900):76–9. doi: 10.1126/science.2539642. [DOI] [PubMed] [Google Scholar]
- 34.Lebel JM, Dussault JH, Puymirat J. Overexpression of the beta 1 thyroid receptor induces differentiation in neuro-2a cells. Proc Natl Acad Sci U S A. 1994;91(7):2644–8. doi: 10.1073/pnas.91.7.2644. [DOI] [PMC free article] [PubMed] [Google Scholar]
- 35.Bedadala GR, et al. Thyroid hormone controls the gene expression of HSV-1 LAT and ICP0 in neuronal cells. Cell Res. 2010;20(5):587–98. doi: 10.1038/cr.2010.50. [DOI] [PMC free article] [PubMed] [Google Scholar]
- 36.Hsia SC, et al. Regulation of herpes simplex virus type 1 thymidine kinase gene expression by thyroid hormone receptor in cultured neuronal cells. J Neurovirol. 2010;16(1):13–24. doi: 10.3109/13550280903552412. [DOI] [PMC free article] [PubMed] [Google Scholar]
- 37.Figliozzi RW, et al. Thyroid hormone-dependent epigenetic suppression of herpes simplex virus-1 gene expression and viral replication in differentiated neuroendocrine cells. J Neurol Sci. 2014;346(1-2):164–73. doi: 10.1016/j.jns.2014.08.017. [DOI] [PMC free article] [PubMed] [Google Scholar]
- 38.Glauser L, Barakat Walter I. Differential distribution of thyroid hormone receptor isoform in rat dorsal root ganglia and sciatic nerve in vivo and in vitro. J Neuroendocrinol. 1997;9(3):217–27. doi: 10.1046/j.1365-2826.1997.d01-1088.x. [DOI] [PubMed] [Google Scholar]
- 39.Oppenheimer JH, Schwartz HL. Molecular basis of thyroid hormone-dependent brain development. Endocr Rev. 1997;18(4):462–75. doi: 10.1210/edrv.18.4.0309. [DOI] [PubMed] [Google Scholar]
- 40.Wrange O, Carlstedt-Duke J, Gustafsson JA. Purification of the glucocorticoid receptor from rat liver cytosol. J Biol Chem. 1979;254(18):9284–90. [PubMed] [Google Scholar]
- 41.Grontved L, et al. Transcriptional activation by the thyroid hormone receptor through ligand-dependent receptor recruitment and chromatin remodelling. Nat Commun. 2015;6:7048. doi: 10.1038/ncomms8048. [DOI] [PMC free article] [PubMed] [Google Scholar]
- 42.Yang L, Voytek CC, Margolis TP. Immunohistochemical analysis of primary sensory neurons latently infected with herpes simplex virus type 1. J Virol. 2000;74(1):209–17. doi: 10.1128/jvi.74.1.209-217.2000. [DOI] [PMC free article] [PubMed] [Google Scholar]
- 43.Mehta A, et al. In situ DNA PCR and RNA hybridization detection of herpes simplex virus sequences in trigeminal ganglia of latently infected mice. Virology. 1995;206(1):633–40. doi: 10.1016/s0042-6822(95)80080-8. [DOI] [PubMed] [Google Scholar]
- 44.Wang K, et al. Laser-capture microdissection: refining estimates of the quantity and distribution of latent herpes simplex virus 1 and varicella-zoster virus DNA in human trigeminal Ganglia at the single-cell level. J Virol. 2005;79(22):14079–87. doi: 10.1128/JVI.79.22.14079-14087.2005. [DOI] [PMC free article] [PubMed] [Google Scholar]
- 45.Foster TP, Rybachuk GV, Kousoulas KG. Expression of the enhanced green fluorescent protein by herpes simplex virus type 1 (HSV-1) as an in vitro or in vivo marker for virus entry and replication. J Virol Methods. 1998;75(2):151–60. doi: 10.1016/s0166-0934(98)00107-4. [DOI] [PubMed] [Google Scholar]
- 46.Bedadala G, et al. Construction and Characterization of Recombinant HSV-1 Expressing Early Growth Response-1. ISRN Virol. 2014;2014 doi: 10.1155/2014/629641. [DOI] [PMC free article] [PubMed] [Google Scholar]
- 47.Chen F, et al. A Novel Thyroid Hormone Mediated Regulation of HSV-1 Gene Expression and Replication is Specific to Neuronal Cells and Associated with Disruption of Chromatin Condensation. SOJ Pharm Pharm Sci. 2014;1(1) doi: 10.15226/2374-6866/1/1/00106. [DOI] [PMC free article] [PubMed] [Google Scholar]
- 48.Watson S, et al. Determination of suitable housekeeping genes for normalisation of quantitative real time PCR analysis of cells infected with human immunodeficiency virus and herpes viruses. Virol J. 2007;4:130. doi: 10.1186/1743-422X-4-130. [DOI] [PMC free article] [PubMed] [Google Scholar]


