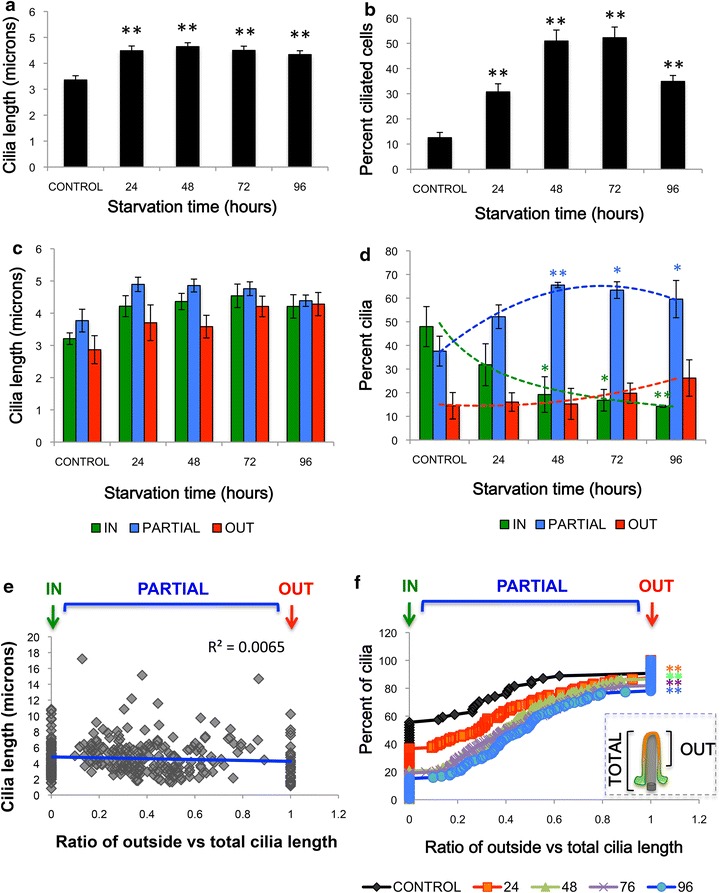
Fig. 3.

Quantification of stages of ciliogenesis over time. a Average cilia length (microns) over serum starvation time (hours) compared to serum control. b Average percent of ciliated cells over starvation time compared to serum control. c Quantification of average ciliary lengths of in, partial or out cilia. No significant (N.S.) differences were seen between groups. d Quantification of the average percent of in, partial or out cilia versus starvation time with dashed trend lines. Asterisk indicates p < 0.05, Two asterisks indicate p < 0.01 by Student’s t test compared to serum control. e Lack of correlation between cilia length and cilia emergence as measured by the ratio of the length of outside portion of cilia to the total cilia length. Outside cilia have a value of 1 due to complete overlap between outside and ciliary staining, while inside cilia were 0 due to the lack of outside staining. Partial cilia have different ratios depending on the depth of the ciliary pocket. Longer starvation times lead to a greater percent of cilia with higher outside: total ratios compared to serum control. f Cumulative distribution frequency of the percent of cilia with outside to total ciliary length ratios over 0–96 h of starvation time. Two asterisks indicate p < 0.01 by KS test compared to serum control
