The crystal structure of the substrate-recognition domain of an Fbs1 mutant was determined at a resolution of 2.3 Å. Comparison of the wild-type and mutant Fbs1 structures provides insight into the structural features of this carbohydrate-binding site.
Keywords: SCF E3 ubiquitin ligase, F-box protein, glycoproteins, sequence–structure relationship, Fbs1
Abstract
The SCF ubiquitin ligase comprises four components: Skp1, Cul1, Rbx1 and a variable-subunit F-box protein. The F-box protein Fbs1, which recognizes the N-linked glycoproteins, is involved in the endoplasmic reticulum-associated degradation pathway. Although FBG3, another F-box protein, shares 51% sequence identity with Fbs1, FBG3 does not bind glycoproteins. To investigate the sequence–structure relationship of the substrate-binding pocket, the crystal structure of a mutant substrate-binding domain of Fbs1 in which the six nonconserved regions (β1, β2–β3, β3–β4, β5–β6, β7–β8 and β9–β10) of Fbs1 were substituted with those of FBG3 was determined. The substrate-binding pocket of this model exhibits structural features that differ from those of Fsb1.
1. Introduction
The Skp1, Cul1, RING-finger protein (Rbx1) and F-box protein (SCF) complex, a member of the ubiquitin ligase family, uses a series of F-box proteins as substrate-binding subunits (Deshaies, 1999 ▸). Structurally, the substrate-binding domains (SBDs) of the F-box proteins are divided into three classes: FBXW, which contains WD-40 domains, FBXL, which contains leucine-rich repeats, and FBXO, which does not contain either of these domains (Jin et al., 2004 ▸). Fbs1, also known as FBG1 and FBXO2, is an FBXO family protein that recognizes high-mannose-type asparagine-linked carbohydrate chains (N-glycans). Fbs1 is a member of the endoplasmic reticulum-associated degradation-linked E3 ubiquitin ligase component (Yoshida et al., 2002 ▸). Biochemical and structural analyses have revealed that Fbs1 recognizes the innermost Man3GlcNAc2 in N-glycans as a marker of denatured proteins (Mizushima et al., 2004 ▸, 2007 ▸; Yoshida et al., 2005 ▸). Fbs1 belongs to a subfamily comprising at least five homologous proteins. Fbs1, Fbs2 (also known as FBG2 and FBXO6) and Fbs3 (also known as FBG5 and FBXO27) recognize high-mannose oligosaccharides (Yoshida, 2003 ▸). FBG3 (also known as FBXO44), another F-box protein, shares 51% sequence identity with Fbs1, and the residues necessary for binding to N-glycans in Fbs1 are conserved in FBG3. However, carbohydrate-binding activity of FBG3 has not been detected (Yoshida et al., 2011 ▸). The carbohydrate-binding site of Fbs1 comprises a small hydrophobic pocket located at the top of a β-sandwich, but the corresponding region of FBG3 exhibits a conformation different from that of Fbs1 (Mizushima et al., 2004 ▸, 2007 ▸; Kumanomidou et al., 2015 ▸). These conformational differences are caused by the distinct hydrogen-bond networks among the loops β2–β3, β5–β6, β7–β8 and β9–β10 (Kumanomidou et al., 2015 ▸). To investigate the structural differences between the loops of the SBDs of Fbs1 and FBG3 in detail, we determined the crystal structure of a mutant Fbs1 SBD in which the six nonconserved regions (β1, β2–β3, β3–β4, β5–β6, β7–β8 and β9–β10) in Fbs1 were substituted with those of FBG3. We compared the structure of this Fbs1 mutant with those of wild-type Fbs1 and FBG3.
2. Materials and methods
2.1. Macromolecule production
A DNA fragment encoding the SBD of Fbs1 (residues 117–297) in which the six nonconserved regions β1 (142–145), β2–β3 (156–168), β3–β4 (174–179), β5–β6 (215–222), β7–β8 (239–252) and β9–β10 (275–286) of Fbs1 were substituted with those of FBG3 (Fbs1 SBD loop-mutant 1) was designed with codons optimized for expression in Escherichia coli and synthesized by GeneArt (Life Technologies). The preparation of a second mutant SBD derived from Fbs1, in which the nonconserved regions β2–β3 (156–168), β5–β6 (215–220), β7–β8 (239–252) and β9–β10 (277–286) of Fbs1 were substituted with those of FBG3 (loop-mutant 2), has been described previously (Kumanomidou et al., 2010 ▸, 2015 ▸). DNA fragments were cloned into the expression plasmid pET-15b. The expression and purification of these recombinant Fbs1 SBD mutants has been described previously (Kumanomidou et al., 2015 ▸). Purified Fbs1 SBD loop-mutant 1 protein was concentrated to 3.6 mg ml−1 by ultrafiltration in 25 mM Tris–HCl pH 7.5, 1 mM dithiothreitol.
2.2. Crystallization
Crystallization of Fbs1 SBD loop-mutant 1 was performed using the sitting-drop vapour-diffusion method at 293 K. Drops consisted of a mixture of 1 µl protein solution and 1 µl reservoir solution consisting of 1%(w/v) tryptone, 0.05 M HEPES–Na pH 7.0, 20%(w/v) PEG 3350.
2.3. Data collection and processing
The crystals were cooled in reservoir solution supplemented with 20% glycerol as a cryoprotectant. X-ray diffraction data sets for Fbs1 SBD loop-mutant 1 were collected at 100 K on beamline BL44XU at SPring-8, Hyogo, Japan. Data processing and reduction were performed using HKL-2000 (Otwinowski & Minor, 1997 ▸). Data-collection and processing statistics for the crystals are given in Table 1 ▸.
Table 1. Data collection and processing.
Values in parentheses are for the outer shell.
| Diffraction source | BL44XU, SPring-8 |
| Wavelength (Å) | 0.9 |
| Temperature (K) | 100 |
| Detector | MAR300HE |
| Crystal-to-detector distance (mm) | 300 |
| Rotation range per image (°) | 1.0 |
| Total rotation range (°) | 180 |
| Exposure time per image (s) | 1.0 |
| Space group | P21 |
| a, b, c (Å) | 44.54, 96.20, 44.68 |
| α, β, γ (°) | 90, 101.90, 90 |
| Resolution range (Å) | 50–2.30 (2.34–2.30) |
| Total No. of reflections | 60930 |
| No. of unique reflections | 16552 |
| Completeness (%) | 99.9 (100.0) |
| Multiplicity | 3.7 (3.7) |
| 〈I/σ(I)〉 | 22.6 (4.7) |
| R merge (%) | 9.9 (43.6) |
| R meas † (%) | 11.6 (51.0) |
| Overall B factor from Wilson plot (Å2) | 26.6 |
R meas was estimated by multiplying the conventional R merge value by the factor [N/(N − 1)]1/2, where N is the data multiplicity.
2.4. Structure solution and refinement
The crystal structure of Fbs1 SBD loop-mutant 1 was determined using molecular replacement in MOLREP (Vagin & Teplyakov, 2010 ▸) from the CCP4 software suite (Winn et al., 2011 ▸). A model of wild-type Fbs1 SBD (PDB entry 1umh; Mizushima et al., 2004 ▸) in which β1 and loops β2–β3, β3–β4, β5–β6, β7–β8 and β9–β10 of Fsb1 were substituted with those of FBG3, which was constructed using the SWISS-MODEL homology-modelling server (Arnold et al., 2006 ▸), was used as the search model. The Fbs1 SBD loop-mutant 1 model was built automatically using Buccaneer (Cowtan, 2006 ▸), ARP/wARP (Perrakis et al., 1999 ▸) and LAFIRE (Yao et al., 2006 ▸), and was then subsequently improved through alternate cycles of manual rebuilding using Coot (Emsley et al., 2010 ▸) and refinement with REFMAC5 (Winn et al., 2003 ▸). Model validations were performed using PROCHECK (Laskowski et al., 1993 ▸). Structure-solution and refinement statistics for the crystal are given in Table 2 ▸. Structural figures were generated using PyMOL (DeLano, 2002 ▸).
Table 2. Structure solution and refinement.
Values in parentheses are for the outer shell.
| Resolution range (Å) | 39.80–2.30 (2.36–2.30) |
| Completeness (%) | 99.9 (100.0) |
| No. of reflections, working set | 15586 |
| No. of reflections, test set | 832 |
| Final R cryst (%) | 18.5 (25.4) |
| Final R free (%) | 26.6 (38.1) |
| No. of non-H atoms | |
| Protein | 2862 |
| Water | 93 |
| Total | 2955 |
| R.m.s. deviations | |
| Bonds (Å) | 0.016 |
| Angles (°) | 1.764 |
| Average B factors (Å2) | |
| Protein | 31.3 |
| Water | 28.7 |
| Ramachandran plot | |
| Most favoured (%) | 86.7 |
| Additionally allowed (%) | 12.0 |
| Generously allowed (%) | 1.3 |
2.5. In vitro RNase B binding assay
His-tagged protein pull-down assays were performed as described previously (Kumanomidou et al., 2015 ▸). In brief, 15 µg purified, His-tagged Fbs1 SBD was immobilized on 30 µl Ni–NTA agarose resin and was incubated with 10.7 µg RNase B (Sigma–Aldrich). Unbound materials were removed by rinsing with pull-down buffer (20 mM Tris–HCl pH 7.5, 20 mM imidazole, 500 mM NaCl). The bound Fbs1 SBD and RNase B were analyzed by SDS–PAGE with Coomassie Brilliant Blue staining.
3. Results and discussion
3.1. Overall structure of the Fbs1 SBD mutant
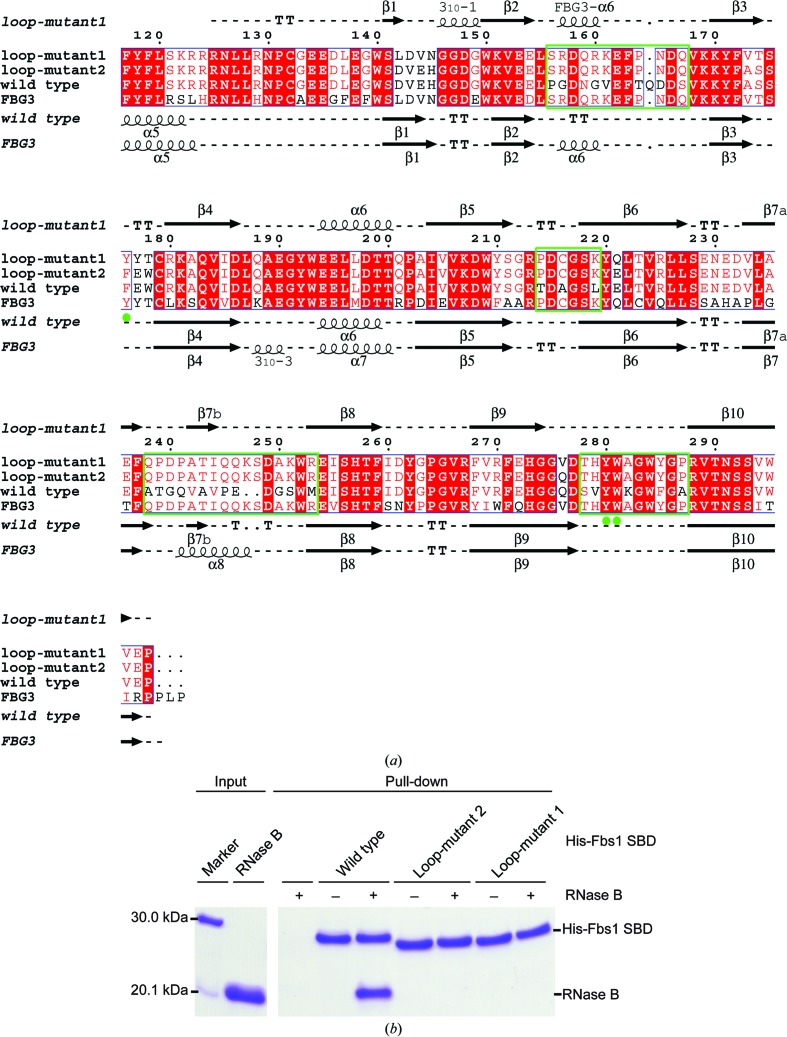
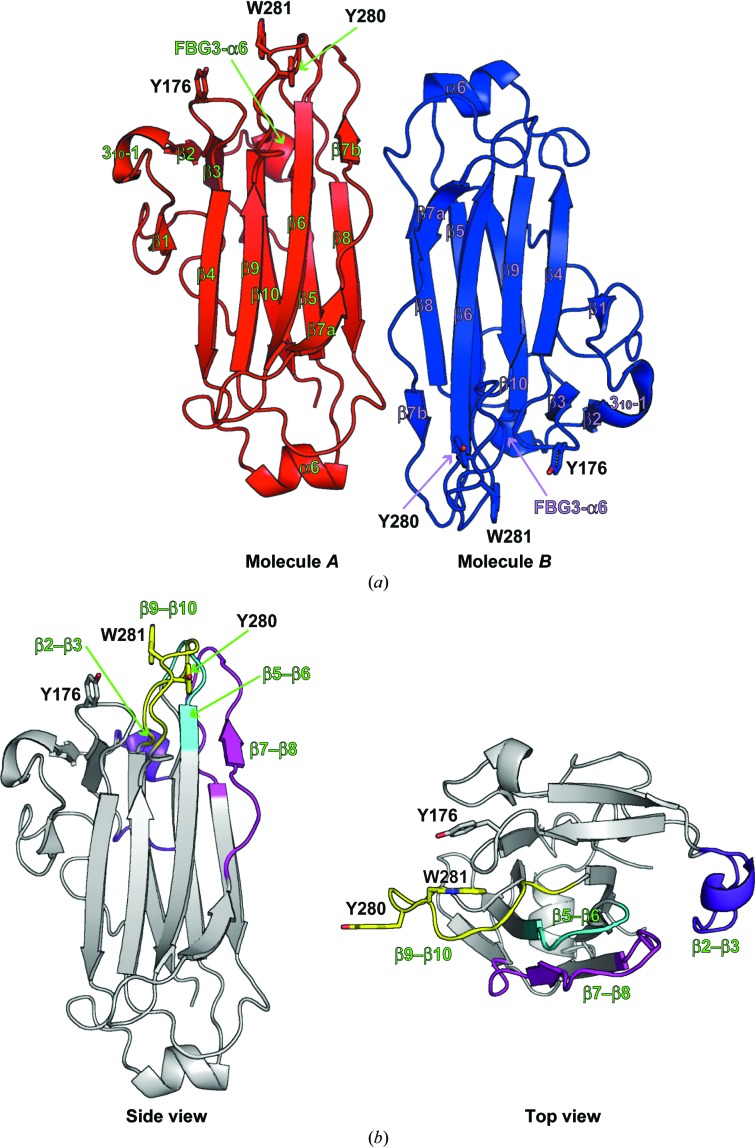
Our previous study of the crystal structure of Skp1–FBG3 revealed that the hydrogen-bond networks among the β2–β3, β5–β6 and β7–β8 loops of Fbs1 are necessary for the formation of the carbohydrate-binding pocket (Kumanomidou et al., 2015 ▸). To identify the differences in these loops (β2–β3, β5–β6 and β7–β8) between wild-type Fbs1 SBD and its mutant that cause the loss of glycoprotein-binding activity, we attempted to crystallize an Fbs1 SBD loop mutant (loop-mutant 2) with four loops mutated, but failed. Instead, we crystallized the six nonconserved regions mutant (loop-mutant 1; β1, β2–β3, β3–β4, β5–β6, β7–β8 and β9–β10) of Fbs1 SBD (see Fig. 1 ▸ a) and examined its glycoprotein-binding activity with an in vitro pull-down analysis using RNase B. As shown in Fig. 1 ▸(b), Fbs1 SBD loop-mutants 1 and 2 lost the capacity to bind glycoprotein. Therefore, we used Fbs1 SBD loop-mutant 1 for crystal structure analysis. The structure of Fbs1 SBD loop-mutant 1 was determined using the molecular-replacement method at 2.3 Å resolution (Figs. 2 ▸ a and 2 ▸ b). The final refined model contained two molecules in the asymmetric unit: molecule A (residues 125–298) and molecule B (residues 125–298) (Fig. 2 ▸ a). The overall structures of the two molecules are similar (r.m.s. deviation on Cα atoms of residues 125–298 of 0.287 Å). We use the structure of molecule A for the discussion below. The overall structure of Fbs1 SBD loop-mutant 1 is composed of a ten-stranded antiparallel β-sandwich, one 310-helix and two α-helices.
Figure 1.
Characterization of the interaction of the Fbs1 SBD with glycoprotein. (a) Sequence alignment and secondary-structural elements of wild-type Fbs1 SBD, loop-mutant 2, loop-mutant 1 and the FBG3 SBD. The secondary-structural assignment and depiction were generated using ESPript (Robert & Gouet, 2014 ▸). Sequence alignment was performed using ClustalW (Thompson et al., 2002 ▸). Red backgrounds and blue boxes indicate identical and similar residues, respectively. Four green boxes indicate the four regions of loop substitution (β2–β3, β5–β6, β7–β8 and β9–β10). The green closed circles indicate conserved residues within the substrate-binding pocket. The secondary structures of wild-type Fbs1 SBD and FBG3 SBD were based on the X-ray crystal structures of wild-type Fbs1 (PDB entry 1umh; Mizushima et al., 2004 ▸) and FBG3 (PDB entry 3wso; Kumanomidou et al., 2015 ▸), respectively. (b) In vitro RNase B binding activities of wild-type Fbs1 SBD, loop-mutant 2 and loop-mutant 1.
Figure 2.
Overall structure of Fbs1 SBD loop-mutant 1. (a) The asymmetric unit contains two Fbs1 SBD loop-mutant 1 molecules (molecule A, red; molecule B, blue). Secondary-structural elements are labelled. The residues of the carbohydrate-binding pocket are depicted as stick models. (b) Overall structure of molecule A. The four loops β2–β3, β5–β6, β7–β8 and β9–β10 are coloured blue, cyan, magenta and yellow, respectively.
3.2. Comparison of Fbs1 SBD loop-mutant 1 with wild-type Fbs1 and FBG3
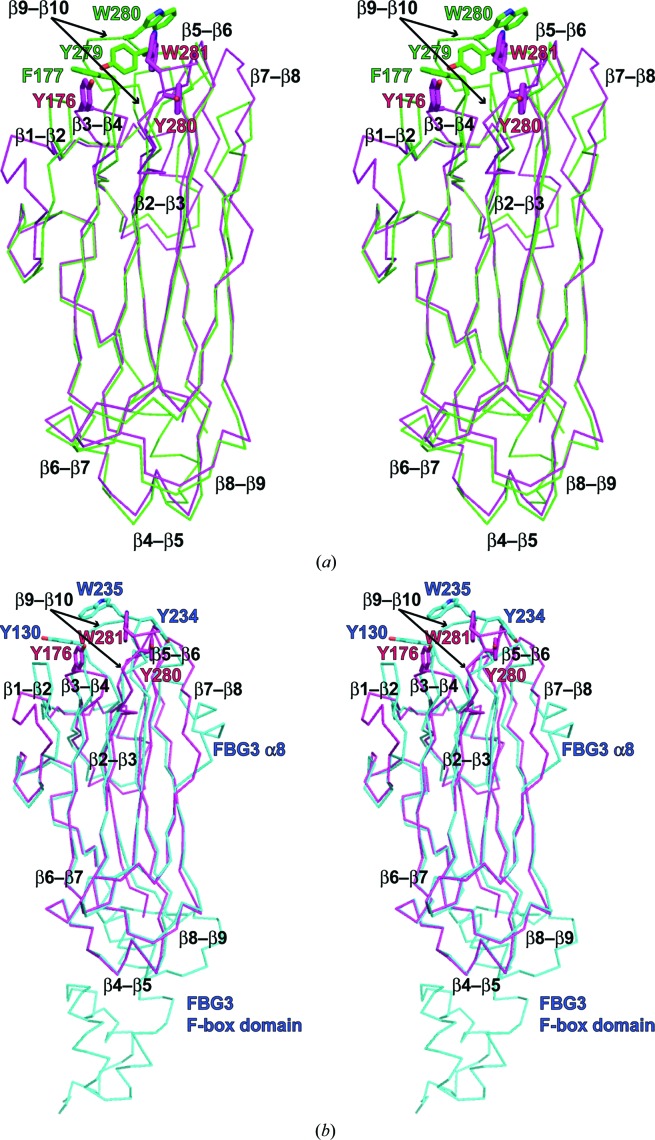
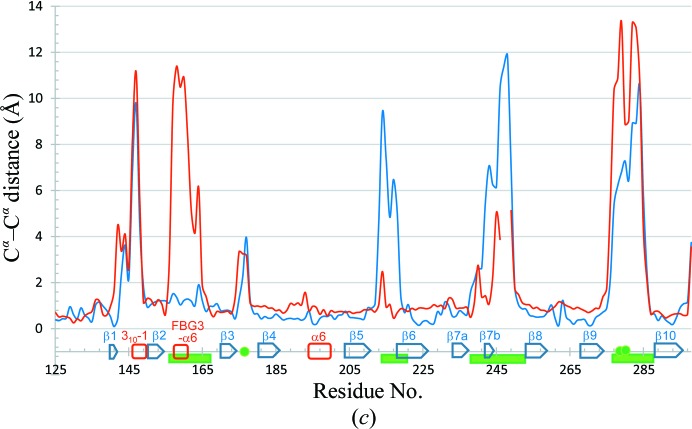
The overall structure of Fbs1 SBD loop-mutant 1 can be superposed on the previously reported structure of wild-type Fbs1 SBD alone with an average r.m.s. deviation of 3.59 Å for Cα atoms and on the SBD in the Skp1–FBG3 complex with an average r.m.s. deviation of 3.12 Å for Cα atoms (Figs. 3 ▸ a–3 ▸ c). However, differences can be seen. Considerable differences in the conformations of loops β2–β3, β7–β8 and β9–β10, strand β1 and helix 310-1 (residues 146–149) and FBG3 α6 (residues 157–160; part of loop β2–β3) can be seen between the wild-type Fbs1 SBD and its mutant (Figs. 3 ▸ a and 3 ▸ c). Although loops β5–β6, β7–β8 and β9–β10 and strands β1 and β7b (residues 242–244; the corresponding region in FBG3 forms helix α8) of Fbs1 SBD loop-mutant 1 and FBG3 have identical amino-acid sequences (Fig. 1 ▸ a), their structures are substantially different (Figs. 3 ▸ b and 3 ▸ c). Strands β1, β4, β6, β7 and β9 form a β-sheet in wild-type Fbs1 and FBG3. In Fbs1 SBD loop-mutant 1, β1 and the β1–β2 loop of wild-type Fbs1 and FBG3 have been replaced with random coil and the 310-1 helix, respectively.
Figure 3.
Comparison of Fbs1 SBD loop-mutant 1 with wild-type Fbs1 SBD and the SBD of FBG3. The structure overlay and calculation of r.m.s. deviation based on sequence alignment were performed using LSQKAB (Kabsch, 1976 ▸). PDB entries 1umh (Mizushima et al., 2004 ▸) and 3wso (Kumanomidou et al., 2015 ▸) were used for structural analysis as the SBDs of Fbs1 and FBG3, respectively. (a) Stereoview of the superimposed structures of Fbs1 SBD loop-mutant 1 (magenta) and wild type (green). (b) Stereoview of the superimposed structures of Fbs1 SBD loop-mutant 1 (magenta) and the SBD of FBG3 (cyan). The residues of the carbohydrate-binding pocket are shown as a stick model. (c) R.m.s. deviation on Cα atoms of residues between Fbs1 SBD loop-mutant 1 and the wild-type Fbs1 SBD (red line) and between Fbs1 SBD loop-mutant 1 and the SBD of FBG3 (blue line). β-Strands (blue arrows), helices (red boxes) and loop regions (green filled boxes) are depicted on the x axis. Filled green circles indicate the residues forming the carbohydrate-binding pocket.
3.3. Structure of the carbohydrate-binding pocket
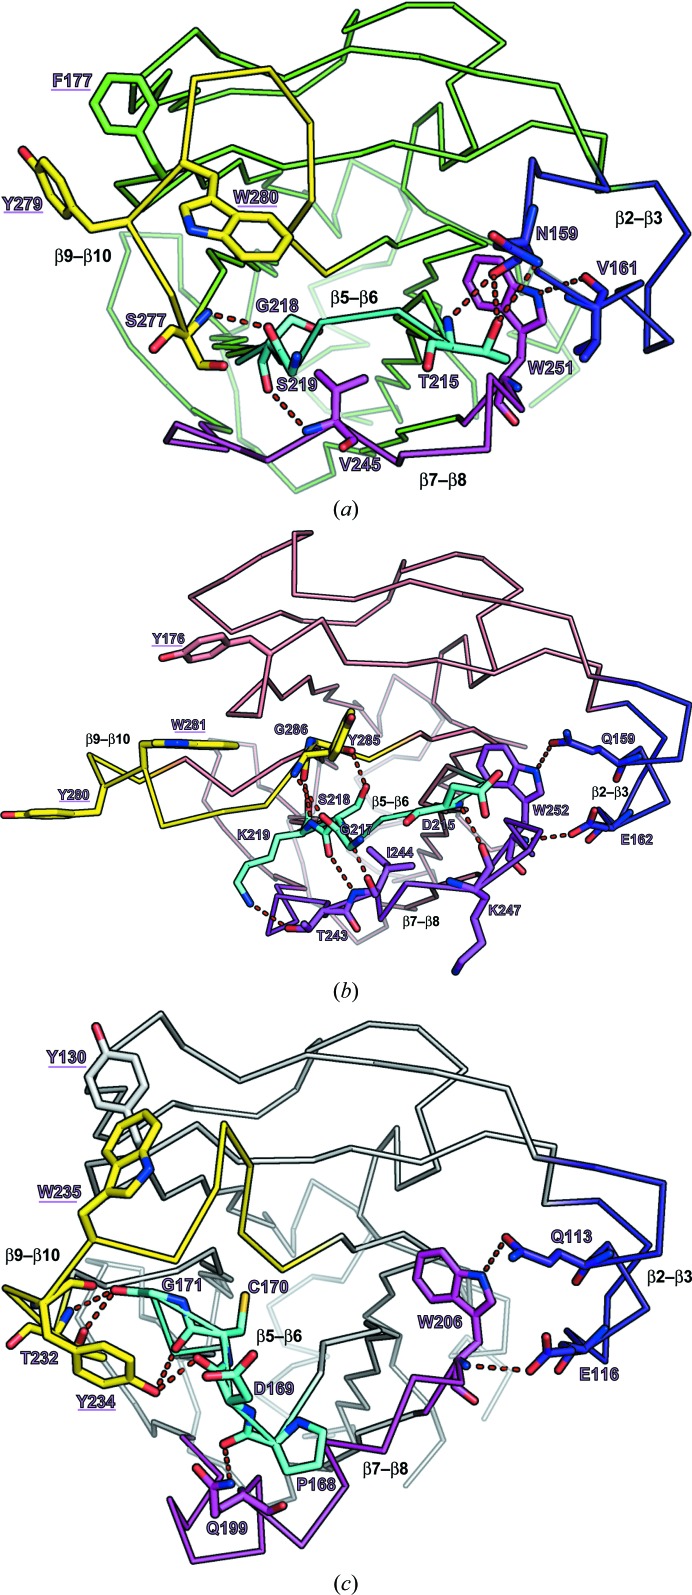
Four loops (β2–β3, β5–β6, β7–β8 and β9–β10) are important for forming the substrate-binding region (Kumanomidou et al., 2015 ▸). To understand the structural differences, we compared the structure of four loops from Fbs1 SBD loop-mutant 1 with those of wild-type Fbs1 and FBG3. While the structure of the β2–β3 loop is similar to that of FBG3, loops β5–β6, β7–β8 and β9–β10 exhibit different conformations (Figs. 4 ▸ a–4 ▸ c). Although loops β5–β6, β7–β8 and β9–β10 of loop-mutant 1 exhibit a parallel arrangement, loop β5–β6 of FBG3 is diagonal (Figs. 4 ▸ b and 4 ▸ c). Moreover, whereas the β7–β8 region of the wild type and loop-mutant 1 of Fbs1 SBD forms a β-strand (β7b), that of FBG3 forms an α-helix (α8). Strand β7b of loop-mutant 1 is located at the interface between molecule A and molecule B in the asymmetric unit (Supplementary Fig. S1). Loop β9–β10 of Fbs1 SBD loop-mutant 1 is stretched toward the outside relative to that of FBG3, and Tyr280 is placed far from Tyr176 and Trp281. Loop β9–β10 makes crystal contacts with symmetry-related molecules (molecules D and F). Tyr280 forms a hydrogen bond to Glu254 in molecule D, and Trp281 and Tyr285 form a π-stacking interaction with molecule F (Supplementary Fig. S2). In Fbs1 SBD loop-mutant 1, the structure of the carbohydrate-binding pocket comprises loops β3–β4 (Tyr176) and β9–β10 (Tyr280 and Trp281). However, the residues Tyr176, Tyr280 and Trp281 do not superpose well with the corresponding residues of Fbs1 (Phe177, Tyr279 and Trp280) or FBG3 (Tyr130, Tyr234 and Trp235) (Fig. 4 ▸ and Supplementary Fig. S1). The side chains of Tyr280 and Trp281 are located far away from those of Fbs1; the Cα–Cα distances are 8.9 and 9.0 Å, respectively. Furthermore, the side-chain orientations differ from those of Fbs1. The dihedral angles (χ1) of Tyr280 and Trp281 of Fbs1 SBD loop-mutant 1 are −71.1° and 171.3°, respectively, while those of Tyr279 and Trp280 of the wild type are −147.2° and −79.8°, respectively. The position of Tyr176 in Fbs1 SBD loop-mutant 1 is near that of Phe177 in the wild type. The Cα–Cα distance is 3.3 Å and the χ1 dihedral angles are −169.1°and 62.3°, respectively.
Figure 4.
Structures of the substrate-binding pockets of wild-type Fbs1 SBD (a), loop-mutant 1 (b) and the FBG3 SBD (c). Hydrogen bonds are represented as dashed red lines. Residues of hydrogen-bonding pairs and the carbohydrate-binding pocket are depicted as stick models. The four loops β2–β3, β5–β6, β7–β8 and β9–β10 are coloured blue, cyan, magenta and yellow, respectively.
These conformational differences in the carbohydrate-binding pocket are presumably caused by the hydrogen-bond networks among the loops β2–β3, β5–β6, β7–β8 and β9–β10. We investigated the hydrogen-bond networks in Fbs1 SBD loop-mutant 1 using the PyMOL graphical software (DeLano, 2002 ▸; Figs. 4a–4c). Different hydrogen-bond networks from the β5–β6 loop were observed (Figs. 5 ▸ a–5 ▸ c): while the hydrogen-bond network in FBG3 was found between Asp169, Cys170 and Gly171 in loop β5–β6 and Thr232 and Tyr234 in loop β9–β10, that of Fbs1 was found between Gly216 in loop β5–β6 and Ser277 in loop β9–β10 (Figs. 5 ▸ a–5 ▸ c). The numbers of hydrogen bonds between loops β5–β6 and β9–β10 in wild-type Fbs1, Fbs1 SBD loop-mutant 1 and FBG3 were one, three and four, respectively. These hydrogen bonds from loop β5–β6 were affected not only by the conformation of loop β9–β10 but also by the conformations of loops β2–β3 and β7–β8. These structures indicate that the substitution of loops in wild-type Fbs1 SBD could not produce the same regional structure as FBG3. Loop mutation caused the collapse of the carbohydrate-binding pocket at loop β9–β10 via hydrogen-bond networks from other loops.
Figure 5.
Schematic representation of the hydrogen-bond networks between loops β2–β3, β5–β6, β7–β8 and β9–β10 in wild-type Fbs1 SBD (a), loop-mutant 1 (b) and FBG3 (c). The four loops β2–β3, β5–β6, β7–β8 and β9–β10 are indicated in blue, cyan, magenta and yellow, respectively. The hydrogen bonds between each loop are indicated with red lines. The residues of the carbohydrate-binding pocket of wild-type Fbs1 SBD and the corresponding residues of loop-mutant 1 and the FBG3 SBD are underlined. The corresponding residues, based on sequence alignments of wild-type Fbs1 SBD and loop-mutant 1 or of Fbs1 SBD loop-mutant 1 and the SBD of FBG3, are located in the relative positions and are marked with asterisks.
4. Conclusion
We determined the crystal structure of Fbs1 SBD loop-mutant 1 at 2.3 Å resolution. Although Fbs1 SBD loop-mutant 1 and the SBD of FBG3 share substantial sequence homology (139 of 182 residues in Fbs1 SBD loop-mutant 1 are identical to those in the FBG3 SBD) and the amino-acid sequences of four loops (β2–β3, β5–β6, β7–β8 and β9–β10) are identical, the structures of three of four loops in Fbs1 SBD loop-mutant 1 exhibit different conformations. Our structural study of Fbs1 SBD loop-mutant 1 provides useful information to understand sequence–structure relationships.
Supplementary Material
PDB reference: substrate-recognition domain of an Fbs1 mutant, 5b4n
Supplementary Figures S1 and S2.. DOI: 10.1107/S2053230X16011018/nw5039sup1.pdf
Acknowledgments
We thank A. Yasuda for her help with the preparation and crystallization. This study was performed using synchrotron beamline BL44XU at SPring-8 under the Cooperative Research Program of the Institute for Protein Research, Osaka University (proposal Nos. 2013A6852, 2013B6852, 2014A6952, 2014B6952, 2015A6544 and 2015B6544). This work was supported in part by a Grant-in-Aid for Scientific Research on Innovative Areas from the Ministry of Education, Culture, Sports, Science and Technology of Japan (No. 24112009 to TM).
References
- Arnold, K., Bordoli, L., Kopp, J. & Schwede, T. (2006). Bioinformatics, 22, 195–201. [DOI] [PubMed]
- Cowtan, K. (2006). Acta Cryst. D62, 1002–1011. [DOI] [PubMed]
- DeLano, W. L. (2002). PyMOL. http://www.pymol.org.
- Deshaies, R. J. (1999). Annu. Rev. Cell Dev. Biol. 15, 435–467. [DOI] [PubMed]
- Emsley, P., Lohkamp, B., Scott, W. G. & Cowtan, K. (2010). Acta Cryst. D66, 486–501. [DOI] [PMC free article] [PubMed]
- Jin, J., Cardozo, T., Lovering, R. C., Elledge, S. J., Pagano, M. & Harper, J. W. (2004). Genes Dev. 18, 2573–2580. [DOI] [PMC free article] [PubMed]
- Kabsch, W. (1976). Acta Cryst. A32, 922–923.
- Kumanomidou, T., Nakagawa, T., Mizushima, T., Suzuki, A., Tokunaga, F., Iwai, K., Yoshida, Y., Tanaka, K. & Yamane, T. (2010). Acta Cryst. F66, 95–98. [DOI] [PMC free article] [PubMed]
- Kumanomidou, T., Nishio, K., Takagi, K., Nakagawa, T., Suzuki, A., Yamane, T., Tokunaga, F., Iwai, K., Murakami, A., Yoshida, Y., Tanaka, K. & Mizushima, T. (2015). PLoS One, 10, e0140366. [DOI] [PMC free article] [PubMed]
- Laskowski, R. A., MacArthur, M. W., Moss, D. S. & Thornton, J. M. (1993). J. Appl. Cryst. 26, 283–291.
- Mizushima, T., Hirao, T., Yoshida, Y., Lee, S. J., Chiba, T., Iwai, K., Yamaguchi, Y., Kato, K., Tsukihara, T. & Tanaka, K. (2004). Nature Struct. Mol. Biol. 11, 365–370. [DOI] [PubMed]
- Mizushima, T., Yoshida, Y., Kumanomidou, T., Hasegawa, Y., Suzuki, A., Yamane, T. & Tanaka, K. (2007). Proc. Natl Acad. Sci. USA, 104, 5777–5781. [DOI] [PMC free article] [PubMed]
- Otwinowski, Z. & Minor, W. (1997). Methods Enzymol. 276, 307–326. [DOI] [PubMed]
- Perrakis, A., Morris, R. & Lamzin, V. S. (1999). Nature Struct. Biol. 6, 458–463. [DOI] [PubMed]
- Robert, X. & Gouet, P. (2014). Nucleic Acids Res. 42, W320–W324. [DOI] [PMC free article] [PubMed]
- Thompson, J. D., Gibson, T. J. & Higgins, D. G. (2002). Curr. Protoc. Bioinformatics, Unit 2.3. 10.1002/0471250953.bi0203s00. [DOI] [PubMed]
- Vagin, A. & Teplyakov, A. (2010). Acta Cryst. D66, 22–25. [DOI] [PubMed]
- Winn, M. D. et al. (2011). Acta Cryst. D67, 235–242.
- Winn, M. D., Murshudov, G. N. & Papiz, M. Z. (2003). Methods Enzymol. 374, 300–321. [DOI] [PubMed]
- Yao, M., Zhou, Y. & Tanaka, I. (2006). Acta Cryst. D62, 189–196. [DOI] [PubMed]
- Yoshida, Y. (2003). J. Biochem. 134, 183–190. [DOI] [PubMed]
- Yoshida, Y., Adachi, E., Fukiya, K., Iwai, K. & Tanaka, K. (2005). EMBO Rep. 6, 239–244. [DOI] [PMC free article] [PubMed]
- Yoshida, Y., Chiba, T., Tokunaga, F., Kawasaki, H., Iwai, K., Suzuki, T., Ito, Y., Matsuoka, K., Yoshida, M., Tanaka, K. & Tai, T. (2002). Nature (London), 418, 438–442. [DOI] [PubMed]
- Yoshida, Y., Murakami, A. & Tanaka, K. (2011). Biochem. Biophys. Res. Commun. 410, 24–28. [DOI] [PubMed]
Associated Data
This section collects any data citations, data availability statements, or supplementary materials included in this article.
Supplementary Materials
PDB reference: substrate-recognition domain of an Fbs1 mutant, 5b4n
Supplementary Figures S1 and S2.. DOI: 10.1107/S2053230X16011018/nw5039sup1.pdf


