Abstract
Autophagy has been investigated for its involvement in inflammatory diseases, but its role in asthma has been little studied. This study aimed to explore the possible role of autophagy and its therapeutic potential in severe allergic asthma. BALB/c mice were sensitized with ovalbumin (OVA) on days 0 and 14, followed by primary OVA challenge on days 28–30. The mice received a secondary 1 or 2% OVA challenge on days 44–46. After the final OVA challenge, the mice were assessed for airway responsiveness (AHR), cell composition and cytokine levels in bronchoalveolar lavage fluid (BALF). LC3 expression in lung tissue was measured by western blot and immunofluorescence staining. Autophagosomes were detected by electron microscopy. 3-Methyladenine (3-MA) treatment and Atg5 knockdown were applied to investigate the potential role of autophagy in allergic asthma mice. AHR, inflammation in BALF and LC3 expression in lung tissue were significantly increased in the 2% OVA-challenged mice compared with the 1% OVA-challenged mice (P<0.05). In addition, eosinophils showed prominent formation of autophagosomes and increased LC3 expression compared with other inflammatory cells in BALF and lung tissue. After autophagy was inhibited by 3-MA and Atg5 shRNA treatment, AHR, eosinophilia, interleukin (IL)-5 levels in BALF and histological inflammatory findings were much improved. Finally, treatment with an anti-IL-5 antibody considerably reduced LC3 II expression in lung homogenates. Our findings suggest that autophagy is closely correlated with the severity of asthma through eosinophilic inflammation, and its modulation may provide novel therapeutic approaches for severe allergic asthma.
Introduction
Asthma is a globally increasing chronic airway disease characterized by airway hyperresponsiveness (AHR) and inflammation as a result of molecular and cellular responses. A variety of inflammatory cells are involved in the pathogenesis of asthma, including dendritic cells, mast cells, eosinophils and lymphocytes.1, 2, 3 The current focus of asthma treatment is on anti-inflammatory drugs, especially inhaled corticosteroids, which are the most effective type. Despite the overall effectiveness of these types of drugs, they fail to control asthma in some patients.4 These patients with severe asthma constitute <10% of asthma patients but consume a large proportion of medical resources because of their high mortality and morbidity.5, 6, 7, 8, 9
Eosinophils are key inflammatory cells that play an important role in the augmentation of AHR, mucus production and airway remodeling in allergic asthma. Numerous clinical studies have revealed that blood eosinophil counts correlate with the severity of allergic asthma,10 and immune staining of the bronchial mucosa of severe allergic asthmatic patients has revealed large numbers of activated eosinophils and eosinophilic activation markers during asthma exacerbations.11 Moreover, therapeutic strategies to control eosinophilic airway inflammation have been associated with a decreased frequency of asthma exacerbations.12 Thus, treatments targeting eosinophils could be an effective way to control severe allergic asthma.
Autophagy, an evolutionarily and highly conserved process in virtually all eukaryotic cells, involves the sequestration and degradation of intracellular pathogens and compromised organelles. Autophagy regulates many critical biological processes and diseases.13, 14 Genetic variants in the autophagy gene Atg5 are associated with promotion of airway remodeling and loss of lung function in childhood asthma.15, 16 Electron microscopic examination has shown double-membrane autophagosome formation in fibroblasts from severe asthmatic patients and has provided direct evidence of autophagy in severe asthma pathogenesis.17
Despite the evidence supporting a role for autophagy in immune responses and inflammatory diseases, there have been few studies on the role of autophagy in asthma, and apparently no studies have sought to evaluate the association of autophagy with eosinophils in allergic asthma. Therefore, in this study, we evaluated the role of autophagy in asthma, especially the relationship between autophagic protein expression and asthma severity in an OVA-specific mouse model of severe allergic asthma. We also investigated the alterations in autophagy response to a variety of therapeutic agents, including autophagy inhibitors, glucocorticoids, montelukast, anti-IgE and anti-IL-5 antibodies.
Materials and methods
Mice
Female 6-week-old BALB/c mice weighing 20±2 g were purchased from Jackson Laboratory (Bar Harbor, ME, USA). All mice were housed under specific pathogen- and OVA-free conditions and maintained on a 12-h light–dark cycle with food and water ad libitum.
Ethics statement
All experimental animals used in this study were maintained under a protocol approved by the Institutional Animal Care and Use Committee of Ajou University (AMC-152 [IACUC-152]).
Sensitization and challenge
The experimental protocol for allergen sensitization and challenge was as follows. First, mice were sensitized intraperitoneally with 10 μg of OVA (Fisher Scientific, Pittsburgh, PA, USA) emulsified in 1 mg of alum (Imject Alum; Pierce, Rockford, IL, USA) on days 0 and 14. For the primary challenge, mice were subjected to airway allergen challenges by exposure to OVA aerosols (0.2% in saline) for 20 min on days 28–30 with an ultrasonic nebulizer (NE-U22, Omron, Kyoto, Japan). This was followed by a secondary challenge (1 or 2% OVA in saline for 20 min) 2 weeks after the last primary allergen challenge on days 44–46. All the experiments in our study were repeated three times, and each group consisted of six mice.
Treatment protocol
All drugs were administered before the secondary challenge: 15 mg kg−1 3-methyladenine (3-MA), 1 mg kg−1 dexamethasone and 10 mg kg−1 montelukast were injected intraperitoneally in mice 30 min before the secondary OVA challenges on days 44–46. Control mice were intraperitoneally injected with PBS.
In addition, anti-IL-5 (5 mg kg−1, BD, PharMingen, CA, USA) and anti-IgE antibodies (5 mg kg−1, BD, PharMingen) were administered intranasally into lightly anesthetized mice on day 43. Control animals received similar amounts of rat IgG antibody (Sigma, St Louis, MO, USA).
Airway resistance measurement
The airway resistance to inhaled methacholine (MCh; Sigma) was measured using the flexiVent System (SCIREQ, Montreal, QC, Canada) 48 h after the last OVA challenge. After the mice were anesthetized with an intraperitoneal injection of pentobarbital sodium (100 mg kg−1), a cannula was inserted via tracheotomy. The mice were connected to a computer-controlled, small-animal ventilator and ventilated with a tidal volume of 10 ml kg−1 at a frequency of 150 breaths per min. After baseline measurements, each mouse was challenged with MCh aerosol at increasing concentrations (0, 1.56, 3.12, 6.25, and 12.5 mg ml−1), and the peak airway responses to the inhaled MCh were recorded.
Bronchoalveolar lavage and lung histology
Bronchoalveolar lavage was performed immediately after assessing the AHR via the tracheal cannula with 1 ml of Hank's balanced salt solution. Leukocytes were quantified with a hemocytometer, and cell differentiation was performed on cytospin slides prepared with Wright–Giemsa stain. After bronchoalveolar lavage, the lungs were fixed in 10% formalin, embedded in paraffin and cut into 5-μm sections. The inflammatory and mucus-containing cells were quantified. Tissue sections were evaluated using ImageJ (National Institutes of Health, Bethesda, MD, USA). To detect inflammatory cells, sections were stained with hematoxylin and eosin (H&E), and the numbers of inflammatory cells per μm2 of perivascular and peribronchial areas were determined. In addition, mucus-containing cells were stained with periodic acid-Schiff (PAS). The number of mucus-containing cells per μm2 of basement membrane was determined. Masson's trichrome stain was performed to determine airway smooth muscle and collagen in the lungs. Airway smooth muscle thickness was quantified by assessing the thickness of the muscle layer surrounding the main bronchus.
Cytokine levels in lung bronchoalveolar lavage fluid
Bronchoalveolar lavage fluid (BALF) was centrifuged and the supernatant was frozen until further analysis. The levels of interleukin (IL)-4, IL-5, IL-13 and interferon (IFN)-γ in BALF were measured using a sandwich enzyme-linked immunosorbent assay (ELISA) according to the manufacturer's instructions (eBioscience, San Diego, CA, USA). The lower limits of detection were 3 pg ml−1 for IL-4 and IL-13, 7 pg ml−1 for IL-5 and 13 pg ml−1 for IFN-γ.
Measurement of LC3 expression
LC3 expression was analyzed using western blot analysis. Lung tissues were homogenized and lung lysates were prepared. Then, the protein samples (30 μg) were subjected to 10% SDS-polyacrylamide gel electrophoresis (SDS-PAGE) and transferred to nitrocellulose membranes. Membranes were blocked in a blocking buffer (5% milk in TBS plus Tween 20) for 1 h at room temperature. Then, the membranes were incubated in primary LC3 antibody from Cell Signaling Technology (Beverley, MA, USA).
Electron microscopy
We prepared cells and lung tissue for electron microscopy. Cells and lung tissue were immediately fixed with 2.5% glutaraldehyde/2% formaldehyde with 0.1 M sodium cacodylate and stored at 4 °C until embedding. Cells and lung tissue were post fixed with 2% osmium tetroxide; this was followed by an increasing gradient dehydration step using ethanol and propylene oxide. Cells and lung tissue were then embedded in LX-112 medium (Ladd) and ultra-thin (90 nm) sections were cut and placed on uncoated copper grids and were stained with 0.2% lead citrate and 1% uranyl acetate. Images were examined with a JEOL-1010 electron microscope (Jeol, Tokyo, Japan).
Atg5 knockdown
Knockdown of Atg5 gene expression was achieved through the use of lentiviral vector-mediated short hairpin RNA (shRNA) interference and shRNA was obtained from Seoul Bioscience (Seoul, Korea). The following shRNAs for Atg5 were cloned into lentiviral vectors: 5′-GCATTAAAGCAGCGTATC-3′ for shAtg5 number 1, 5′-GCATTAAAGCAGCGTATC-3′ for shAtg5 number 2 and 5′-GCATTAAAGCAGCGTATC-3′ for shAtg5 number 3. The anesthetized mice were treated with an intranasal instillation of 2 × 10⁶ or 3 × 10⁶ or 5 × 10⁶ IFU lentiviral vectors at 6 and 10 days before killing and the levels of LC3 and Atg5 expression after 6 days and 10 days were measured. Optimal conditions (5 × 10⁶ IFU at 10 days before killing) were selected during a preliminary study (Supplementary Figure 1).
Double immunofluorescence staining
To determine LC3 expression in eosinophils in BALF and lung tissue, double immunofluorescence staining of LC3 (Beverley, MA, USA) and eosinophil granule major basic protein (MBP; Santa Cruz Biotechnology, Santa Cruz, CA, USA) was performed on slides prepared from BALF and paraffin-embedded lung tissue. Slides were incubated overnight with primary LC3 and MBP antibodies, followed by incubation with the Alexa Fluor-488 and Alexa Fluor-594 secondary antibodies (Invitrogen, Carlsbad, CA, USA) for 1 h. The sections were then mounted with Vectashield (Vector Laboratories, Burlingame, CA, USA) containing DAPI. Cells were imaged and counted using a Zeiss (Oberkochen, Germany) LSM 510 confocal microscope (Zeiss, Oberkochen, Germany). To quantitatively examine autophagy, cells were counted based on the fluorescence of LC3 and MBP. More than 10 LC3 punctate dots were considered positive. For each experiment, positive cells were counted from 100 independent cells per sample. The experiments were performed both with and without autophagy inhibitors.
Data analysis
The results are presented as the mean±s.e.m. Data were compared using unpaired Student's t test or one-way analysis of variance using SPSS 21.0 (SPSS Inc., Chicago, IL, USA). Differences were considered statistically significant if the P-value was <0.05.
Results
Establishment of a severe asthma model
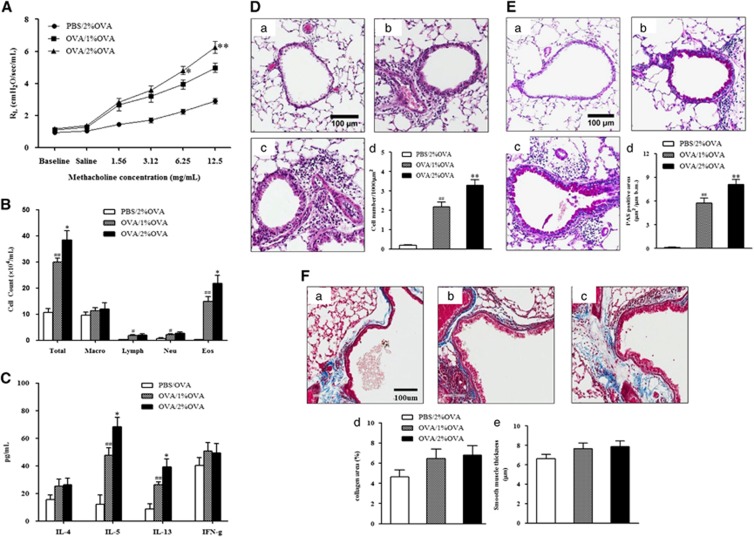
To study the role of autophagy in severe asthma, a severe allergic asthma model was established in mice. The degree of AHR and airway inflammation was analyzed after 1 or 2% OVA nebulization in OVA-sensitized and primary challenged mice. As shown in Figure 1A, the airway responsiveness to MCh was significantly higher in the 2% OVA-challenged mice than in the negative control or the 1% OVA-challenged mice (P<0.05). Regarding airway inflammation, the number of total inflammatory cells and eosinophils was significantly higher in BALF from the 2% OVA-challenged mice than in 1% OVA-challenged mice (P<0.05) (Figure 1B). IL-5 and IL-13 cytokine levels in BALF were also significantly higher in the 2% OVA-challenged mice than in the 1% OVA-challenged mice (P<0.05), but the IFN-γ level was not significantly different (Figure 1C).
Figure 1.
AHR, airway inflammation, cytokine levels and histological findings after nebulization with 1 or 2% OVA in OVA-sensitized and primary challenged mice. (A) Changes in lung resistance in response to increasing doses of methacholine were assessed 48 h after the final challenge. (B) Inflammatory cell counts in BALF. (C) Cytokine levels in BALF. (D) H&E-stained lung histology. (E) PAS-stained lung histology. (F) Masson's trichrome staining. (a) PBS/2% OVA-challenged mice. (b) OVA/1% OVA-challenged mice. (c) OVA/2% OVA-challenged mice. (d) Quantification of collagen. (e) Smooth muscle thickness. The data are expressed as the mean±s.e.m. **P<0.01 versus the OVA/2% OVA, ##P<0.01 versus the PBS/2% OVA, *P<0.05 versus the OVA/1% OVA, #P<0.05 versus the PBS/2% OVA. OVA, ovalbumin; BALF, bronchoalveolar lavage fluid.
Histological examination showed increased numbers of inflammatory cells located in the peribronchial and perivascular areas (P<0.01) and PAS+ mucus-containing goblet cells in 1 and 2% OVA-challenged mice compared to those of negative-control mice (P<0.01). Moreover, the 2% OVA-challenged mice showed significantly larger numbers of inflammatory cells and PAS+ mucus-containing goblet cells compared with those of the 1% OVA-challenged mice (P<0.01, Figures 1D and E). Masson's trichrome staining showed thickened smooth muscle layers and increased collagen deposition in the 1 and 2% OVA-challenged mice, but there was no significant difference between the 1 and 2% OVA-challenged mice (Figure 1F).
LC3 expression in the severe allergic asthma model
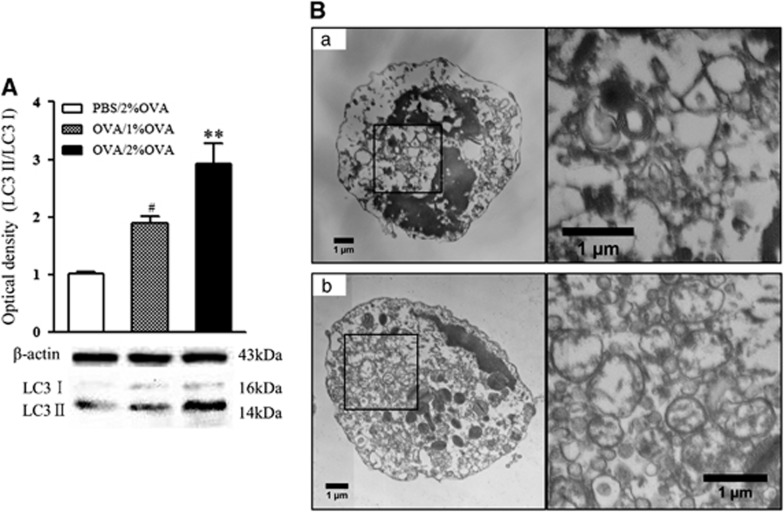
LC3 expression in lung homogenates was measured by western blotting. LC3 II, an indicator of autophagosome formation, was significantly increased in the 1 and 2% OVA-challenged mice compared with that of the negative-control mice (P<0.05, Figure 2A). Interestingly, this was more prominent in the 2% OVA-challenged group than in the 1% OVA-challenged group (P<0.01).
Figure 2.
LC3 expression in lung homogenates and detection of double-membrane autophagosomes in cells of BALF. (A) LC3 expression in lung homogenates of 1 and 2% OVA-challenged mice. The data are expressed as the mean±s.e.m. #P<0.01 versus the PBS/2% OVA, **P<0.05 versus the OVA/1% OVA. (B) Autophagosomes in cells of BALF. (a) PBS-sensitized negative-control mice. (b) 2% OVA-challenged severe allergic asthma mice. BALF, bronchoalveolar lavage fluid; OVA, ovalbumin; PBS, phosphate-buffered saline.
Electron microscopic findings
For precise confirmation of autophagosome formation in allergic asthma, electron microscopy was used. In agreement with the above results, double-membrane autophagosomes were more prominent in eosinophils from the 2% OVA-challenged mice compared with those of the negative-control mice (Figure 2B).
Improvement in AHR and airway inflammation by inhibition of autophagy
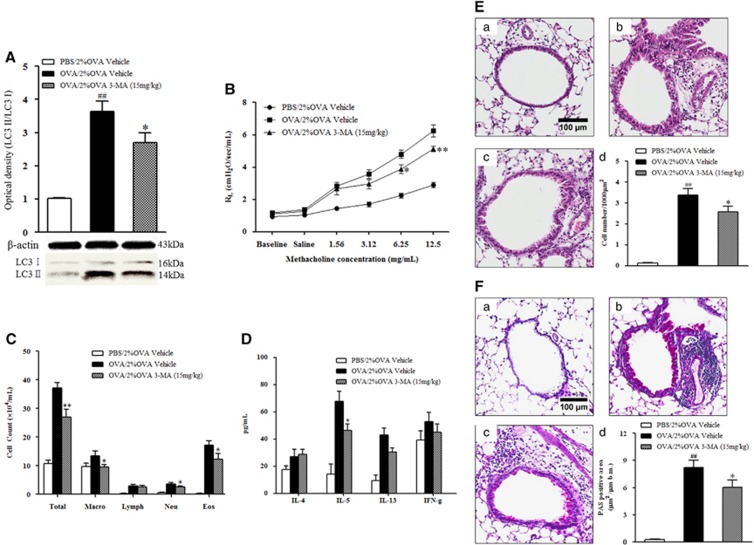
The findings presented above raise a question regarding the potential role of autophagy in severe allergic asthma. To answer this question, a well-known inhibitor of autophagy, 3-MA, was administered to 2% OVA-challenged mice. The administration of 3-MA significantly reduced the level of LC3 II expression (P<0.05, Figure 3A) and attenuated AHR compared with those of vehicle-treated mice (P<0.05, Figure 3B). The number of macrophages, neutrophils and eosinophils in BALF from the 3-MA-treated mice was also significantly reduced compared with that of the vehicle-treated mice (P<0.05, Figure 3C). As shown in Figure 3D, 3-MA treatment also attenuated the level of IL-5 in BALF (P<0.05), but there were no significant differences in IL-4, IL-13 or IFN-γ cytokine levels compared with vehicle treatment. Histological analysis of lung tissue sections revealed significantly decreased numbers of inflammatory cells (P<0.05) and PAS+ mucus-containing goblet cells (P<0.01, Figures 3E and F) in the 3-MA-treated mice.
Figure 3.
The effect of 3-MA treatment on LC3 expression, AHR and airway inflammation. (A) LC3 expression after 3-MA treatment. (B) Changes in lung resistance in response to increasing doses of methacholine were assessed 48 h after the final challenge. (C) Airway inflammatory cell counts in BALF. (D) Cytokine levels in BALF. (E) H&E-stained lung histology. (F) PAS-stained lung histology. (a) PBS/2% OVA-challenged mice. (b) OVA/1% OVA-challenged mice. (c) OVA/2% OVA-challenged mice. (d) Quantification of inflammatory cells or PAS-positive cells. The data are expressed as the mean±s.e.m. ##P<0.01 versus the PBS/2% OVA, *P<0.05 versus the OVA/2% OVA. BALF, bronchoalveolar lavage fluid; H&E, hematoxylin and eosin; OVA, ovalbumin; PAS, periodic acid-Schiff; PBS, phosphate-buffered saline; 3-MA, 3-Methyladenine.
Attenuation of AHR and airway inflammation by Atg5 knockdown
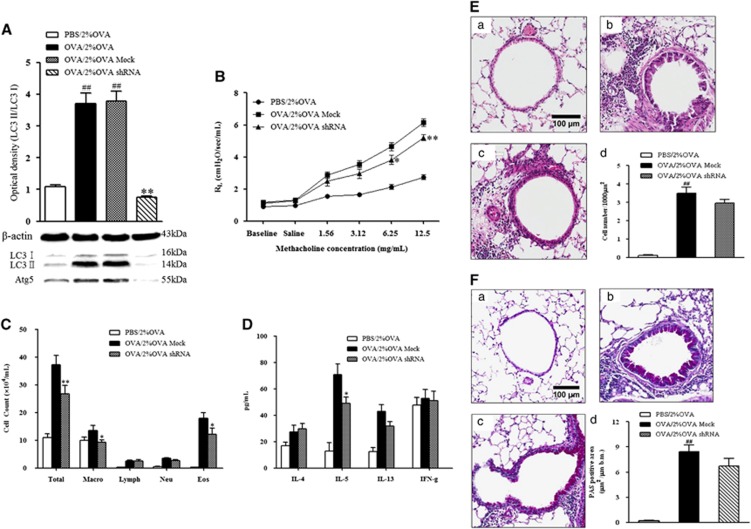
To obtain direct evidence that autophagy is associated with the pathogenesis of severe allergic asthma, we further investigated the autophagy inhibitory effect through knockdown of Atg5, one of the crucial genes in the autophagy process. The efficiency of the lentivirus infection was evaluated by analyzing the protein expression of Atg5. Infection with 4.5 × 10⁶ IFU Atg5-specific shRNAs optimally inhibited the protein expression of Atg5 (P<0.001, Figure 4A).
Figure 4.
The effect of Atg5 knockdown on LC3 expression, AHR, and airway inflammation. (A) LC3 expression after Atg5 knockdown. (B) Changes in lung resistance in response to increasing doses of methacholine were assessed 48 h after the final challenge. (C) Airway inflammatory cell counts in BALF. (D) Cytokine levels in BALF. (E) H&E-stained lung histology. (F) PAS-stained lung histology. (a) PBS/2% OVA-challenged mice. (b) OVA/1% OVA-challenged mice. (c) OVA/2% OVA challenged mice. (d) Quantification of inflammatory cells or PAS-positive cells. BALF, bronchoalveolar lavage fluid; H&E, hematoxylin and eosin; OVA, ovalbumin; PAS, periodic acid-Schiff; PBS, phosphate-buffered saline.
Atg5 knockdown significantly prevented the development of AHR in response to inhaled MCh (P<0.05, Figure 4B) and considerably reduced the number of eosinophils and the IL-5 level in BALF compared with mock virus-infected controls (P<0.05, Figures 4C and D).
Correlation between eosinophils and LC3 expression
Eosinophils are regarded as key inflammatory cells of allergic asthma, and high levels have been closely correlated with the severity of allergic asthma. Therefore, the correlation between the number of eosinophils in BALF and LC3 expression in lung homogenates was analyzed using Spearman's correlation. The eosinophil count was positively correlated with the expression of LC3 (P=0.016, R=0.732) but only in the 2% OVA-challenged mice (Supplementary Figure 2), not in the 1% OVA-challenged mice (data not shown).
Localization of autophagy in a severe asthma model
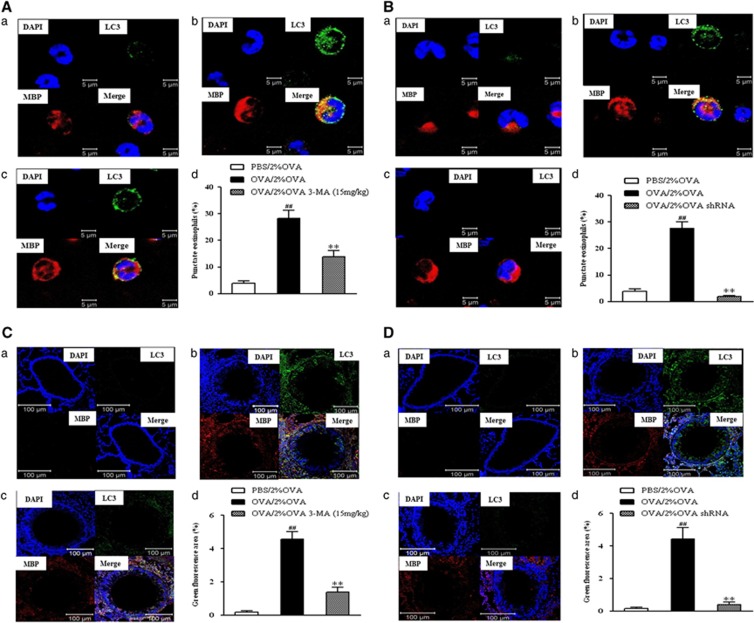
The distribution of LC3 particles, formation of which is indicative of autophagy, was evaluated in BALF cells and lung tissue. Double immunofluorescence analysis using LC3 (green signal) and MBP (red signal) antibodies showed increased autophagy in eosinophils in BALF from the 2% OVA-challenged mice. This increase was significantly suppressed by either 3-MA treatment (P<0.01, Figure 5A) or Atg5 knockdown (P<0.01, Figure 5B). In addition, examination of eosinophils in lung tissue also showed an increase in autophagy similar to that in BALF, which was almost completely blocked by 3-MA treatment or Atg5 knockdown (P<0.01, Figures 5C and D).
Figure 5.
Double-stained immunofluorescence for autophagy and eosinophils after 3-MA treatment (A, C) and Atg5 knockdown (B, D) in BALF and lung tissue. Double immunofluorescence analysis was performed using antibodies against LC3 (red) and MBP (green). (a) PBS/2% OVA-challenged mice. (b) OVA/2% OVA-challenged mice. (c) 3-MA treatment (A, c; C, c) and Atg5 knockdown (B, c; D, c) in OVA/2% OVA-challenged mice. (d) Quantification of punctate eosinophils. **P<0.01 versus OVA/2% OVA, ##P<0.01 versus PBS/2% OVA. BALF, bronchoalveolar lavage fluid; MBP, major basic protein; OVA, ovalbumin; PBS, phosphate-buffered saline; 3-MA, 3-Methyladenine.
The effect of asthma drugs on autophagic responses
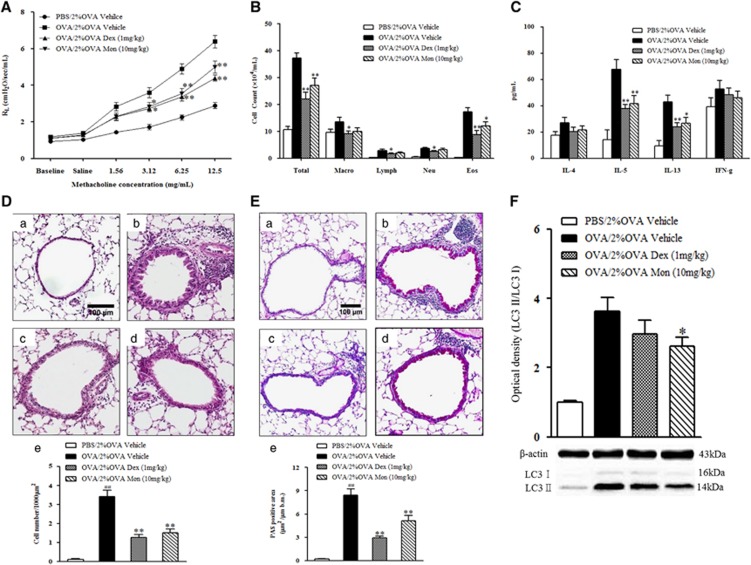
The effects of several asthma drugs, including dexamethasone, montelukast, and anti-IL-5 and anti-IgE antibodies, on increased autophagy were evaluated in severe allergic asthmatic mice. Administration of dexamethasone or montelukast significantly reduced AHR (P<0.05, Figure 6A), inflammatory cell count, and IL-5 and IL-13 levels in the BALF from the 2% OVA-challenged mice (P<0.05, Figures 6B and C). The therapeutic effects of these drugs were also confirmed in histologic studies that showed decreased numbers of inflammatory cells and mucus-containing cells (P<0.01, Figures 6D and E). However, montelukast treatment significantly reduced the expression of LC3 II, whereas dexamethasone did not (Figure 6F).
Figure 6.
The effect of dexamethasone and montelukast treatment on AHR, airway inflammation and LC3 expression. (A) Changes in lung resistance in response to increasing doses of methacholine were assessed 48 h after the final challenge. (B) Airway inflammatory cell counts in BALF. (C) Cytokine levels in BALF. (D) H&E-stained lung histology. (E) PAS-stained lung histology. (F) LC3 expression after dexamethasone and montelukast treatments. (a) PBS/2% OVA challenged mice. (b) OVA/2% OVA challenged mice. (c) Dexamethasone treatment in OVA/2% OVA-challenged mice. (d) Montelukast treatment in OVA/2% OVA-challenged mice. (e) Quantification of inflammatory cells or PAS-positive cells. The data are expressed as the mean±s.e.m. ##P<0.01 versus PBS/2% OVA, **P<0.01 versus OVA/2% OVA. AHR, airway hyperresponsivenessl; BALF, bronchoalveolar lavage fluid; Dex, dexamethasone; H&E, hematoxylin and eosin; Mon, montelukast; OVA, ovalbumin; PAS, periodic acid-Schiff; PBS, phosphate-buffered saline.
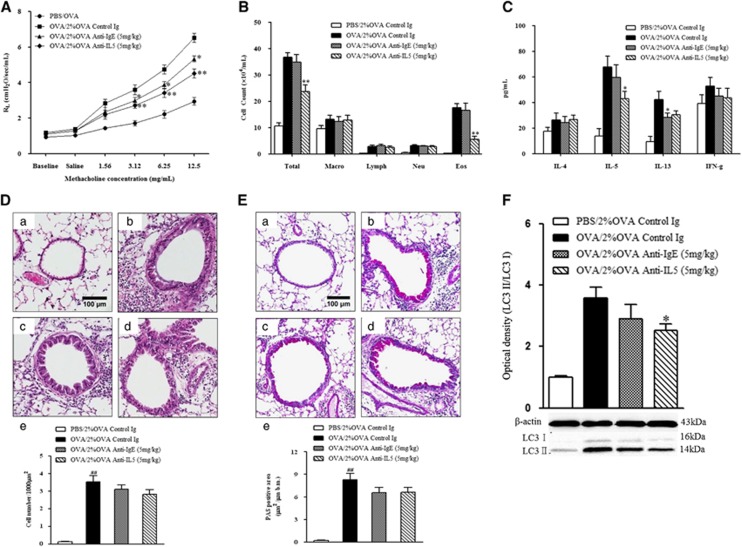
Anti-IL-5 or anti-IgE antibody treatment improved AHR (P<0.05, Figure 7A), whereas only anti-IL-5 treatment significantly reduced the number of eosinophils and the IL-5 levels in BALF (Figures 7B and C). Histological analysis demonstrated decreased inflammation and mucus production after anti-IL-5 or anti-IgE treatment (P<0.05, Figures 7D and E). Treatment with anti-IL-5 reduced the expression of LC3 II in lung homogenate (P<0.05), while treatment with anti-IgE did not (Figure 7F).
Figure 7.
The effect of anti-IgE and anti-IL-5 monoclonal antibody treatment on AHR, airway inflammation and LC3 expression. (A) Changes in lung resistance in response to increasing doses of methacholine were assessed 48 h after the final challenge. (B) Airway inflammatory cell counts in BALF. (C) Cytokine levels in BALF. (D) H&E-stained lung histology. (E) PAS-stained lung histology. (F) LC3 expression after dexamethasone and montelukast treatments. (a) PBS/2% OVA-challenged mice. (b) OVA/2% OVA-challenged mice. (c) Anti-IgE antibody treatment in OVA/2% OVA-challenged mice. (d) Anti-IL-5 antibody treatment in OVA/2% OVA challenged mice. (e) Quantification of inflammatory cells or PAS-positive cells. The data are expressed as the mean±s.e.m. ##P<0.01 versus PBS/2% OVA, **P<0.01 versus OVA/2% OVA. AHR, airway hyperresponsivenessl; BALF, bronchoalveolar lavage fluid; H&E, hematoxylin and eosin; OVA, ovalbumin; PAS, periodic acid-Schiff; PBS, phosphate-buffered saline.
Discussion
Asthma is a complex inflammatory disorder resulting from complex molecular and cellular responses. Although autophagy is involved in allergic inflammation, few studies have investigated its association with the presence and development of asthma. To date, the role of autophagy has not been fully addressed in asthma, especially severe allergic asthma. This study evaluated the role of autophagy in the pathogenesis of severe allergic asthma. Thus, we focused on eosinophils, the key inflammatory cells, in a mouse model of severe allergic asthma.
First, we established a 2% OVA-challenged severe allergic asthma model that showed significantly higher AHR, stronger Th2-type airway inflammation and more severe eosinophil infiltration compared with the 1% OVA-challenged mice, although subepithelial fibrosis was not apparent owing to the relatively short allergen challenge time. Eosinophilia has long been recognized as a pathologic feature in allergic asthma,10, 18 and its degree has been correlated with the clinical severity of allergic asthma,19 which is the reason we developed this severe asthma model in mice.
The involvement of autophagy has been reported in human biological processes as well as some inflammatory diseases.20, 21, 22, 23, 24, 25, 26 However, there have been very few previous studies regarding autophagy in asthma.15, 16, 17, 25, 27 A previous study found that five different autophagy-related single-nucleotide polymorphisms (SNPs), such as the SNP rs12212740 G>A of Atg5, were associated with loss of prebronchodilator FEV1 in asthmatic patients. Furthermore, electron microscopy has shown more double-membrane autophagosomes in fibroblasts and epithelial cells from bronchial biopsy tissue of asthmatic patients than in corresponding tissue of a healthy subject.17 Our study also found similar formation of double-membrane autophagosomes in BALF of severe allergic asthma mice. A previous study investigated the SNPs of Atg5 and Atg7 in childhood asthma and showed that 2 SNP variants, rs12201458 and rs510432, of Atg5 are associated with childhood asthma.15 Those studies have indicated the genetic relevance of autophagy in asthma. However, the quantification of functional proteins is of great importance in revealing a role for autophagy in asthma pathogenesis.
A recent study also showed higher autophagy levels in the sputum granulocytes, peripheral blood cells and peripheral blood eosinophils of severe asthma patients compared with patients with non-severe asthma and healthy controls.27 In our study, it was found that the LC3 expression level was significantly higher in severe allergic asthma than in mild asthma. This finding further emphasizes the potential role of autophagy in severe asthma.
To obtain definitive evidence of autophagy in severe asthma, we inhibited autophagy activity by 3-MA administration and Atg5 gene knockdown, which significantly suppressed the expression of LC3 II. LC3 II is an indicator of autophagy because LC3 protein converts from LC3 I to LC3 II during autophagosome formation. In addition, autophagy inhibition significantly improved AHR, reduced eosinophilia, and decreased IL-5 production, but not other Th2 cytokines, in BALF.
IL-5 is a key cytokine that prolongs eosinophil survival by delaying apoptotic death and enhances eosinophilic activity, contributing to eosinophilic airway inflammation in asthmatic patients.10, 28, 29, 30, 31 Because inhibition of autophagy decreased eosinophilia and IL-5 production, we focused on eosinophils in the next experiment of our study. Correlation analysis revealed a significant association between the number of eosinophils in BALF and LC3 protein expression in lung homogenates. In addition, immunofluorescence double staining with LC3 and MBP showed enhanced autophagy induction in eosinophils in both BALF and lung tissue in severe allergic asthma. Some non-eosinophilic cells in lung tissue also showed immunofluorescence staining for LC3 and MBP; however, these cells showed weak signals, whereas eosinophils showed strong signals. Furthermore, 3-MA administration and Atg5 knockdown decreased LC3 immunofluorescence staining in eosinophils. These findings indicate that autophagy may be closely associated with eosinophils in asthma.
Effective treatment of severe asthma is a major unmet need because of high mortality and morbidity and its significant socioeconomic burden. Monoclonal antibodies have become increasingly important therapeutic options in corticosteroid-resistant severe asthma. One target of monoclonal antibodies is IL-5, which affects eosinophilic survival and activation. For this reason, anti-IL-5 antibody therapy is beneficial, especially in eosinophilic severe asthmatic patients. In our study, treatment with an anti-IL-5 antibody showed an improvement in AHR and a decrease in the number of eosinophils in BALF and significantly reduced the LC3 expression in lung homogenates.
Finally, we examined the effects on the autophagy process of several currently used asthma drugs: dexamethasone, montelukast, anti-IL-5 and anti-IgE antibody. All 4 drugs decreased the level of LC3 expression; of the 4, anti-IL-5 had the greatest effect. This effect may result from autophagy being involved mainly in the eosinophils. In addition, anti-IL-5 caused the largest decrease in the number of eosinophils. Dexamethasone has been shown to induce autophagy in a murine T-cell lymphoma cell line.32 Liu et al.33 have shown increased autophagy after short-term glucocorticoid treatment in human chondrocytes. They also stated that although it depends on exposure time, persistent exposure to glucocorticoids causes a significant decrease in autophagy. In this study, dexamethasone treatment induced a slight decrease in autophagy similar to that observed in the aforementioned study by Liu et al. Increasing evidence has shown that severe asthma is a heterogeneous disease. Previous studies have attempted to define the phenotypes of severe asthma using a variety of clinical parameters. These parameters include pulmonary function, cytokine profiles, bronchial hyperresponsiveness and the number of eosinophils in the lung to determine clinical phenotypes and to establish a standard therapy for severe asthma.34, 35, 36 In this study, we determined that autophagy is involved in the severe eosinophilic asthma phenotype. Our results may provide useful information for standard therapies in different phenotypes of severe asthma.
This study has the following limitation. Our severe allergic asthma model did not show fibrosis, which is the hallmark of airway remodeling, although it clearly demonstrated extensive eosinophil infiltration, which is similar to the infiltration seen in severe allergic asthma in human patients.
Taken together, our results show that autophagy inhibition by 3-MA treatment and Atg5 knockdown decreased eosinophilia and the IL-5 level in BALF, while the administration of an IL-5 monoclonal antibody decreased the LC3 level and the number of eosinophils. The results of this study suggest that eosinophils may be the most greatly affected inflammatory cell in autophagy.
In summary, we have demonstrated a role for autophagy in severe allergic asthma and provided strong evidence for an association between autophagy and eosinophils. Therapeutic strategies to target autophagy may provide a new approach to treating severe asthma.
Acknowledgments
This study was supported by a grant from the Korean Health Technology R&D Project, Ministry of Health & Welfare, South Korea (HI14C2628).
Author contributions
J-NL, D-HS and THKT performed the experiments. Y-JC and H-SP designed and analyzed the study. YSS supervised all the steps as the corresponding author of this study.
The authors declare no conflict of interest.
Footnotes
Supplementary Information accompanies the paper on Experimental & Molecular Medicine website (http://www.nature.com/emm)
Supplementary Material
References
- Hamid Q, Tulic M. Immunobiology of asthma. Annu Rev Physiol 2009; 71: 489–507. [DOI] [PubMed] [Google Scholar]
- Boyce JA, Broide D, Matsumoto K, Bochner BS. Advances in mechanisms of asthma, allergy, and immunology in 2008. J Allergy Clin Immunol 2009; 123: 569–574. [DOI] [PMC free article] [PubMed] [Google Scholar]
- Umetsu DT, DeKruyff RH. The regulation of allergy and asthma. Immunol Rev 2006; 212: 238–255. [DOI] [PubMed] [Google Scholar]
- Olaguibel JM, Quirce S, Julia B, Fernandez C, Fortuna AM, Molina J et al. Measurement of asthma control according to Global Initiative for Asthma guidelines: a comparison with the Asthma Control Questionnaire. Respir Res 2012; 13: 50. [DOI] [PMC free article] [PubMed] [Google Scholar]
- Dolan CM, Fraher KE, Bleecker ER, Borish L, Chipps B, Hayden ML et al. Design and baseline characteristics of the epidemiology and natural history of asthma: Outcomes and Treatment Regimens (TENOR) study: a large cohort of patients with severe or difficult-to-treat asthma. Ann Allergy Asthma Immunol 2004; 92: 32–39. [DOI] [PubMed] [Google Scholar]
- Lommatzsch M, Virchow CJ. Severe asthma: definition, diagnosis and treatment. Dtsch Arztebl Int 2014; 111: 847–855. [DOI] [PMC free article] [PubMed] [Google Scholar]
- Custovic A, Johnston SL, Pavord I, Gaga M, Fabbri L, Bel EH et al. EAACI position statement on asthma exacerbations and severe asthma. Allergy 2013; 68: 1520–1531. [DOI] [PMC free article] [PubMed] [Google Scholar]
- Omachi TA, Iribarren C, Sarkar U, Tolstykh I, Yelin EH, Katz PP et al. Risk factors for death in adults with severe asthma. Ann Allergy Asthma Immunol 2008; 101: 130–136. [DOI] [PMC free article] [PubMed] [Google Scholar]
- Cisternas MG, Blanc PD, Yen IH, Katz PP, Earnest G, Eisner MD et al. A comprehensive study of the direct and indirect costs of adult asthma. J Allergy Clin Immunol 2003; 111: 1212–1218. [DOI] [PubMed] [Google Scholar]
- Kay AB. The role of eosinophils in the pathogenesis of asthma. Trends Mol Med 2005; 11: 148–152. [DOI] [PubMed] [Google Scholar]
- Corrigan CJ, Kay AB. T cells and eosinophils in the pathogenesis of asthma. Immunol Today 1992; 13: 501–507. [DOI] [PubMed] [Google Scholar]
- Green RH, Brightling CE, McKenna S, Hargadon B, Parker D, Bradding P et al. Asthma exacerbations and sputum eosinophil counts: a randomised controlled trial. Lancet 2002; 360: 1715–1721. [DOI] [PubMed] [Google Scholar]
- Levine B, Kroemer G. Autophagy in the pathogenesis of disease. Cell 2008; 132: 27–42. [DOI] [PMC free article] [PubMed] [Google Scholar]
- Levine B, Mizushima N, Virgin HW. Autophagy in immunity and inflammation. Nature 2011; 469: 323–335. [DOI] [PMC free article] [PubMed] [Google Scholar]
- Martin LJ, Gupta J, Jyothula SS, Butsch Kovacic M, Biagini Myers JM, Patterson TL et al. Functional variant in the autophagy-related 5 gene promotor is associated with childhood asthma. PLoS ONE 2012; 7: e33454. [DOI] [PMC free article] [PubMed] [Google Scholar]
- Poon A, Eidelman D, Laprise C, Hamid Q. ATG5, autophagy and lung function in asthma. Autophagy 2012; 8: 694–695. [DOI] [PubMed] [Google Scholar]
- Poon AH, Chouiali F, Tse SM, Litonjua AA, Hussain SN, Baglole CJ et al. Genetic and histologic evidence for autophagy in asthma pathogenesis. J Allergy Clin Immunol 2012; 129: 569–571. [DOI] [PMC free article] [PubMed] [Google Scholar]
- Poon A, Eidelman D, Martin J, Laprise C, Hamid Q. Pathogenesis of severe asthma. Clin Exp Allergy 2012; 42: 625–637. [DOI] [PubMed] [Google Scholar]
- Wang JL, Ren ZY, Xia JB, Huang S, Qi MH, Wang LM et al. The mechanism of airway inflammation in eosinophilic bronchitis and cough variant asthma. Zhonghua Jie He He Hu Xi Za Zhi 2011; 34: 433–437. [PubMed] [Google Scholar]
- Deretic V. Autophagy in innate and adaptive immunity. Trends Immunol 2005; 26: 523–528. [DOI] [PubMed] [Google Scholar]
- Xu Y, Eissa NT. Autophagy in innate and adaptive immunity. Proc Am Thorac Soc 2010; 7: 22–28. [DOI] [PMC free article] [PubMed] [Google Scholar]
- Singh R, Kaushik S, Wang Y, Xiang Y, Novak I, Komatsu M et al. Autophagy regulates lipid metabolism. Nature 2009; 458: 1131–1135. [DOI] [PMC free article] [PubMed] [Google Scholar]
- Nixon RA. The role of autophagy in neurodegenerative disease. Nat Med 2013; 19: 983–997. [DOI] [PubMed] [Google Scholar]
- Choi AM, Ryter SW, Levine B. Autophagy in human health and disease. N Engl J Med 2013; 368: 1845–1846. [DOI] [PubMed] [Google Scholar]
- Jyothula SS, Eissa NT. Autophagy and role in asthma. Curr Opin Pulm Med 2013; 19: 30–35. [DOI] [PubMed] [Google Scholar]
- White E, Karp C, Strohecker AM, Guo Y, Mathew R. Role of autophagy in suppression of inflammation and cancer. Curr Opin Cell Biol 2010; 22: 212–217. [DOI] [PMC free article] [PubMed] [Google Scholar]
- Ban GY, Pham DL, Trinh HK, Lee SI, Suh DH, Yang EM et al. Autophagy mechanisms in sputum and peripheral blood cells of patients with severe asthma: a new therapeutic target. Clin Exp Allergy 2015; 46: 48–59. [DOI] [PubMed] [Google Scholar]
- Foster PS, Hogan SP, Ramsay AJ, Matthaei KI, Young IG. Interleukin 5 deficiency abolishes eosinophilia, airways hyperreactivity, and lung damage in a mouse asthma model. J Exp Med 1996; 183: 195–201. [DOI] [PMC free article] [PubMed] [Google Scholar]
- Busse WW, Lemanske RF Jr. Asthma. N Engl J Med 2001; 344: 350–362. [DOI] [PubMed] [Google Scholar]
- Martinez FD, Vercelli D. Asthma. Lancet 2013; 382: 1360–1372. [DOI] [PMC free article] [PubMed] [Google Scholar]
- Takatsu K, Nakajima H. IL-5 and eosinophilia. Curr Opin Immunol 2008; 20: 288–294. [DOI] [PubMed] [Google Scholar]
- Harr MW, McColl KS, Zhong F, Molitoris JK, Distelhorst CW. Glucocorticoids downregulate Fyn and inhibit IP(3)-mediated calcium signaling to promote autophagy in T lymphocytes. Autophagy 2010; 6: 912–921. [DOI] [PMC free article] [PubMed] [Google Scholar]
- Liu N, Wang W, Zhao Z, Zhang T, Song Y. Autophagy in human articular chondrocytes is cytoprotective following glucocorticoid stimulation. Mol Med Rep 2014; 9: 2166–2172. [DOI] [PMC free article] [PubMed] [Google Scholar]
- Wenzel S. Severe asthma: from characteristics to phenotypes to endotypes. Clin Exp Allergy 2012; 42: 650–658. [DOI] [PubMed] [Google Scholar]
- Wenzel S. Severe asthma in adults. Am J Respir Crit Care Med 2005; 172: 149–160. [DOI] [PubMed] [Google Scholar]
- Hogan SP, Rosenberg HF, Moqbel R, Phipps S, Foster PS, Lacy P et al. Eosinophils: biological properties and role in health and disease. Clin Exp Allergy 2008; 38: 709–750. [DOI] [PubMed] [Google Scholar]
Associated Data
This section collects any data citations, data availability statements, or supplementary materials included in this article.


