

Abstract
Leptin is an adipose-secreted hormone that plays an important role in both metabolism and immunity. Leptin has been shown to induce Th1-cell polarization and inhibit Th2-cell responses. Additionally, leptin induces Th17-cell responses, inhibits regulatory T (Treg) cells and modulates autoimmune diseases. Here, we investigated whether leptin mediates its activity on T cells by influencing dendritic cells (DCs) to promote Th17 and Treg-cell immune responses in mice. We observed that leptin deficiency (i) reduced the expression of DC maturation markers, (ii) decreased DC production of IL-12, TNF-α, and IL-6, (iii) increased DC production of TGF-β, and (iv) limited the capacity of DCs to induce syngeneic CD4+ T-cell proliferation. As a consequence of this unique phenotype, DCs generated under leptin-free conditions induced Treg or TH17 cells more efficiently than DCs generated in the presence of leptin. These data indicate important roles for leptin in DC homeostasis and the initiation and maintenance of inflammatory and regulatory immune responses by DCs.
Keywords: Dendritic cell (DC), Leptin, Regulatory T (Treg) cells, Th1, Th2, Th17
Introduction
Adipose tissue secretes several biologically active molecules, known as adipokines, including leptin, resistin, and adiponectin. Adipokines can act as local (autocrine/paracrine) and systemic (endocrine) regulators of insulin sensitivity, immune responses, cardiovascular function, and many other physiologic processes [1]. Thus, leptin provides a critical link between the environment, metabolism, and immune function [2–4].
Leptin signals via the leptin receptor (ObR), which exists in several isoforms. Leptin receptors have identical extracellular domains, but only the long form of the leptin receptor (ObRb) has a long intracytoplasmic domain that signals through the janus kinase (Jak)/STAT pathway, leading to STAT3 phosphorylation [5]. Initial studies have shown that leptin-deficient (Lepob/ob) and leptin receptor deficient (Lepdb/db) transgenic mice have reduced numbers of leukocytes in peripheral lymphoid tissues and exhibit impaired immune responses [6]. Moreover, leptin accelerates the progression of several autoimmune diseases, including antigen-induced arthritis, experimental autoimmune encephalomyelitis (EAE), and colitis, and also accelerates transplant rejection [7–12]. In contrast, Lepob/ob mice are refractory to autoimmunity and transplant rejection [7–12]. Leptin modulates immune responses by acting on a variety of immune cells, including T cells, B cells, macrophages, and dendritic cells (DCs). Leptin also enhances proliferation and proinflammatory cytokine secretion by these leukocyte populations [13–17].
Antigen-presenting cells (APCs), including DCs, deliver antigens and produce cytokines, stimulating naïve CD4+ T cells to expand clonally and differentiate into proinflammatory T helper 1 (Th1), Th2, and Th17-cell subsets or anti-inflammatory regulatory T (Treg) cells [18]. Leptin has been shown to modulate this process [19, 20]. Lepdb/db mice have increased numbers of Treg cells and greater Treg-cell suppressive activity [21]. Moreover, CD4+ T cells from Lepdb/db mice proliferate less than wild-type (WT) CD4+ T cells in response to polyclonal anti-CD3/anti-CD28 stimulation [20]. Additionally, leptin (i) drives proinflammatory Th1-type immune responses [3, 22], (ii) inhibits Th2-cell-type polarization [7, 22], (iii) suppresses Treg-cell proliferation [23] and generation [7], and (iv) drives Th17-cell-type immune responses [12,24].
Classically, APCs activate CD4+ T cells through three signals: (i) cognate peptide antigens presented on major histocompatibility complex class II (MHC-II) molecules, (ii) costimulatory molecules (CD40, CD80, and CD86), and (iii) cytokines. All three signals shape the differentiation of naïve CD4+ T cells into effector CD4+ T-cell subsets [18]. However, DC maturation and survival is modulated by leptin through the activation of antiapoptotic nuclear factor-κB [25]. As a result, the treatment of DCs with leptin increases proinflammatory IL-12, IL-6, and IL-1β production and decreases anti-inflammatory IL-10 production [25]. Furthermore, both immature DC (iDC) and mature DC (mDC) bone marrow derived DCs (BMDCs) from Lepob/ob and Lepdb/db show decreased costimulatory molecule expression and are impaired in their ability to stimulate allogeneic T-cell proliferation in vitro [13].
Although leptin has been shown to directly affect DCs and CD4+ T-cell populations in APC-free systems [7,13,17,22,23,26], the impact of DC–leptin interactions on T-cell fate is not established. The results reported herein suggest that DCs generated in the absence of leptin have a unique profile that induces Treg cells or Th17 cells under specific in vitro conditions.
Results
Leptin is required for generation and complete maturation of DCs
As leptin is an important adipokine for DC generation and maturation [13, 25, 26], we first confirmed that the leptin receptor is expressed in DCs [13, 26]. CD11c+ cells in the spleen and lymph nodes (LNs) express the long form of the leptin receptor, ObRb (Supporting Information Fig. 1A). Moreover, leptin induces STAT3 phosphorylation in leukocytes (Supporting Information Fig. 1B). Furthermore, Lepob/ob mice had a lower percentage (Fig. 1A and B) and absolute number (Supporting Information Fig. 2) of CD11c+MHC-II+ cells when compared with WT control littermates (WT).
Figure 1.
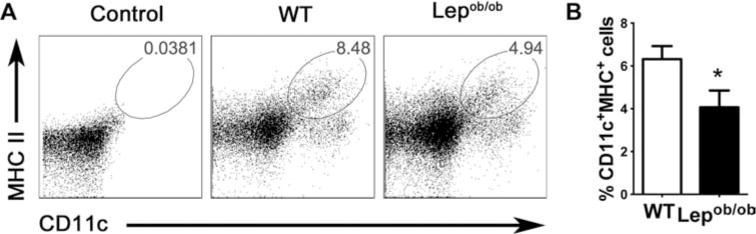
Leptin deficiency decreases LN DCs frequency. LN cells from not pooled leptin-deficient mice and WT mice were obtained, labeled with anti-CD11c and anti-MHC-II antibodies, and then analyzed by flow cytometry. Doublets were excluded from analysis and DCs were defined as CD11c+MHC-II+ cells. (A) DC frequency is shown in flow cytometry plots and is representative of one of two independent experiments each with five tested mice per group. (B) A summary bar graph showing the percentage of DCs from data obtained as in (A). The data shown are representative of one of two independent experiments each with five tested mice per group. The results are presented as mean +SEM of one of three experiments performed each with five tested mice per group. *p < 0.05. Nonparametric Student’s t-test (Mann–Whitney).
To further understand the effects of leptin on DC generation and maturation, we generated iDCs and mDCs from Lepob/ob mice and cultured these cells in the complete absence of leptin using autologous serum from the leptin-deficient mice (Lepob/ob). Autologous leptin-free serum was used in all experiments in order to prevent contamination with exogenous leptin that might be present in the fetal bovine serum (FBS). Moreover, using this model, we can compare iDCs and mDCs generated in the presence of recombinant leptin (rLep) (Lepob/obLep iDCs and mDCs) with those generated in the complete absence of leptin (Lepob/ob iDCs and mDCs).
Lepob/ob DCs generated in the absence of leptin exhibit a lower CD11c+MHC-II+ cell frequency as compared with the Lepob/obLep DCs and WT DCs (Fig. 2A), suggesting reduced maturation in the absence of leptin as previously described [13,26]. There was, however, no difference in absolute CD11c+ cell number (data not shown). To assess transcriptional changes between DCs differentiated in the presence and absence of leptin, we next analyzed WT DCs, Lepob/ob DCs, and Lepob/obLep DCs at the transcriptional and protein levels.
Figure 2.
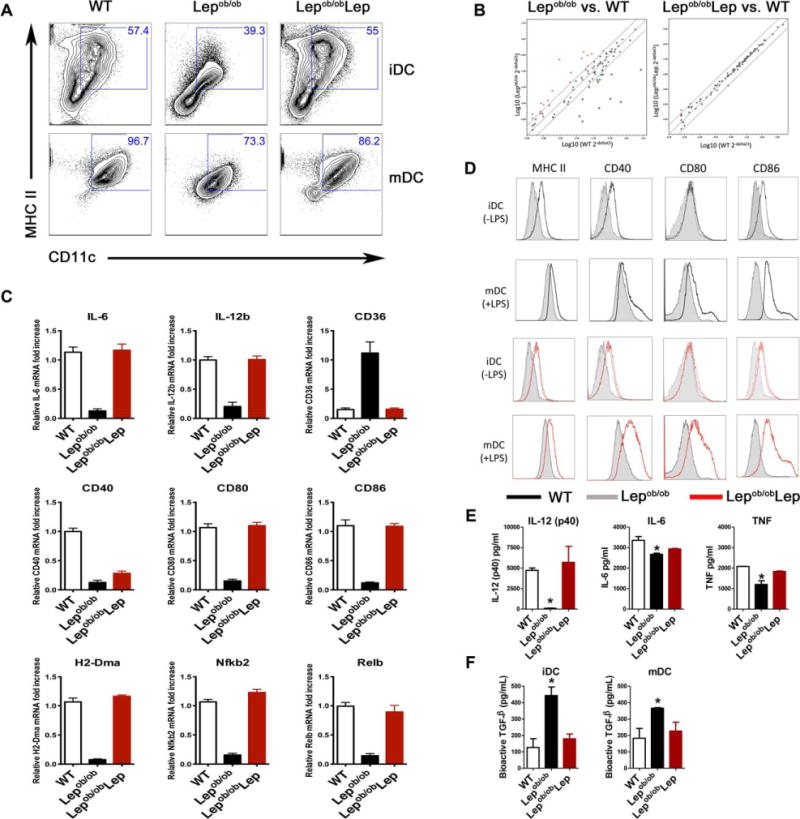
Leptin deficiency modulates BM-derived DC gene expression, phenotype, and cytokine production. (A) Nonadherent BM-derived DCs from WT or Lepob/ob mice were generated with (Lepob/obLep) or without (Lepob/ob) recombinant leptin. On day 7, iDCs were analyzed for CD11c and MHC-II expression by flow cytometry, or LPS (100 ng/mL) was added for an additional 2 days to induce DC maturation (mDC). Histograms show representative data from one of five independent experiments each with five tested mice per group. (B) Immature DCs (iDC) were obtained by harvesting nonadherent cells from Lepob/ob and control BMDC cultures on day 7. mRNA from each population was extracted, converted to cDNA, and analyzed using a real-time q-PCR-based microarray to detect the expression of DC- and APC-related genes. The levels of genes expressed in Lepob/ob DCs generated with or without recombinant leptin were compared with those expressed in WT control DCs. Data are representative of one of two independent experiments each with three tested mice per group. (C) mRNA levels of selected under- and overexpressed genes identified in (B) were analyzed individually by qPCR. Each sample was run in duplicate and the relative expression levels were determined using the 2−ΔΔCt method with normalization of target gene expression levels to GAPDH. (D) iDCs and mDCs generated on days 7 and 9, respectively, from Lepob/ob BMDC cultures in the complete absence (gray line) or presence of leptin (red line), or from WT BMDC cultures (black line) were evaluated for the expression of MHC-II and the costimulatory molecules CD40, CD80, and CD86 by flow cytometry. The DC population was defined by gating on the CD11c+ cells. Representative histograms from one of five independent experiments each with five tested mice per group are shown. (E) IL-12 (p40), IL-6, and TNF-α secretion by the mDCs was evaluated using a Bioplex assay after 2 days of maturation (n = 5 tested mice per group from one of three experiments). (F) The evaluation of bioactive TGF-β production by BMDCs. TGF-β production was evaluated in both the iDCs and mDCs by ELISA (n = 5 tested mice per group from one of three experiments). The results are presented as the means + SEM. *p < 0.05 (nonparametric Kruskal–Wallis test and nonparametric Mann–Whitney test).
DCs generated from the Lepob/ob mice had a gene expression profile that was distinct from that of DCs generated from WT mice (Fig. 2B, left panel), whereas Lepob/obLep DCs (Fig. 2B, right panel) had a gene expression profile that was similar to WT DCs. Specifically, Lepob/ob DCs had lower mRNA and protein expression of the costimulatory molecules CD40, CD80, and CD86 (Fig. 2C and D); the antigen-presentation molecules H2-Dma (histocompatibility 2, class II, locus DM) and MHC-II (Fig. 2C and D); the NF-κB pathway-related transcripts nfkb2 and Relb (Fig. 2C); and the proinflammatory cytokines IL-12, TNF, and IL-6 (Fig. 2C and E). In contrast, CD36 mRNA was increased in Lepob/ob compared to WT iDCs and mDCs (Fig. 2C). Once again, rLep restored the WT-like phenotype in Lepob/ob iDCs and mDCs. As reported by Lam et al. [13], DCs from leptin receptor deficient Lepdb/db mice expressed lower levels of MHC-II and costimulatory molecules (Supporting Information Fig. 3).
Since Lepob/ob DCs express lower levels of MHC-II and costimulatory molecules, we investigated whether Lepob/ob DCs also express more anti-inflammatory molecules. Surprisingly, compared to WT and Lepob/obLep DCs, Lepob/ob DCs expressed more bioactive TGF-β (Fig. 2F), but lower levels of IDO and PDL-1, and similar levels of IL-10 (Supporting Information Fig. 4). This indicates that TGF-β, but not IL-10, IDO, and PDL-1, may account for the anti-inflammatory properties of Lepob/ob DCs.
As DCs from Lepdb/db and Lepob/ob mice induce less proliferation in allogeneic CD4+ T cells as compared to WT DCs [13, 26], we asked whether this was also true when using syngeneic CD4+ T cells. Sorted syngeneic WT CD4+ T cells were co-cultured with anti-CD3 antibody and Lepob/ob, Lepob/obLep, or WT DCs for 5 days. Strikingly, Lepob/ob mDCs induced less CD4+ T-cell proliferation as compared to WT mDCs (Fig. 3A and B). In contrast, Lepob/obLep DCs induced similar proliferation of CD4+ T cells, as compared to WT mDCs, demonstrating that leptin plays an important role in promoting DC stimulatory capacity (Fig. 3A and B). Similar to Lepob/ob mDCs, Lepdb/db mDCs induced less syngeneic CD4+ T-cell proliferation than WT DCs (Supporting Information Fig. 5).
Figure 3.
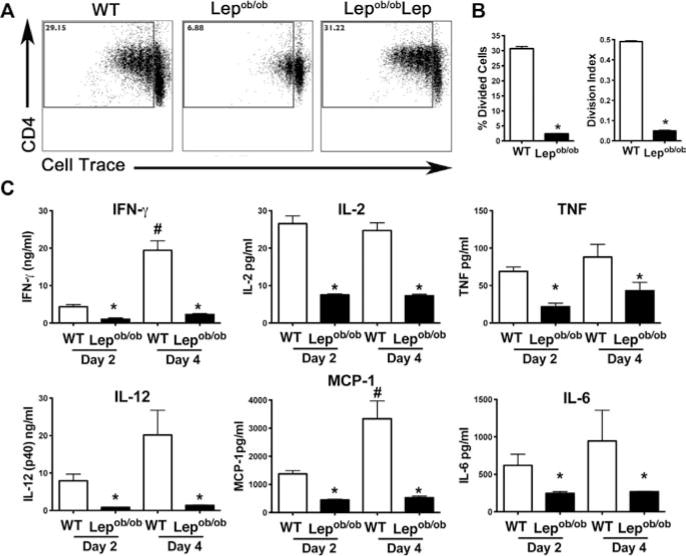
Lepob/ob BMDCs poorly stimulate syngeneic CD4+ T-cell proliferation as compared to WT BMDCs. (A) The proliferation of sorted splenic WT syngeneic responder CD4+ T cells was assessed to determine the immunostimulatory capacity of the DCs derived in the absence (Lepob/ob) or presence (Lepob/obLep and WT) of leptin. The Lepob/ob, Lepob/obLep, and WT mDCs were co-cultured with syngeneic Cell Trace Violet labeled CD4+ T cells plus anti-CD3 for 4 days. CD4+ T-cell proliferation was assessed by measuring Cell Trace Violet dilution by flow cytometry. Flow plots show representative data from one of three independent experiments each with three tested mice per group with similar results. (B) The percentage of divided cells and the division index were calculated with FlowJo 8.7 software. Data are shown as mean + SEM from one of three experiments each with three tested mice per group. (C) The cytokine concentrations in the supernatants of the CD4+ T cells co-cultured with BMDCs were evaluated with a Bioplex assay on days 2 and 4. The results are presented as the means + SEM of one of three independent experiments each with three tested mice per group with similar results. *p < 0.05 (nonparametric Kruskal–Wallis test).
As leptin is associated with Th1-cell responses [7, 15, 22], we next measured cytokine levels in DC-stimulated CD4+ T-cell cultures. The supernatant of Lepob/ob mDC-stimulated CD4+ T-cell cultures contained lower levels of Th1-cell-related cytokines (IFN-γ and IL-2) as well as other proinflammatory cytokines (IL-6, IL-12, TNF-α, and MCP-1) as compared to the supernatant of WT mDC-stimulated CD4+ T-cell cultures (Fig. 3C). In contrast, Lepob/obLep and WT mDC-stimulated CD4+ T-cell cultures contained similar cytokine levels (data not shown).
To exclude the possibility that leptin produced by DCs influences the co-culture assays by acting in an autocrine fashion, we first determined that WT iDC and mDC cultures contained 2–8 ng/mL of leptin (Supporting Information Fig. 6A). To determine whether this concentration of leptin affects DCs, we added 0–2000 ng/mL of rLep to Lepob/ob BMDCs cultured with autologous Lepob/ob leptin-free serum. Notably, the 10 ng/mL dose of leptin did not modify MHC-II and CD86 expression as compared to the 0 ng/mL control dose (Supporting Information Fig. 6B). Taken together, these findings demonstrate that leptin plays an important role in DC maturation and thus plays an important role in generating syngeneic CD4+ T-cell proliferative responses.
Lepob/ob DCs induce CD4+Foxp3+ T-cell differentiation and expansion in vitro
As Lepob/ob DCs secrete higher levels of bioactive TGF-β (Fig. 2F), we investigated their capacity to induce CD4+Foxp3+ T-cell differentiation from naïve precursors. We added Treg cell generating TGF-β and anti-CD3 to naïve CD4+ T cells (CD4+CD62L+CD44−Foxp3−) cultured with Lepob/ob iDCs or WT iDCs. Lepob/ob iDCs induced CD4+Foxp3+ T-cell differentiation more efficiently when compared with either WT and DCs and Lepob/obLep DCs (Fig. 4A and Supporting Information Fig. 7A). The addition of rLep to the culture did not affect CD4+Foxp3+ T-cell generation (Fig. 4A), although rLep did impair their proliferation at 500 ng/mL (Fig. 4B), consistent with previous observations [23]. A higher dose of rLep did, however, inhibit CD4+Foxp3+ T-cell generation (Supporting Information Fig. 7B) and decrease Foxp3 expression (Supporting Information Fig. 7C).
Figure 4.
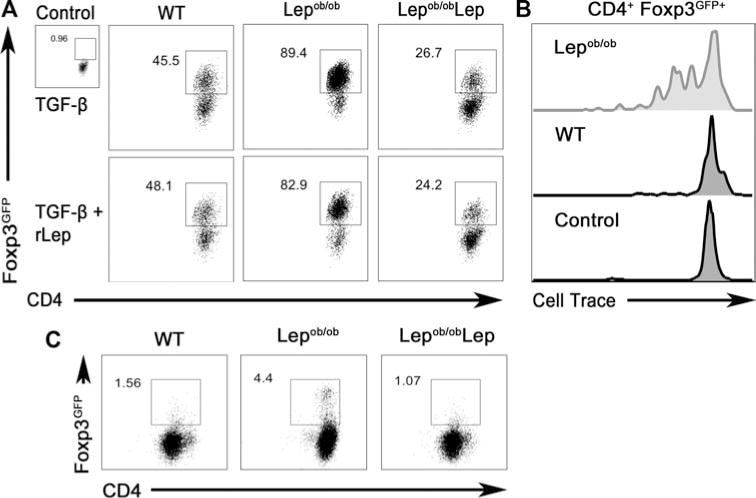
Leptin deficiency promotes the BMDC-mediated generation and proliferation of CD4+Foxp3gfp+ T cells. (A) Lepob/ob iDCs cultured with (Lepob/obLep) or without (Lepob/ob autologous serum) recombinant leptin (500 ng/mL), or WT iDCs, were used to stimulate CD4+Foxp3gfp+ T-cell differentiation from naïve precursors. Sorted naïve (CD4+CD62L+CD44−Foxp3gfp−) T cells from WT syngeneic C57BL/6J Foxp3gfp knock-in mice were co-cultured with DCs in the presence of TGF-β (5 ng/mL) and anti-CD3. Representative flow cytometry plots depicting Treg-cell conversion (CD4+FoxP3gfp+) from one of three independent experiments each with four tested mice per group with similar results are shown. (B) CD4+CD62L+ T cells expressing a MOG35–55-specific TCR were purified from 2D2 syngeneic C57BL/6J Foxp3 knock-in mice, labeled with Cell Trace Violet, and incubated with WT or Lepob/ob DCs in the presence of TGF-β. The proliferation of CD4+Foxp3gfp+ T cells was evaluated by measuring the Cell Trace dilution by flow cytometry. CD4+ T cells cultured without DCs were used as a negative control. Histograms shown are representative of one of three independent experiments each with three tested mice per group with similar results. (C) CD4+CD62L+CD44−Foxp3gfp− T cells were sorted from WT syngeneic C57BL/6J Foxp3 knock-in mice and co-cultured with Lepob/ob, Lepob/obLep, or WT DCs plus anti-CD3 that was not supplemented with TGF-β. The induction of CD4+Foxp3gfp+ T cells was evaluated by flow cytometry. Representative flow cytometry plots are shown. Data are representative of one of three independent experiments each with three tested mice per group with similar results.
To analyze the impact of these findings in an antigen-specific context, we loaded WT and Lepob/ob DCs with MOG35–55 peptide (where MOG is myelin oligodendrocyte glycoprotein) and cultured them with naïve CD4+ T cells from 2D2 Foxp3gfp transgenic mice for 5 days. T cells from 2D2 Foxp3gfp mice express a transgenic TCR with specificity for the MOG35–55 peptide as well as a Foxp3gfp reporter. Lepob/ob DCs induced CD4+Foxp3+ Treg-cell differentiation and proliferation (Fig. 4B). This contrasted with WT iDCs, which failed to induce CD4+Foxp3+ Treg-cell proliferation (Fig. 4B). Additionally, without recombinant TGF-β addition, Lepob/ob DCs induced a higher level of CD4+Foxp3+ T-cell differentiation as compared to either the Lepob/obLep or WT DCs (Fig. 4C).
To exclude the possibility that autocrine-acting leptin produced by CD4+ T cells affects T-cell differentiation, we first determined that naïve CD4+ T cells stimulated with Lepob/ob iDCs or mDCs and anti-CD3, generated 6–13 ng/mL of leptin in the supernatant (Supporting Information Fig. 8). This leptin concentration is not sufficient to modulate DC phenotype (Supporting Information Fig. 6). While this does not completely rule out the possibility that leptin acts directly on CD4+ T cells, it is likely that leptin produced in such a manner would affect all co-cultures equally. Moreover, DCs from BALB/c leptin receptor deficient mice (BLepdb/db) generated more CD4+Foxp3+ T cells than WT BALB/c DCs (Supporting Information Fig. 9). Taken together, these data suggest that leptin principally modulates T-cell behavior indirectly, by acting on DCs through the leptin receptor, rather than acting on T cells directly.
DCs generated under leptin-free conditions generate more Th17 cells in vitro
While leptin increases Th17-cell responses, the underlying mechanism is not known. To address this knowledge gap, we incubated Lepob/ob or Lepob/obLep DCs with naïve CD4+ T cells in the presence of TGF-β, IL-6, and anti-CD3 for 5 days. Lepob/ob DCs induced more Th17 cells (Fig. 5A and Supporting Information Fig. 10) and greater Th17-cell proliferation (Fig. 5B) as compared to Lepob/obLep DCs or WT DCs. Relative to WT or Lepob/obLep DCs, Lepob/ob DCs also induced higher levels of the Th17-cell transcription factor, Rorc (Fig. 5C), but not the Th1-, Th2-, and Treg-cell transcription factors tbx21, gata-3, and foxp3 (Fig. 5C). CD4+ T cells stimulated with Lepob/ob DCs as compared to WT DCs also secreted more IL-17 into culture supernatants (Fig. 5D).
Figure 5.
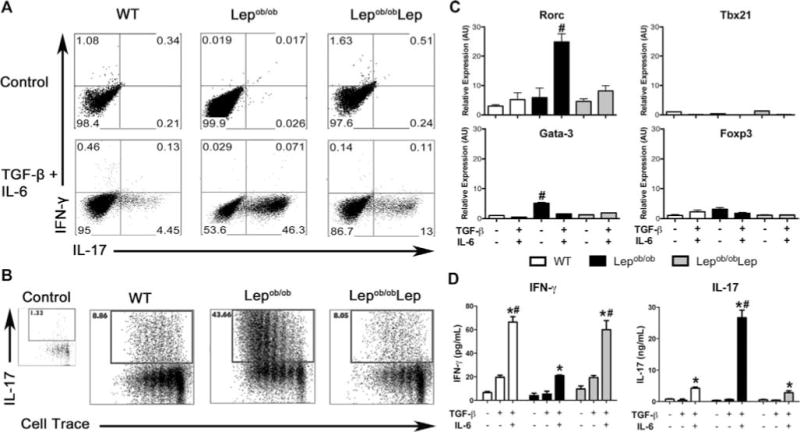
Leptin deficiency promotes BMDC-mediated generation and proliferation of Th17 cells. Lepob/ob iDCs cultured with (Lepob/obLep) or without (Lepob/ob autologous serum) recombinant leptin, or WT iDCs, were used to induce the differentiation of CD4+IL-17+ T cells from naïve precursors. Naïve CD4+CD62L+CD44−Foxp3gfp− T cells were sorted from WT syngeneic C57BL/6J Foxp3 knock-in mice and co-cultured with DCs in the presence of TGF-β (1 ng/mL), IL-6 (50 ng/mL), and anti-CD3. (A) Flow cytometry plots depicting IL-17 production by cultured CD4+ T cells. Histograms are representative of one of three independent experiments each with three tested mice per group with similar results. (B) CD4+CD62L+CD44−Foxp3gfp− T cells were sorted from WT syngeneic C57BL/6J Foxp3 knock-in mice, labeled with Cell Trace Violet and co-cultured with DCs plus anti-CD3 for 5 days. The proliferation of the CD4+IL-17+ T cells was evaluated by measuring the Cell Trace dilution by flow cytometry. Representative flow cytometry plots from one of three independent experiments each with three tested mice per group with similar results are shown. (C) The mRNA expression of RORC, Tbx21, GATA-3, and Foxp3 genes was analyzed on day 5 of Th17 differentiation by qPCR. mRNA levels were normalized to the GAPDH levels. Data are shown as mean + SEM of three samples from one of three independent experiments each with three pooled mice per group. (D) Concentrations of IL-17 and IFN-γ were evaluated in the supernatants of DC-stimulated naïve CD4+ T cells by Bioplex assay. The results are presented the mean + SEM from one of three independent experiments each with three tested mice per group with similar results. #p < 0.05 versus all other groups. *p < 0.05: IL-6 + TGF-β versus control or TGF-β alone (nonparametric Kruskal–Wallis test).
Interestingly, Lepob/obLep DCs induced less IL-17 but more IFN-γ as compared to the Lepob/ob DCs generated with autologous Lepob/ob serum (Fig. 5D). This suggests that leptin acts on DCs to promote IFN-γ production by CD4+ T cells, as previously reported [25, 27]. In the absence of IL-6 and TGF-β, Lepob/ob DCs induce higher gata-3 transcript expression in CD4+ T cells (Fig. 5C). In the presence of Th2-polarizing conditions, Lepob/ob DCs induced more naïve T cells to differentiate into Th2 cells than did WT DCs (Supporting Information Fig. 11). These data support earlier reports that Lepob/ob mice favor Th2 over Th1 immune responses [7,22].
To determine whether genetic background alters the influence of leptin on T-cell fates, we co-cultured BWT or BLepdb/db DCs with naïve CD4+ T cells under Th17-cell-polarizing conditions. In support of our earlier findings, BLepdb/db DCs generated more Th17 cells than the BWT DCs (Supporting Information Fig. 12). Together, these data demonstrate that leptin alters the capacity of DCs to induce Th17 cells, independent of genetic background.
Local leptin decreases the frequency of CD4+Foxp3+ T cells and Th17 cells in vivo
To evaluate the impact of leptin deficiency on Treg and Th17 cells in vivo, we analyzed Treg and Th17 cells in the draining LN (dLN) of Lepob/ob and WT mice. As previously reported, dLNs from unmanipulated Lepob/ob mice have a higher percentage of CD4+CD25+FR4+Foxp3+ Tregs cells than dLNs from unmanipulated WT mice (Fig. 6A and C) [21]. Additionally, Lepob/ob mice have a higher percentage of IL-17-producing memory CD4+CD44+ T cells as compared to WT mice (Fig. 6B and C).
Figure 6.
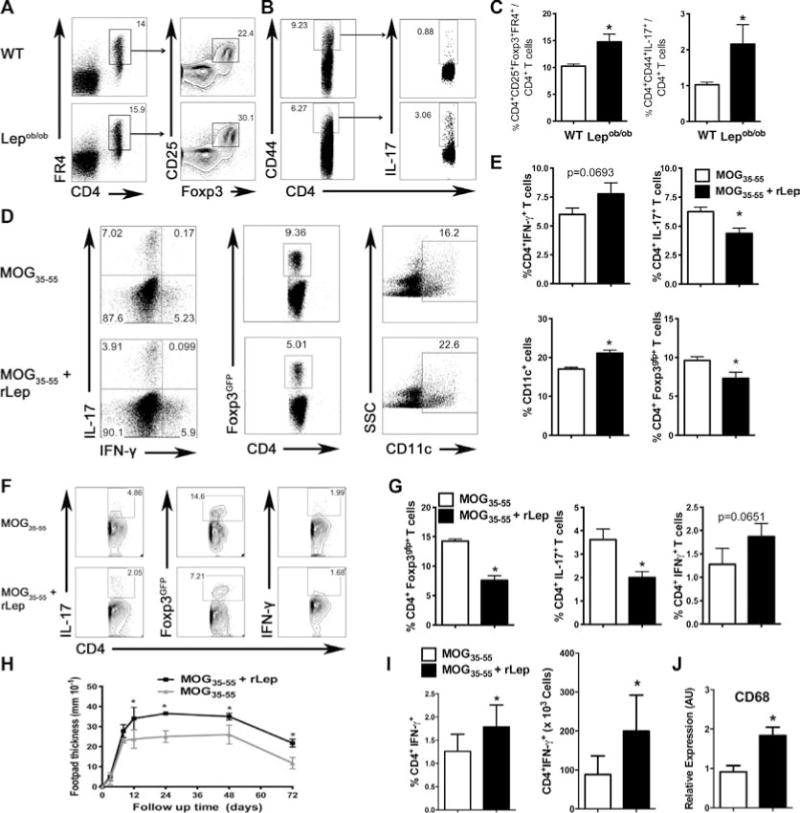
Leptin deficiency increases CD4+Foxp3+ T cells and Th17 cells but decreases Th1-cell immune responses in vivo. (A) LNs cells from unmanipulated WT and Lepob/ob mice were labeled with antibodies for CD4, CD25, folate receptor 4 (FR4), and Foxp3, and analyzed by flow cytometry. Samples were gated on the CD4+FR4+ population, and the frequency of CD25+Foxp3+ T cells was determined. Flow plots are representative of one of two independent experiments each with five tested mice per group. (B) Mesenteric LN cells from unmanipulated WT and Lepob/ob mice were labeled with antibodies for CD4, CD44, and IL-17. The samples were gated on the CD4+CD44+ cells, and the frequency of CD4+IL-17+ T cells within this population was determined. Flow plots are representative of one of two independent experiments each with five tested mice per group with similar results. (C) Graphical representation of the frequency of CD4+FR4+CD25+Foxp3+ T cells and CD4+CD44+IL-17+ T cells in the LN of the Lepob/ob and control mice. Data are shown as mean + SEM of one of two independent experiments each with five tested mice per group with similar results. (D) C57BL/6J Foxp3gfp mice were immunized with the MOG35–55 peptide with or without recombinant leptin (200 μg/mouse). Draining LN (dLN) mononuclear cells were collected 7 days after immunization. Cells were labeled with antibodies for CD4, CD11c, IL-17, and IFN-γ. Foxp3 was analyzed by gfp expression in gated CD4+ cells. (E) Graphical representation of the frequency of CD4+IL-17+, CD4+IFN-γ+, CD4+Foxp3gfp+, and CD11c+ cells. The data are shown as mean + SEM of one of two independent experiments each with five tested mice per group with similar results. (F) 2D2 C57BL/6J Foxp3gfp mice were immunized with the MOG35–55 peptide with or without recombinant leptin (200 μg/mouse), and dLN cells were analyzed 7 days after the immunization. dLN mononuclear cells were collected and cultured with 200 ng/mL of the MOG35–55 peptide for 3 days. The frequencies of MOG35–55-specific CD4+IFN-γ+, CD4+IL-17+, and CD4+Foxp3gfp+ T cells were analyzed by flow cytometry. Flow plots are representative of one of two independent experiments each with three tested mice per group with similar results. (G) Graphical representation of the frequency of CD4+IFN-γ+, CD4+IL-17+, and CD4+Foxp3gfp+ T cells. Data are shown as mean + SEM of one of two independent experiments each with three tested mice per group with similar results. (H) The kinetics of the DHT responses on day 7 postimmunization are shown. C57BL/6J mice were immunized with the MOG35–55 peptide with or without recombinant leptin (200 μg/mouse). Seven days postimmunization, mice were rechallenged with 50 μg of the MOG35–55 peptide by injection into the footpad, and the kinetics of the DTH responses were measured (0–72 h). Each data point represents the mean ± SEM of five tested mice from one of two independent experiments each with five tested mice per group. *p < 0.05 nonparametric Mann–Whitney test). (I) C57BL/6J mice were immunized as in (H) and the dLN percentage and number of CD4+IFN-γ+ T cells evaluated. Data show mean ± SEM of one of two independent experiments each with five tested mice per group with similar results. *p < 0.05 (nonparametric Mann–Whitney test). (J) Immunized C57BL/6J mice were challenged with 50 μg of the MOG35–55 peptide in the footpad. The mice were sacrificed 48 h after challenge and the mRNA was extracted from the footpad, converted to cDNA, and analyzed for the expression of CD68. mRNA levels were normalized to GAPDH. The results are presented as mean + SEM of eight tested mice per group from one experiment. *p < 0.05 (nonparametric Mann–Whitney test).
To determine whether local leptin administration limits Treg-cell and Th17-cell responses, we immunized Foxp3gfp mice either with the MOG35–55 peptide plus rLep or with the MOG35–55 peptide alone. Mice immunized with MOG35–55 plus rLep possessed a lower frequency of CD4+Foxp3+ and CD4+IL-17+ T cells in the dLN as compared to control mice immunized with MOG35–55 alone (Fig. 6D and E). Moreover, there was a higher percentage of CD11c+ cells in mice immunized with leptin and MOG35–55 as compared to control mice (Fig. 6D and E). To determine that this response was antigen specific, we performed a recall assay in which the 2D2 Foxp3gfp mice were immunized with the MOG35–55 peptide with or without rLep. Seven days after the immunization, dLN mononuclear cells were cultured for 3 days with the MOG35–55 peptide, and the antigen-specific CD4+ T-cell response to MOG35–55 was evaluated. Local administration of leptin resulted in lower percentages of Tregs and Th17 cells when compared with the control (Fig. 6F and G), demonstrating antigen specificity. We also observed a trend toward a higher percentage of Th1 cells in rLep-treated as compared to control mice (Fig. 6D–G).
Although no clear difference was observed in the percentage of CD4+IFN-γ+ cells, leptin is a well-known Th1-cell inducer [25,28]. Therefore, we performed a delayed-type hypersensitivity (DTH) assay to assess Th1 immune responses in vivo. We immunized WT mice and divided them into two groups. One group was immunized with CFA and the MOG35–55 peptide plus rLep and the other group was immunized with CFA and MOG35–55 peptide alone. Seven days after the immunization, mice were rechallenged with the MOG35–55 peptide in the footpad and swelling and thickness was evaluated. Mice immunized with the MOG35–55 peptide plus rLep showed a more robust DTH response as compared to control mice immunized with the MOG35–55 peptide alone (Fig. 6H). Mice immunized with the MOG35–55 peptide plus rLep also had a higher frequency and absolute number of infiltrating CD4+IFN-γ+ T cells in the dLN as compared to mice immunized with MOG35–55 peptide alone (Fig. 6I). Moreover, CD68 (a marker for inflammatory monocytes/macrophages) mRNA levels were elevated in mice immunized with MOG35–55 peptide plus rLep 48 h after challenge as compared to mice immunized with the MOG35–55 peptide alone (Fig. 6J).
Finally, to investigate whether local leptin also affects Lepob/ob mice, we immunized Lepob/ob and WT mice and then examined Treg-cell and CD11c+-cell frequency, as well as MHC-II, CD80, CD86, and CD40 expression by CD11c+ cells in the dLN 7 days after immunization. As compared to Lepob/ob and WT mice immunized with antigen alone, Lepob/ob and WT mice immunized with antigen plus rLep possessed a lower percentage of Treg cells (Supporting Information Fig. 13A) and a higher percentage of CD11c+ cells (Supporting Information Fig. 13B). Moreover, WT mice immunized with antigen plus rLep possessed a higher expression of MHC-II, CD86, and CD40 by CD11c+ cells (Supporting Information Fig. 13C). Therefore, while local levels of leptin decrease the percentage of Treg cells in both Lepob/ob and WT mice, local levels of leptin increase costimulatory molecule expression in WT but not Lepob/ob mice. This suggests that the local leptin administration is not capable of rescuing the functional defects of Lepob/ob DCs.
Together, our results indicate that leptin shapes the early immune response by modulating DC generation and maturation. Leptin-deficient DCs are more capable of inducing CD4+Foxp3+ and Th17 T-cell polarization. However, due to the indirect effects of leptin on T cells, local leptin increases DCs and Th1 cells in vivo while also inhibiting Th17 cells and Tregs cells. Our data suggest that this is at least partially due to leptin’s modulation of DCs and may reflect how increased local leptin levels modulate cross-talk between innate and adaptive immunity, such as in obese white adipose tissue.
Discussion
In this study, we investigated the ability of BMDCs generated under leptin-free conditions to induce Treg-cell or Th17-cell differentiation. We found that DCs cultivated in leptin-free autologous serum had a distinct phenotype that was characterized by a reduced capacity to induce syngeneic CD4+ T-cell proliferation and an enhanced capacity to induce Tregs and Th17 cells.
We observed that the Lepob/ob iDCs and mDCs expressed lower levels of CD40, CD80, CD86, and MHC-II, and secreted lower levels of IL-6, IL-12, and TNF-α, confirming earlier reports [13,26]. As a consequence, Lepob/ob DCs induced less proliferation among syngeneic WT CD4+ T cells. Importantly, the addition of rLep restored a WT-like phenotype in Lepob/ob DCs.
It is enigmatic that Lepob/ob and Lepdb/db mice exhibit distinct phenotypes. iDCs and mDCs from Lepdb/db mice express lower levels of costimulatory molecules, induce less proliferation among allogeneic CD4+ T cells, and produce less IL-12, IL-6, and TNF-α [13]. On the other hand, Lepob/ob BMDCs express levels of CD40, CD80, CD86, and MHC-II that are similar to those observed in WT BMDCs, but induce less proliferation of allogeneic CD4+ T cells [26]. The differences in these studies may arise from the use of FCS in DC cultures. FCS is rich in bovine leptin, containing 10–20 ng/mL in RPMI containing 10% FCS. A previous study has also shown that bovine leptin is not neutralized by human leptin mAb and thus might trigger leptin signaling [23]. In our studies, we exclude this possibility through the use of autologous leptin-free serum from leptin-deficient mice, enabling us to convincingly demonstrate that leptin is required for proper DC maturation.
Importantly, we observed lower concentrations of Th1 cytokines (IFN-γ and IL-2) in Lepob/ob DC-stimulated CD4+ T-cell cultures as compared with WT DC-stimulated T-cell cultures. It is well known that leptin plays a synergistic role in generating Th1-cell responses [15, 29, 30]. Leptin suppresses Th2-cell responses thus generating a Th1-cell profile [15], although this is not easily observed in vivo [22]. We observed that DCs from the Lepob/ob mice generated with autologous serum induce more Th2 cells than the WT DCs. Moreover, we have previously shown that the leptin-deficient mice display increased allograft survival due to an increase in Th2 cells and Treg cells as well as fewer Th1 cells [7].
We observed that leptin increases Th1-cell DTH responses in vivo, possibly because leptin acts directly on CD4+ T cells to induce IFN-γ production and Th1-cell polarization [15,16,22]. WT mice immunized with the MOG peptide plus leptin show enhanced Th1-cell immune responses, characterized by an increase in Th1 cells in the dLN and heightened expression of the macrophage marker CD68 in the footpad. Together, these data indicate that leptin regulates both Th1 and Th2 cells. It seems likely that leptin induces Th1-cell differentiation through its ability to induce IFN-γ and IL-12 [9,15,16,22,31,32], which inhibit Th17-cell responses [33–43]. Moreover, Th17 cells are phenotypically unstable and readily convert to a Th1-cell phenotype both in vitro and in vivo [44,45].
Our data indicate that leptin deficiency impairs DC maturation. Moreover, both Lepob/ob iDCs and mDCs produce higher levels of bioactive TGF-β, an increase that is abrogated by rLep addition. The fact that DCs induce fewer Th1-cell cytokines and produce more TGF-β than WT DCs led us to hypothesize that Lepob/ob DCs induce CD4+Foxp3gfp+ T cells more efficiently. Interestingly, DCs derived from the leptin-deficient mice and cultivated in the absence of leptin (autologous serum) not only induced more Treg cells, but also induced more Th17 cells from naïve CD4+ T cells. This is likely because, when combined with IL-6, TGF-β potently induces Th17 cells [46]. Our observation that leptin deficiency enhances the Th17 axis in vitro is supported by the fact that obese leptin-deficient mice exhibit elevated neutrophil-derived IL-17A that exacerbates inflammatory responses in vivo [47]. Moreover, the lack of leptin signaling is associated with higher IL-6 levels [48–50]. Nevertheless, it is possible that this increase in Th17 cells is controlled by the concomitant increase in Treg cells in vivo, a possibility seemingly confirmed by the fact that Lepob/ob mice exhibit decreased EAE progression [32].
Contrary to our findings, leptin is reported to induce Th17 cells [12,24]. However, there are several notable differences that might explain this disparity. First, in contrast to our experiments, these studies were conducted under APC-free conditions, thus making any comparison difficult. Second, we more rigorously defined naïve CD4+ T cells as CD4+CD62L+CD44−Foxp3−, whereas Deng et al. considered naïve CD4+ T cells to be CD4+CD62L+. The CD4+CD62L+ phenotype is not purely naïve because Treg cells and central memory CD4+ T cells also express CD62L [51, 52]. As leptin exhibits differential effects on memory and naïve CD4+ T-cell populations [15], it is possible that the IL-17-producing cells observed in other studies are memory cells rather than Th17 cells generated de novo.
We found that leptin decreases CD4+Foxp3+ and CD4+IL-17+ cell frequency in the dLN of immunized mice but increases subsequent DTH responses. This stands in contrast to Deng et al. who reported increased Th17-cell immune responses when leptin was injected intra-articularly. This discrepancy may arise from the mechanisms by which leptin acts at both sites. The LN is the site where the priming phase of T-cell activation occurs, whereas the joint is the site where the T-cell effector phase occurs. Therefore, further investigation is needed to better understand how leptin might differentially influence the priming and the effector phases in vivo.
DTH responses reflect a Th1-type response [53]. However, Th17-cell development is strongly favored in the absence of the Th1 lineage specific transcription factor T-bet [35]. Moreover, the Th1 cytokine IL-27 [54, 55] is known to inhibit Th17-cell development [56]. Therefore, it is possible that Th17-cell development is favored in Lepob/ob mice due to their Th1-cell defects [22, 25]. Nevertheless, the Lepob/ob mice are partially protected from EAE [9,10,32,57,58], indicating that these cells may be controlled by regulatory populations, that Th17 cells may not be generated efficiently during EAE in Lepob/ob mice, or that leptin may be required for the generation of pathogenic Th17 cells. Thus, further investigation is required to elucidate the precise mechanism by which leptin modulates pathogenic Th17-cell development during EAE. However, our data suggest that DCs are required, at least in part, for Th17 induction, and that leptin appears to inhibit Th17 cells in vitro and in vivo.
Leptin negatively regulates proliferation of human CD4+CD25+Foxp3+ Treg cells [23], a population that expresses high levels of the long form of the leptin receptor (ObRb) [23]. Leptin neutralization results in Treg-cell proliferation and increased Foxp3 expression, an IL-2-dependent process [23]. In our results, we observed that Treg cells proliferated more in response to Lepob/ob DCs cultured in autologous leptin-free serum than WT DCs. Moreover, Lepob/ob DCs induced greater de novo differentiation of Treg cells from naïve precursors than WT DCs. These data indicate that increased Treg-cell induction requires DCs generated in the absence of leptin, which exhibit heightened TGF-β expression. Although increased proliferation of Treg cells arising from leptin neutralization was described to be dependent on oscillatory mTOR activation [17], it remains possible that DCs generated in the absence of leptin are responsible for this mTOR activation in CD4+ T cells.
Taken together, our findings demonstrate that leptin-deficient DCs exhibit a hypostimulatory phenotype as compared to WT DCs. Consequently, leptin-deficient DCs are potent inducers of both Tregs and Th17 T cells. While T cells respond according to the local milieu, this is also true of DCs. Because DCs present antigen to T cells, DCs are present at the earliest stages of the adaptive immune response. Hence, DCs can be viewed as the sensors that relay environmental information to responding T cells. Thus, our results provide important information relevant to leptin-targeting approaches in which the DC modulation of effector T-cell function may be either beneficial (Treg-cell induction) or detrimental (Th1-and Th17-cell induction) to clinical outcomes.
Material and methods
Mice
Ten- to twelve-week-old male WT C57BL/6J (B6), C57BL/6J Lepob/ob, WT BALB/c, and BALB/c Lepdb/db mice were purchased from the Jackson Laboratory (Bar Harbor, ME, USA). B6 2D2 Foxp3gfp TCR transgenic mice have been described elsewhere [59] and were kindly provided by Prof. Howard L. Weiner (Center for Neurologic Diseases, Brigham and Women’s Hospital, Harvard Medical School). B6 Foxp3gfp and BALB/c Foxp3gfp mice were housed at Beth Israel Deaconess Medical Center, Harvard Medical School. The mice were age-matched for individual experiments. All experiments were conducted in accord with the IACUC and COBEA (Brazilian Committee for Experimental Animals) and were approved by the Institutional Ethics Committee on Animal Use of the University of São Paulo, São Paulo, Brazil.
Generation of BMDCs
Murine BM cells were flushed from femurs and tibiae. Red blood cells were lysed, and cells were plated at a density of 1.0 × 10⁶ cells/mL in DMEM low-glucose medium (Gibco) containing 10% FBS (Hyclone) or autologous Lepob/ob serum containing 20 ng/mL of GM-CSF for experiments requiring leptin-free conditions. The culture medium was replaced on day 5, and cells were harvested on day 7 to obtain iDCs. To obtain mDCs, LPS was added to the cultures at a final concentration of 100 ng/mL on day 7, and the cells were cultured for an additional 48 h as previously described [26].
Cell sorting and T-cell differentiation
Splenocytes from donor B6, Balb/c Foxp3gfp, and B6 2D2 Foxp3gfp mice were stained with the following fluorochrome-conjugated antibodies: PE/Cy7 anti-CD4, PerCP anti-CD44, and Alexa Fluor 700 anti-CD62L. Naïve CD4+CD44−CD62L+Foxp3gfp− cells were sorted (BD FACSAria II, Beth Israel Deaconess Medical Center, Flow Cytometry Core, BD Biosciences). After sorting, cell purity was greater than 98%. Naïve T cells were plated at a density of 2.0 × 10⁵ cells/well in a flat-bottom 96-well plate and co-cultured in DMEM low-glucose medium containing 10% FBS or Lepob/ob autologous serum for 5 days with 1.0 × 10⁵ BMDCs and anti-CD3 antibody (1 μg/mL; BioLegend) in the presence of rLep (500 ng/mL; R&D Systems) and the following cytokines required for polarization: Treg-cell differentiation, TGF-β1 (5 ng/mL); Th17-cell differentiation, TGF-β1 (1 ng/mL) and IL-6 (50 ng/mL); and Th2-cell differentiation, IL-4 (20 ng/mL).
Flow cytometry, intracellular cytokine, and Foxp3 staining
Cells were resuspended in PBS supplemented with 2% FCS and stained with a subset of the following mAbs: Pacific Blue anti-CD4; FITC anti-CD25 (BD Biosciences); allophycocyanin anti-FR4; Pacific Blue anti-CD11c; FITC anti-IAb; PE anti-CD40; PerCP anti-CD80; and allophycocyanin anti-CD86 (Biolegend). Cells were acquired using an LSR II flow cytometer (BD Biosciences) at Beth Israel Deaconess Medical Center, Flow Cytometry Core, and the results were analyzed with FlowJo 8.7 software (Treestar). To determine the number of Treg cells (CD4+CD25+Foxp3+FR4+) in vivo, 1 × 10⁶ cells were stained for the intracellular transcription factor Foxp3 using allophycocyanin anti-mouse/rat Foxp3 (eBioscience). For intracellular cytokine staining, 1 × 10⁶ cells were stimulated in vitro for 4 h at 37°C in 5% CO2 with phorbol-12-myristate-13-acetate (PMA, 100 ng/mL), ionomycin (1 μg/mL), and brefeldin-A (1 μg/mL) (Sigma-Aldrich). The cells were permeabilized using the BD Cytofix/Cytoperm Fixation/Permeabilization solution kit (BD Biosciences). Intracellular staining was performed with allophycocyanin anti-IL-17 and FITC anti-IFN-γ (Biolegend).
RT-qPCR and PCR-based array
RNA was extracted from the cells using an RNeasy Mini Kit (Qiagen, USA) according to the manufacturer’s instructions. All of the samples were treated with DNase prior to cDNA synthesis. cDNA was synthesized using an RT2 First Strand Kit (Qiagen). GAPDH mRNA levels were measured (Applied Biosystems) as an internal control. The relative expression levels of foxp3, rorc, tbx21, gata-3, and il-10 are presented as the means ± SEM of triplicate samples. For the PCR arrays, cDNA was synthesized from RNA extracted from bead-purified CD11c+ cells and then analyzed using the Dendritic & Antigen Presenting Cell PCR Array kit (Qiagen) according to the manufacturer’s instructions.
CD4+ T-cell proliferation
BMDCs from WT B6, B6 Lepob/ob, BALB/c, or BALB/c Lepdb/db mice were co-cultured with sorted autologous-labeled CD4+ T cells with Cell Trace Violet (Invitrogen) plus anti-CD3 antibody (Biolegend). Cells were cultured at 37°C in 5% CO2 for 5 days. Cell proliferation was quantified by flow cytometry. The division cell index and the percentage of divided cells were calculated with FlowJo 8.7 software.
Cytokine and leptin assays
Cytokine levels in culture supernatants were quantified using a Bio-Plex cytokine assay kit (Bio-Rad Laboratories) as recommended by the manufacturer. Data were analyzed using the Bio-Plex Manager software version 4.0 (Bio-Rad Laboratories). An ELISA assay (TGF-β1 Emax®, Promega) was used to measure the concentration of TGF-β1 in the conditioned media of iDC and mDC cultures. Leptin levels were measured using a Mouse Leptin ELISA kit as described by the manufacturer (Millipore).
DTH and immunization assays
DTH responses to a MOG35–55 peptide (MEVGWYRSPFSRVVH LYRNGK) were quantified using a time-dependent footpad swelling assay. B6 Foxp3gfp knock-in mice were immunized with MOG35–55 peptide and CFA (Sigma) or MOG35–55 peptide, CFA, and rLep (800 μg/mouse). Seven days after immunization, dLN cells from one cohort of mice were analyzed. A second cohort of mice were challenged with the MOG35–55 peptide (200 ng/mouse) in the footpad. The footpad swelling was measured at 12, 24, 48, and 72 h after antigen challenge by a “blinded” investigator. For the recall response analysis, 2D2 B6 Foxp3gfp knock-in mice were immunized with MOG35–55 peptide and CFA or MOG35–55 peptide, CFA, and rLep (800 μg/mouse). Seven days postimmunization, dLN mononuclear cells were isolated and cultured for 3 days in the presence of the MOG35–55 peptide. The percentage and number of CD4+IFN-γ+, CD4+IL-17+, and CD4+Foxp3gfp+ cells were evaluated by flow cytometry.
Statistical analysis
The data are presented as the mean ± SEM. The differences among groups were compared using a nonparametric ANOVA (Kruskal–Wallis posttest), and the differences between the groups were compared with a nonparametric Student’s t-test (Mann–Whitney). All statistical analyses were performed using GraphPad PRISM® 5 software, and the differences were considered significant when p < 0.05.
Supplementary Material
Acknowledgments
This study was supported by grants 08/55447–1, 2009/50450–7, and 08/58564–9 from the State of Sao Paulo Foundation for Research Support (FAPESP), Brazilian Council of Scientific and Technologic Development (470533/2007–2, CNPq/DECIT/MS), and Complex Fluids INCT.
Abbreviations
- dLN
draining LN
- DTH
delayed-type hypersensitivity
- iDC
immature DC
- FBS
fetal bovine serum
- mDC
mature DC
- MOG
myelin oligodendrocyte glycoprotein
- rLep
recombinant leptin
Footnotes
Additional supporting information may be found in the online version of this article at the publisher’s web-site
Current address: Dr. Pedro M.M. Moraes-Vieira, Division of Endocrinology, Diabetes and Metabolism, Beth Israel Medical Deaconess Center, Harvard Medical School, Boston, MA, USA
Conflict of interest: The authors declare no financial or commercial conflict of interest.
References
- 1.Kershaw EE, Flier JS. Adipose tissue as an endocrine organ. J Clin Endocrinol Metab. 2004;89:2548–2556. doi: 10.1210/jc.2004-0395. [DOI] [PubMed] [Google Scholar]
- 2.Ahima RS. Adipose tissue as an endocrine organ. Obesity. 2006;14(Suppl 5):242S–249S. doi: 10.1038/oby.2006.317. [DOI] [PubMed] [Google Scholar]
- 3.La Cava A, Matarese G. The weight of leptin in immunity. Nat Rev Immunol. 2004;4:371–379. doi: 10.1038/nri1350. [DOI] [PubMed] [Google Scholar]
- 4.Moraes-Vieira PM, Bassi EJ, Araujo RC, Camara NO. Leptin as a link between the immune system and kidney-related diseases: leading actor or just a coadjuvant? Obes Rev. 2012;13:733–743. doi: 10.1111/j.1467-789X.2012.00997.x. [DOI] [PubMed] [Google Scholar]
- 5.Villanueva EC, Myers MG., Jr Leptin receptor signaling and the regulation of mammalian physiology. Int J Obes. 2008;32(Suppl 7):S8–S12. doi: 10.1038/ijo.2008.232. [DOI] [PMC free article] [PubMed] [Google Scholar]
- 6.Bennett BD, Solar GP, Yuan JQ, Mathias J, Thomas GR, Matthews W. A role for leptin and its cognate receptor in hematopoiesis. Curr Biol. 1996;6:1170–1180. doi: 10.1016/s0960-9822(02)70684-2. [DOI] [PubMed] [Google Scholar]
- 7.Moraes-Vieira PM, Bassi EJ, Larocca RA, Castoldi A, Burghos M, Lepique AP, Quintana FJ, et al. Leptin modulates allograft survival by favoring a Th2 and a regulatory immune profile. Am J Transplant. 2013;13:36–44. doi: 10.1111/j.1600-6143.2012.04283.x. [DOI] [PMC free article] [PubMed] [Google Scholar]
- 8.Cai C, Hahn BH, Matarese G, La Cava A. Leptin in non-autoimmune inflammation. Inflamm Allergy Drug Targets. 2009;8:285–291. doi: 10.2174/187152809789352168. [DOI] [PubMed] [Google Scholar]
- 9.Matarese G, Di Giacomo A, Sanna V, Lord GM, Howard JK, Di Tuoro A, Bloom SR, et al. Requirement for leptin in the induction and progression of autoimmune encephalomyelitis. J Immunol. 2001;166:5909–5916. doi: 10.4049/jimmunol.166.10.5909. [DOI] [PubMed] [Google Scholar]
- 10.Sanna V, Di Giacomo A, La Cava A, Lechler RI, Fontana S, Zappacosta S, Matarese G. Leptin surge precedes onset of autoimmune encephalomyelitis and correlates with development of pathogenic T cell responses. J Clin Invest. 2003;111:241–250. doi: 10.1172/JCI16721. [DOI] [PMC free article] [PubMed] [Google Scholar]
- 11.Singh UP, Singh NP, Guan H, Busbee B, Price RL, Taub DD, Mishra MK, et al. Leptin antagonist ameliorates chronic colitis in IL-10 mice. Immunobiology. 2013;218:1439–1451. doi: 10.1016/j.imbio.2013.04.020. [DOI] [PMC free article] [PubMed] [Google Scholar]
- 12.Deng J, Liu Y, Yang M, Wang S, Zhang M, Wang X, Ko KH, et al. Leptin exacerbates collagen-induced arthritis via enhancement of Th17 cell response. Arthritis Rheum. 2012;64:3564–3573. doi: 10.1002/art.34637. [DOI] [PubMed] [Google Scholar]
- 13.Lam QL, Liu S, Cao X, Lu L. Involvement of leptin signaling in the survival and maturation of bone marrow-derived dendritic cells. Eur J Immunol. 2006;36:3118–3130. doi: 10.1002/eji.200636602. [DOI] [PubMed] [Google Scholar]
- 14.Lam QL, Zheng BJ, Jin DY, Cao X, Lu L. Leptin induces CD40 expression through the activation of Akt in murine dendritic cells. J Biol Chem. 2007;282:27587–27597. doi: 10.1074/jbc.M704579200. [DOI] [PubMed] [Google Scholar]
- 15.Lord GM, Matarese G, Howard JK, Baker RJ, Bloom SR, Lechler RI. Leptin modulates the T-cell immune response and reverses starvation-induced immunosuppression. Nature. 1998;394:897–901. doi: 10.1038/29795. [DOI] [PubMed] [Google Scholar]
- 16.Lord GM, Matarese G, Howard JK, Bloom SR, Lechler RI. Leptin inhibits the anti-CD3-driven proliferation of peripheral blood T cells but enhances the production of proinflammatory cytokines. J Leukoc Biol. 2002;72:330–338. [PubMed] [Google Scholar]
- 17.Procaccini C, De Rosa V, Galgani M, Carbone F, Cassano S, Greco D, Qian K, et al. Leptin-induced mTOR activation defines a specific molecular and transcriptional signature controlling CD4+ effector T cell responses. J Immunol. 2012;189:2941–2953. doi: 10.4049/jimmunol.1200935. [DOI] [PubMed] [Google Scholar]
- 18.Zhu J, Paul WE. CD4 T cells: fates, functions, and faults. Blood. 2008;112:1557–1569. doi: 10.1182/blood-2008-05-078154. [DOI] [PMC free article] [PubMed] [Google Scholar]
- 19.Palmer G, Aurrand-Lions M, Contassot E, Talabot-Ayer D, Ducrest-Gay D, Vesin C, Chobaz-Peclat V, et al. Indirect effects of leptin receptor deficiency on lymphocyte populations and immune response in db/db mice. J Immunol. 2006;177:2899–2907. doi: 10.4049/jimmunol.177.5.2899. [DOI] [PubMed] [Google Scholar]
- 20.Papathanassoglou E, El-Haschimi K, Li XC, Matarese G, Strom T, Mantzoros C. Leptin receptor expression and signaling in lymphocytes: kinetics during lymphocyte activation, role in lymphocyte survival, and response to high fat diet in mice. J Immunol. 2006;176:7745–7752. doi: 10.4049/jimmunol.176.12.7745. [DOI] [PubMed] [Google Scholar]
- 21.Taleb S, Herbin O, Ait-Oufella H, Verreth W, Gourdy P, Barateau V, Merval R, et al. Defective leptin/leptin receptor signaling improves regulatory T cell immune response and protects mice from atherosclerosis. Arterioscler Thromb Vasc Biol. 2007;27:2691–2698. doi: 10.1161/ATVBAHA.107.149567. [DOI] [PubMed] [Google Scholar]
- 22.Batra A, Okur B, Glauben R, Erben U, Ihbe J, Stroh T, Fedke I, et al. Leptin: a critical regulator of CD4+ T-cell polarization in vitro and in vivo. Endocrinology. 2010;151:56–62. doi: 10.1210/en.2009-0565. [DOI] [PubMed] [Google Scholar]
- 23.De Rosa V, Procaccini C, Cali G, Pirozzi G, Fontana S, Zappacosta S, La Cava A, et al. A key role of leptin in the control of regulatory T cell proliferation. Immunity. 2007;26:241–255. doi: 10.1016/j.immuni.2007.01.011. [DOI] [PubMed] [Google Scholar]
- 24.Yu Y, Liu Y, Shi FD, Zou H, Matarese G, La Cava A. Cutting edge: Leptin-induced RORgammat expression in CD4+ T cells promotes Th17 responses in systemic lupus erythematosus. J Immunol. 2013;190:3054–3058. doi: 10.4049/jimmunol.1203275. [DOI] [PMC free article] [PubMed] [Google Scholar]
- 25.Mattioli B, Straface E, Quaranta MG, Giordani L, Viora M. Leptin promotes differentiation and survival of human dendritic cells and licenses them for Th1 priming. J Immunol. 2005;174:6820–6828. doi: 10.4049/jimmunol.174.11.6820. [DOI] [PubMed] [Google Scholar]
- 26.Macia L, Delacre M, Abboud G, Ouk TS, Delanoye A, Verwaerde C, Saule P, et al. Impairment of dendritic cell functionality and steady-state number in obese mice. J Immunol. 2006;177:5997–6006. doi: 10.4049/jimmunol.177.9.5997. [DOI] [PubMed] [Google Scholar]
- 27.Moraes-Vieira PM, Bassi EJ, Araujo RC, Camara NO. Leptin as a link between the immune system and kidney-related diseases: leading actor or just a coadjuvant? Obes Rev. 2012;3:733–743. doi: 10.1111/j.1467-789X.2012.00997.x. [DOI] [PubMed] [Google Scholar]
- 28.Cao J, Chen JH, Zhu SY. Effects of leptin on airway inflammation and the expression of Th1/Th2 cytokines in asthmatic rats. Zhonghua Jie He He Hu Xi Za Zhi. 2009;32:171–176. [PubMed] [Google Scholar]
- 29.Batra A, Okur B, Glauben R, Erben U, Ihbe J, Stroh T, Fedke I, et al. Leptin: a critical regulator of CD4+ T-cell polarization in vitro and in vivo. Endocrinology. 2010;151:56–62. doi: 10.1210/en.2009-0565. [DOI] [PubMed] [Google Scholar]
- 30.Lord GM. Leptin as a proinflammatory cytokine. Contrib Nephrol. 2006;151:151–164. doi: 10.1159/000095326. [DOI] [PubMed] [Google Scholar]
- 31.Gove ME, Rhodes DH, Pini M, van Baal JW, Sennello JA, Fayad R, Cabay RJ, et al. Role of leptin receptor-induced STAT3 signaling in modulation of intestinal and hepatic inflammation in mice. J Leukoc Biol. 2009;85:491–496. doi: 10.1189/jlb.0808508. [DOI] [PMC free article] [PubMed] [Google Scholar]
- 32.De Rosa V, Procaccini C, La Cava A, Chieffi P, Nicoletti GF, Fontana S, Zappacosta S, et al. Leptin neutralization interferes with pathogenic T cell autoreactivity in autoimmune encephalomyelitis. J Clin Invest. 2006;116:447–455. doi: 10.1172/JCI26523. [DOI] [PMC free article] [PubMed] [Google Scholar]
- 33.Chen Z, Laurence A, O’Shea JJ. Signal transduction pathways and transcriptional regulation in the control of Th17 differentiation. Semin Immunol. 2007;19:400–408. doi: 10.1016/j.smim.2007.10.015. [DOI] [PMC free article] [PubMed] [Google Scholar]
- 34.Feng G, Gao W, Strom TB, Oukka M, Francis RS, Wood KJ, Bushell A. Exogenous IFN-gamma ex vivo shapes the alloreactive T-cell repertoire by inhibition of Th17 responses and generation of functional Foxp3+ regulatory T cells. Eur J Immunol. 2008;38:2512–2527. doi: 10.1002/eji.200838411. [DOI] [PMC free article] [PubMed] [Google Scholar]
- 35.Yang Y, Xu J, Niu Y, Bromberg JS, Ding Y. T-bet and eomesodermin play critical roles in directing T cell differentiation to Th1 versus Th17. J Immunol. 2008;181:8700–8710. doi: 10.4049/jimmunol.181.12.8700. [DOI] [PMC free article] [PubMed] [Google Scholar]
- 36.Fujiwara M, Hirose K, Kagami S, Takatori H, Wakashin H, Tamachi T, Watanabe N, et al. T-bet inhibits both TH2 cell-mediated eosinophil recruitment and TH17 cell-mediated neutrophil recruitment into the airways. J Allergy Clin Immunol. 2007;119:662–670. doi: 10.1016/j.jaci.2006.12.643. [DOI] [PubMed] [Google Scholar]
- 37.Cooney LA, Towery K, Endres J, Fox DA. Sensitivity and resistance to regulation by IL-4 during Th17 maturation. J Immunol. 2011;187:4440–4450. doi: 10.4049/jimmunol.1002860. [DOI] [PMC free article] [PubMed] [Google Scholar]
- 38.Laurence A, Tato CM, Davidson TS, Kanno Y, Chen Z, Yao Z, Blank RB, et al. Interleukin-2 signaling via STAT5 constrains T helper 17 cell generation. Immunity. 2007;26:371–381. doi: 10.1016/j.immuni.2007.02.009. [DOI] [PubMed] [Google Scholar]
- 39.Villarino AV, Gallo E, Abbas AK. STAT1-activating cytokines limit Th17 responses through both T-bet-dependent and -independent mechanisms. J Immunol. 2010;185:6461–6471. doi: 10.4049/jimmunol.1001343. [DOI] [PMC free article] [PubMed] [Google Scholar]
- 40.Millward JM, Lobner M, Wheeler RD, Owens T. Inflammation in the central nervous system and Th17 responses are inhibited by IFN-gamma-Induced IL-18 binding protein. J Immunol. 2010;185:2458–2466. doi: 10.4049/jimmunol.0902153. [DOI] [PubMed] [Google Scholar]
- 41.Harrington LE, Hatton RD, Mangan PR, Turner H, Murphy TL, Murphy KM, Weaver CT. Interleukin 17-producing CD4+ effector T cells develop via a lineage distinct from the T helper type 1 and 2 lineages. Nat Immunol. 2005;6:1123–1132. doi: 10.1038/ni1254. [DOI] [PubMed] [Google Scholar]
- 42.Su SB, Grajewski RS, Luger D, Agarwal RK, Silver PB, Tang J, Tuo J, et al. Altered chemokine profile associated with exacerbated autoimmune pathology under conditions of genetic interferon-gamma deficiency. Invest Ophthalmol Vis Sci. 2007;48:4616–4625. doi: 10.1167/iovs.07-0233. [DOI] [PMC free article] [PubMed] [Google Scholar]
- 43.Veldhoen M, Hocking RJ, Flavell RA, Stockinger B. Signals mediated by transforming growth factor-beta initiate autoimmune encephalomyelitis, but chronic inflammation is needed to sustain disease. Nat Immunol. 2006;7:1151–1156. doi: 10.1038/ni1391. [DOI] [PubMed] [Google Scholar]
- 44.Shi G, Cox CA, Vistica BP, Tan C, Wawrousek EF, Gery I. Phenotype switching by inflammation-inducing polarized Th17 cells, but not by Th1 cells. J Immunol. 2008;181:7205–7213. doi: 10.4049/jimmunol.181.10.7205. [DOI] [PMC free article] [PubMed] [Google Scholar]
- 45.Wei G, Wei L, Zhu J, Zang C, Hu-Li J, Yao Z, Cui K, et al. Global mapping of H3K4me3 and H3K27me3 reveals specificity and plasticity in lineage fate determination of differentiating CD4+ T cells. Immunity. 2009;30:155–167. doi: 10.1016/j.immuni.2008.12.009. [DOI] [PMC free article] [PubMed] [Google Scholar]
- 46.Mucida D, Park Y, Kim G, Turovskaya O, Scott I, Kronenberg M, Cheroutre H. Reciprocal TH17 and regulatory T cell differentiation mediated by retinoic acid. Science. 2007;317:256–260. doi: 10.1126/science.1145697. [DOI] [PubMed] [Google Scholar]
- 47.Pini M, Fantuzzi G. Enhanced production of IL-17A during zymosan-induced peritonitis in obese mice. J Leukoc Biol. 2010;87:51–58. doi: 10.1189/jlb.0309188. [DOI] [PMC free article] [PubMed] [Google Scholar]
- 48.Lee FY, Li Y, Yang EK, Yang SQ, Lin HZ, Trush MA, Dannenberg AJ, et al. Phenotypic abnormalities in macrophages from leptin-deficient, obese mice. Am J Physiol. 1999;276:C386–C394. doi: 10.1152/ajpcell.1999.276.2.C386. [DOI] [PubMed] [Google Scholar]
- 49.Harkins JM, Moustaid-Moussa N, Chung YJ, Penner KM, Pestka JJ, North CM, Claycombe KJ. Expression of interleukin-6 is greater in preadipocytes than in adipocytes of 3T3-L1 cells and C57BL/6J and ob/ob mice. J Nutr. 2004;134:2673–2677. doi: 10.1093/jn/134.10.2673. [DOI] [PubMed] [Google Scholar]
- 50.Lu FL, Johnston RA, Flynt L, Theman TA, Terry RD, Schwartzman IN, Lee A, et al. Increased pulmonary responses to acute ozone exposure in obese db/db mice. Am J Physiol Lung Cell Mol Physiol. 2006;290:L856–L865. doi: 10.1152/ajplung.00386.2005. [DOI] [PubMed] [Google Scholar]
- 51.Zaph C, Uzonna J, Beverley SM, Scott P. Central memory T cells mediate long-term immunity to Leishmania major in the absence of persistent parasites. Nat Med. 2004;10:1104–1110. doi: 10.1038/nm1108. [DOI] [PubMed] [Google Scholar]
- 52.Taylor PA, Panoskaltsis-Mortari A, Swedin JM, Lucas PJ, Gress RE, Levine BL, June CH, et al. L-Selectin(hi) but not the L-selectin(lo) CD4+25 +T-regulatory cells are potent inhibitors of GVHD and BM graft rejection. Blood. 2004;104:3804–3812. doi: 10.1182/blood-2004-05-1850. [DOI] [PubMed] [Google Scholar]
- 53.Cher DJ, Mosmann TR. Two types of murine helper T cell clone. II. Delayed-type hypersensitivity is mediated by TH1 clones. J Immunol. 1987;138:3688–3694. [PubMed] [Google Scholar]
- 54.Yoshida H, Miyazaki Y. Regulation of immune responses by interleukin-27. Immunol Rev. 2008;226:234–247. doi: 10.1111/j.1600-065X.2008.00710.x. [DOI] [PubMed] [Google Scholar]
- 55.Yoshida H, Miyazaki Y. Interleukin 27 signaling pathways in regulation of immune and autoimmune responses. Int J Biochem Cell Biol. 2008;40:2379–2383. doi: 10.1016/j.biocel.2008.05.020. [DOI] [PubMed] [Google Scholar]
- 56.Ivanov II, Zhou L, Littman DR. Transcriptional regulation of Th17 cell differentiation. Semin Immunol. 2007;19:409–417. doi: 10.1016/j.smim.2007.10.011. [DOI] [PMC free article] [PubMed] [Google Scholar]
- 57.Peelman F, Iserentant H, Eyckerman S, Zabeau L, Tavernier J. Leptin, immune responses and autoimmune disease. Perspectives on the use of leptin antagonists. Curr Pharm Des. 2005;11:539–548. doi: 10.2174/1381612053382070. [DOI] [PubMed] [Google Scholar]
- 58.Matarese G, Sanna V, Di Giacomo A, Lord GM, Howard JK, Bloom SR, Lechler RI, et al. Leptin potentiates experimental autoimmune encephalomyelitis in SJL female mice and confers susceptibility to males. Eur J Immunol. 2001;31:1324–1332. doi: 10.1002/1521-4141(200105)31:5<1324::AID-IMMU1324>3.0.CO;2-Y. [DOI] [PubMed] [Google Scholar]
- 59.Bettelli E, Pagany M, Weiner HL, Linington C, Sobel RA, Kuchroo VK. Myelin oligodendrocyte glycoprotein-specific T cell receptor transgenic mice develop spontaneous autoimmune optic neuritis. J Exp Med. 2003;197:1073–1081. doi: 10.1084/jem.20021603. [DOI] [PMC free article] [PubMed] [Google Scholar]
Associated Data
This section collects any data citations, data availability statements, or supplementary materials included in this article.