Abstract
This paper presents a new three-dimensional curvelet transform based dictionary learning for automatic segmentation of intraretinal cysts, most relevant prognostic biomarker in neovascular age-related macular degeneration, from 3D spectral-domain optical coherence tomography (SD-OCT) images. In particular, we focus on the Spectralis SD-OCT (Heidelberg Engineering, Heidelberg, Germany) system, and show the applicability of our algorithm in the segmentation of these features. For this purpose, we use recursive Gaussian filter and approximate the corrupted pixels from its surrounding, then in order to enhance the cystoid dark space regions and future noise suppression we introduce a new scheme in dictionary learning and take curvelet transform of filtered image then denoise and modify each noisy coefficients matrix in each scale with predefined initial 3D sparse dictionary. Dark pixels between retinal pigment epithelium and nerve fiber layer that were extracted with graph theory are considered as cystoid spaces. The average dice coefficient for the segmentation of cystoid regions in whole 3D volume and with-in central 3 mm diameter on the MICCAI 2015 OPTIMA Cyst Segmentation Challenge dataset were found to be 0.65 and 0.77, respectively.
Keywords: Biomarkers, Cysts, Dictionary learning, Digital curvelet transform, Optical coherence tomography, Nerve fibers, Noise, Retinal pigment epithelium, Wet macular degeneration
INTRODUCTION
Spectral-domain optical coherence tomography. (SD-OCT) is a rapidly developing noninvasive cross-sectional imaging modality which allows to investigate the presence of choroidal neovascularization activity defined as the appearance of subretinal fluid, intraretinal cysts, intraretinal fluid, subretinal pigment epithelium. (RPE) fluid, or a combination thereof to assist the diagnosis and management of neovascular age-related macular degeneration.[1] The intraretinal fluid spaces reduced retinal reflectivity than the surrounding tissues and can cause increased retinal thickness. Cyst regions can be manually segmented using SD-OCT,[2] but the manual segmentation of these regions from the large amount of imaging data produced in an SD-OCT volume may not be feasible and is time-consuming and extremely laborious. A. number of segmentation algorithms have been proposed to identify fluid-filled regions.[3,4,5] However, these methods are not fully automatic and rely on manual initialization in each B-scan to segment the volume of cystoid regions. Furthermore, OCT 2016images suffer from speckle noise which causes difficulty in the actual detection of retinal layers [Figure 1][6] and the shape of structural features such as drusens, macular holes, macular edema, nerve fiber atrophy, and cysts, that can be used as markers in clinical investigation and diagnostics of retinal diseases. Hence, before segmentation of this region in OCT images, the development of algorithmic approaches to provide noise suppression must be performed. In recent years, some approaches have been heavily investigated for speckle noise reduction, such as anisotropic diffusion-based methods,[7,8,9] wavelet–based methods,[10] dual-tree complex wavelet transformation,[11] curvelet transform,[12] contourlet transform,[13] sparsity-based denoising,[14,15] dictionary learning-based methods.[16,17]
Figure 1.
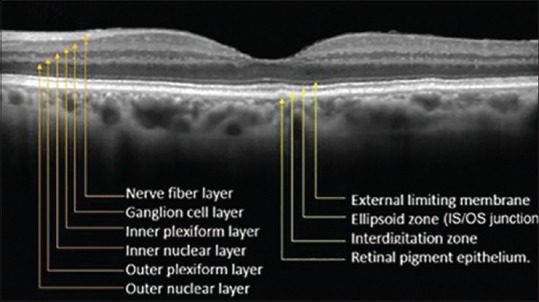
A cross-sectional, of a normal human retina with the layers identified
Here, a novel speckle noise reduction algorithm is used,[18] which is optimized to reduce speckle in an OCT image while maintaining strong edge sharpness. For this purpose, we first apply recursive Gaussian filter to the noisy image and zero possible pixels are approximated from surrounding pixels then we introduce K-SVD dictionary learning in curvelet transform domain for speckle noise reduction of three-dimensional (3D) OCT images. As the noise more affected low scale of curvelet coefficients and to take advantage of this sparse multiscale directional transform, we introduce a new scheme in dictionary learning and take curvelet transform of noisy image then denoise and modify each noisy coefficients matrix in each scale with predefined initial 3D sparse dictionary. The 3D initial dictionary for every scale in each rotation is independently selected from thresholded coefficients in the same scale and rotation of logarithmic transformation of image and does not need any high-SNR scans (averaged versions of repeated scans) for dictionary learning. After denoising 3D OCT images pixels in image are adjusted and thresholded to segment possible fluid space candidate pixels. Then nerve fiber layer (NFL) and RPE layer are extracted in each B-scan by the use of graph theory.[19] Identification of these lines is used to define our retinal regions of interest (ROI) in each B-mode image. Finally, the possible false positives (FPs) are eliminated based on standard deviation and morphology of extracted candidate pixels.
The organization of this paper is as follows. Section 2 discusses the 3D curvelet based dictionary learning denoising algorithm, and section 3 shows an implementation of the algorithm for candidate cystoid space determination as well as our generalized method for removing missed extracted pixels, and results are presented in section 4. Finally, we conclude and give some perspectives for future work.
MATERIALS AND METHODS
Image Data
We implemented the proposed method on four 3D-OCT volumes obtained from Spectralis SD-OCT. (Heidelberg Engineering, Heidelberg, Germany) system that each contained 49, 512 × 496 B-scans. The database containing retinal cysts together with manually labeled cystoid spaces were provided by the OPTIMA cyst segmentation challenge.
Optical Coherence Tomography Denoising
Although the direct analyzing of 3D data as a volume and also considering the 3D geometrical nature of the data is computationally expensive, but it has been shown that 3D analysis of 3D data outperforms 2D slice-by-slice analyzing.[20] 3D curvelet elements are plate-like shapes of 2-j/2 in two directions and width about 2-j in the orthonormal direction which are smooth within the plate and oscillates along the normal direction of the plate. The parabolic scaling, direction, tightness, and sparse representation properties of this 3D multiscale transform, provide new opportunities to analyze large data sets in medical image processing. In this paper, we used a new implementation of the 3D fast curvelet transform (3DFCT)[21,22] that has a reduced redundancy factor than the wrapping-based implementation as proposed in CurveLab Toolbox[23,24] with the strong directional selectivity property at the finest scale.
For this purpose and taking curvelet coefficients:
Cartesian coronization is performed that decomposes the object into dyadic coronae based on concentric cubes. Each corona is subdivided into trapezoidal regions conforming the usual parabolic scaling as shown in Figure 2
The 3D coefficients are obtained by applying an inverse 3D FFT to each wrapped wedge as shown in Figure 1, that appropriately fits into a 3D rectangular parallelepipeds of dimensions ~ (2j, 2j/2, 2j/2) centered at the origin.
Figure 2.
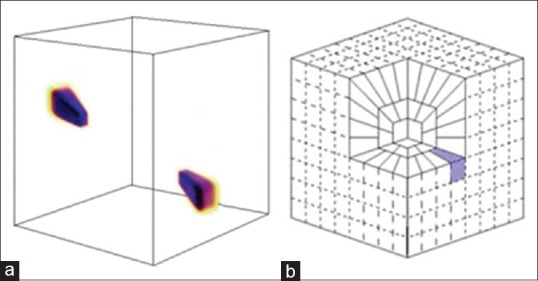
3D rendering of curvelet atom in frequency (a), and discrete frequency tiling (b), the shaded area separates three-dimensional wedge
Since the curvelet coefficients have a sparse distribution, we have only a few large coefficients that show the main structure of image and the remained coefficients tend to zero.[23] This transform maps signals and noise into different areas, and signal's energy is concentrated in a limited number of coefficients in curvelet domain.
OCT denoising can improve the image quality for the accurate analysis of image information, such as intra-retinal layers and boundaries of pathology that the results of accurate detection of these features are fully dependent on image enhancement through image denoising.[25,26] For this purpose in our selected dataset, all zero value corrupted pixels are determined from 5 × 5 × 5 surrounding pixels based on recursive Gaussian filter.[27] After removing zero pixels, we used a novel speckle noise reduction algorithm that was previously implemented on 3D, SD-OCT, Bioptigen imaging systems.[18] Our curvelet-based approach consists of first transforming the noisy image using the 3DFCT, and taking curvelet coefficients, then in curvelet domain for each scale and rotation, the coefficient matrix is independently denoised based on K-.SVD dictionary learning. A fundamental consideration in employing the KSVD dictionary learning is the selection of the start dictionary D. While some popular class of sparsity-based denoising algorithms exploits the information of the noisy image itself to define the dictionary,[14] however, the high-level of noise in the SDOCT images negatively contend with the learning process, degrades the quality of the trained dictionary. An alternative (ideal) approach is to learn the dictionary from the noiseless with high SNR image. Since in practice, such an ideal image is not available, so we select the initial dictionary from thresholded curvelet coefficients in same scale and rotation of logarithmic transformation of the noisy image [Eq. 1].
The hard threshold Tj,l is applied to each curvelet coefficients such that:

The threshold Tj,l is selected based on so-called k-sigma method,[28] in which Tj, l = k × σ1× σ2, where k is an adjustable parameter, σ1 is the standard deviation of noise from a background region in the image data, and σ2 is the standard deviation of noise in the curvelet domain at a specific scale j and orientation l.[28]
After finding the appropriate 3D initial dictionary, D, for each scale and orientation, the noisy curvelet coefficient matrixes of the noisy image in same scale and rotation are despeckled based on K-SVD dictionary learning.[19]
Since the curvelet transform is successful in dealing with edge discontinuities, it is a good candidate for edge enhancement. Hence, to enhance the contrast of intra-retinal layer boundaries, denoised curvelet coefficients, before taking 3D inverse discrete curvelet transform (3D-IDCUT), can be modified to enhance edges in an image.[29,30] A function must be defined which modifies the values of the curvelet coefficients by kc (Cj,l,p) as follows:

In Eq. 2 N = 0.2 M, here M is the maximum curvelet coefficient of the relative band. Then we reconstruct the enhanced image from the denoised and modified curvelet coefficients by applying IDCUT. The outline of the whole denoising process is shown in Figure 3.
Figure 3.
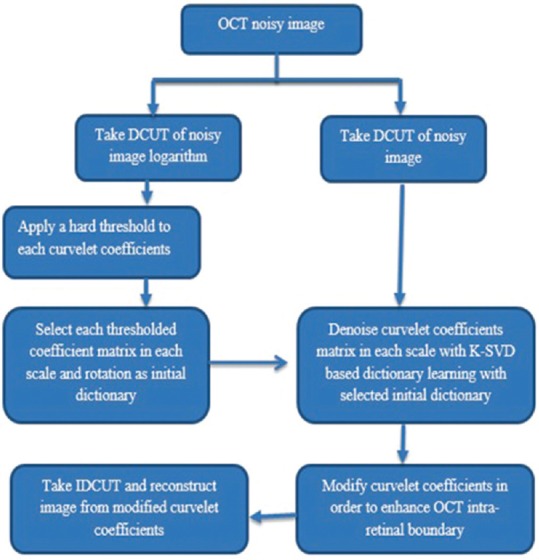
The outline of the proposed method for despeckling
Candidate Cystoid Space Determination
In this section, we present a new candidate detection algorithm to separate the dark spaces from the rest of the image. During this process, each pixel f (i, j, k) in despeckled image is adjusted as follows:

where f̄w, Max (fw) and Min (fw) are the mean, maximum and minimum intensity value of the image within a window W of size 3 × 3 × 3, respectively. The dark cystoid spaces in adjusted image is trending to zero and is extracted by applying simple threshold (t = 5).
Removing Miss Extracted Pixels
To improve the specificity, we reject FP pixels by extracting NFL and RPE layer in each B-scan by the use of graph theory.[31] We use these extracted lines to define the upper and lower bounds as retinal ROI in which we segment the cystoid fluid. Then we define and calculate the F ratio[32] and remove every connected component in ROI that has F > 4. This selection removes each connected component that has line shape structure belonging to dark regions between outer plexiform layer and outer nuclear layer. Figure 4 depicts the evaluation of F.
Figure 4.
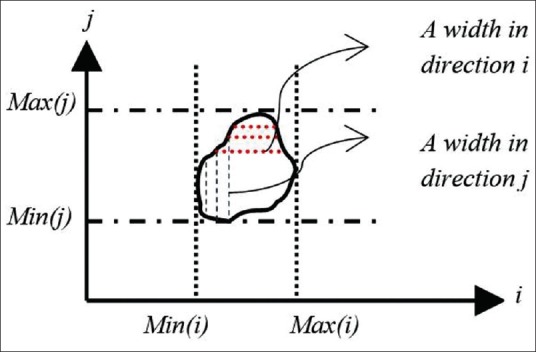
The evaluation F

Where, Mi = max (width of a connected component in direction i) and Mj = max (width of a connected component in direction j) with mi = max (i) – min (i), mj = max (j) – min (j).
The distribution of pixel intensity in cystoid spaces are also uniform[4] so final cystoid volumes are extracted by rejecting regions with a standard deviation greater than an empirically determined value of 30. Figure 5 shows the results of this algorithm after removing miss extracted connected pixels that have F > 4 and regions with a standard deviation >30.
Figure 5.
Results of this algorithm after removing miss extracted connected pixels, (a) original image (b) extracted candidate pixels (c) extracted cystoid regions after removing false positives
EXPERIMENTAL RESULTS
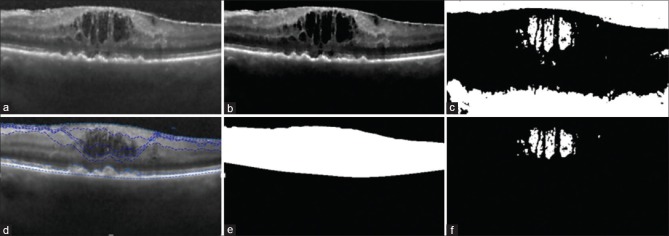
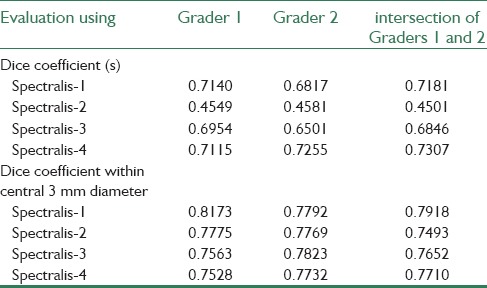
This study has focused on OCT images obtained from Spectralis SD-OCT. (Heidelberg Engineering, Heidelberg, Germany) system provided by the OPTIMA laboratory for the cyst segmentation challenge hosted at MICCAI 2015. To evaluate the performance of this automated method, the method was applied on four 3D-OCT images each contain 49 B-scans, and the dice coefficients[33] of the segmented cystoid regions entire 3D volume, were compared against the two manually labeled grader. Figure 6 shows the results of our proposed algorithm.
Figure 6.
Results of our proposed method. (a) Despeckled image, (b) adjusted image (c) candidate cystoid pixels (d) detected internal limiting membrane and retinal pigment epithelium and other layers with graph theory (e) extracted regions of interest (f) segmented cystoid pixels
The dice coefficient for each of the evaluated volumes and also the dice coefficient within central 3 mm diameter obtained for each volume are summarized in Table 1. We also computed the dice coefficients between the automated method and the intersection of the two readers for comparison.
Table 1.
Evaluation of proposed method on against the two manually labeled grader
DISCUSSION
This paper presented a new method for segmentation and quantification of the total volume occupied by intraretinal cystoid fluid from 3D OCT image. We tested our algorithm on four 3D Spectralis SD-OCT. (Heidelberg Engineering, Heidelberg, Germany) images, each containing 49 B-scans. In this paper, we use the graph theory for extraction of NFL and RPE, the upper and lower bounds as retinal ROI, to increase the accuracy of detected bounds. A limitation of our work is that in the presence of epiretinal membrane, a fine piece of scar tissue that grows on the surface of the retina, some FPs are extracted that should be distinguish from intraretinal cysts. However, the proposed method revealed promising results, but further validation studies with larger samples are needed. The performance of the proposed method will be investigated on OCT images obtained by other scanners such as Topcon and Cirrus in future steps.
CONCLUSION
This paper presented a new algorithm to detect and segment the retinal cysts in an SDOCT volume. The calculation of F-ratio that uses the shape information of detected candidate regions removes each connected component that has line shape structure and will increase the accuracy of our proposed method. Although the proposed method can accurately detect the obvious cysts, it is not sensitive to the very small cysts, and the small cystoid regions that may be connected to the dark regions between outer plexiform layer and outer nuclear layer may not be detected accurately. Other possibilities can be studied to improve the proposed algorithm by detecting vessel shades to reduce the number of Fps.
Financial Support and Sponsorship
Nil.
Conflicts of Interest
There are no conflicts of interest.
REFERENCES
- 1.Hee MR, Puliafito CA, Wong C, Duker JS, Reichel E, Rutledge B, et al. Quantitative assessment of macular edema with optical coherence tomography. Arch Ophthalmol. 1995;113:1019–29. doi: 10.1001/archopht.1995.01100080071031. [DOI] [PubMed] [Google Scholar]
- 2.de Sisternes, Simon N, Tibshirani R, Leng T, Rubin DL. Quantitative SD-OCT imaging biomarkers as indicators of age-related macular degeneration progression predicting AMD progression using SD-OCT features. Invest Ophthalmol Vis Sci. 2014;55:7093–103. doi: 10.1167/iovs.14-14918. [DOI] [PubMed] [Google Scholar]
- 3.RoyChowdhury S, Koozekanani D, Radwan S, Parhi k. Automated detection and location analysis of diabetic cysts in retinal OCT images: An iterative filtering approach. Invest Ophthalmol Vis Sci. 2013;54:4901. [Google Scholar]
- 4.Wilkins GR, Houghton OM, Oldenburg AL. Automated segmentation of intraretinal cystoid fluid in optical coherence tomography. IEEE Trans Biomed Eng. 2012;59:1109–14. doi: 10.1109/TBME.2012.2184759. [DOI] [PMC free article] [PubMed] [Google Scholar]
- 5.Zhang L, Zhu W, Shi F, Chen H, Chen X. Automated Segmentation of Intraretinal Cystoid Macular Edema for Retinal 3D OCT Images with Macular Hole. Biomedical Imaging (ISBI), 2015 IEEE 12th International Symposium on: IEEE. 2015:1494–7. [Google Scholar]
- 6.Lee JG, Rosen RB. Learning to read retinal OCT. Ophthalmology Management. 2015;19:44–6. [Google Scholar]
- 7.Aja S, Alberola C, Ruiz J. Fuzzy anisotropic diffusion for speckle filtering. IEEE Int Conf Acoust Speech Signal Process. 2001;2:1261–4. [Google Scholar]
- 8.Puvanathasan P, Bizheva K. Interval type-II fuzzy anisotropic diffusion algorithm for speckle noise reduction in optical coherence tomography images. Opt Express. 2009;17:733–46. doi: 10.1364/oe.17.000733. [DOI] [PubMed] [Google Scholar]
- 9.Yu Y, Acton ST. Speckle reducing anisotropic diffusion. IEEE Trans Image Process. 2002;11:1260–70. doi: 10.1109/TIP.2002.804276. [DOI] [PubMed] [Google Scholar]
- 10.Luisier F, Blu T, Unser M. A new SURE approach to image denoising: Interscale orthonormal wavelet thresholding. IEEE Trans Image Process. 2007;16:593–606. doi: 10.1109/tip.2007.891064. [DOI] [PubMed] [Google Scholar]
- 11.Chitchian S, Fiddy MA, Fried NM. Denoising during optical coherence tomography of the prostate nerves via wavelet shrinkage using dual-tree complex wavelet transform. J Biomed Opt. 2009;14:014031. doi: 10.1117/1.3081543. [DOI] [PubMed] [Google Scholar]
- 12.Jian Z, Yu Z, Yu L, Rao B, Chen Z, Tromberg BJ. Speckle attenuation in optical coherence tomography by curvelet shrinkage. Opt Lett. 2009;34:1516–8. doi: 10.1364/ol.34.001516. [DOI] [PMC free article] [PubMed] [Google Scholar]
- 13.Guo Q, Dong F, Sun S, Lei B, Gao BZ. Image denoising algorithm based on contourlet transform for optical coherence tomography heart tube image. IET Image Process. 2013;7:442–50. doi: 10.1049/iet-ipr.2013.0127. [DOI] [PMC free article] [PubMed] [Google Scholar]
- 14.Elad M, Aharon M. Image denoising via sparse and redundant representations over learned dictionaries. IEEE Trans Image Process. 2006;15:3736–45. doi: 10.1109/tip.2006.881969. [DOI] [PubMed] [Google Scholar]
- 15.Fang L, Li S, Nie Q, Izatt JA, Toth CA, Farsiu S. Sparsity based denoising of spectral domain optical coherence tomography images. Biomed Opt Express. 2012;3:927–42. doi: 10.1364/BOE.3.000927. [DOI] [PMC free article] [PubMed] [Google Scholar]
- 16.Fang L, Li S, McNabb RP, Nie Q, Kuo AN, Toth CA, et al. Fast acquisition and reconstruction of optical coherence tomography images via sparse representation. IEEE Trans Med Imaging. 2013;32:2034–49. doi: 10.1109/TMI.2013.2271904. [DOI] [PMC free article] [PubMed] [Google Scholar]
- 17.Kafieh R, Rabbani H, Selesnick I. Three dimensional data-driven multi scale atomic representation of optical coherence tomography. IEEE Trans Med Imaging. 2015;34:1042–62. doi: 10.1109/TMI.2014.2374354. [DOI] [PubMed] [Google Scholar]
- 18.Esmaeili M, Dehnavi AM, Rabbani H, Hajizadeh F. 3D Curvelet BasedDictionary Learning for Speckle Noise Reduction of Optical CoherenceTomography. 2015 [Google Scholar]
- 19.Aharon M, Elad M, Bruckstein A. The K-SVD: An algorithm for designing overcomplete dictionaries for sparse representation. IEEE Trans Signal Process. 2006;54:4311–22. [Google Scholar]
- 20.Rabbani H, Sonka M, Abramoff MD. Optical coherence tomography noise reduction using anisotropic local bivariate gaussian mixture prior in 3D complex wavelet domain. Int J Biomed Imaging 2013. 2013:417491. doi: 10.1155/2013/417491. [DOI] [PMC free article] [PubMed] [Google Scholar]
- 21.Woiselle A, Starck JL, Fadili J. 3-D data denoising and inpainting with the low-redundancy fast curvelet transform. J Math Imaging Vis. 2011;39:121–39. [Google Scholar]
- 22.Woiselle A, Starck JL, Fadili J. 3D curvelet transforms and astronomical data restoration. Appl Comput Harmon Anal. 2010;28:171–88. [Google Scholar]
- 23.Candes E, Demanet L, Donoho D, Ying L. Fast discrete curvelettrans forms. Multiscale Model Simul. 2006;5:861–99. [Google Scholar]
- 24.Ying L, Demanet L, Candes E. 3D discrete curvelet transform. Appl Comput Math. 2005;50:351–61. [Google Scholar]
- 25.Bonesi M, Proskurin S, Meglinski I. Imaging of subcutaneous blood vessels and flow velocity profiles by optical coherence tomography. Laser Phys. 2010;20:891–9. [Google Scholar]
- 26.Kajic V, Povazay B, Hermann B, Hofer B, Marshall D, Rosin PL, et al. Robust segmentation of intraretinal layers in the normal human fovea using a novel statistical model based on texture and shape analysis. Opt Express. 2010;18:14730–44. doi: 10.1364/OE.18.014730. [DOI] [PubMed] [Google Scholar]
- 27.Roomi SM, Lakshmi I, Kumar VA. A recursive gaussian weighted filter for impulse noise removal. GVIP J. 2006;6:33–7. [Google Scholar]
- 28.Starck JL, Candés EJ, Donoho DL. The curvelet transform for image denoising. IEEE Trans Image Process. 2002;11:670–84. doi: 10.1109/TIP.2002.1014998. [DOI] [PubMed] [Google Scholar]
- 29.Esmaeili M, Rabbani H, Dehnavi AM. Automatic optic disk boundary extraction by the use of curvelet transform and deformable variational level set model. Pattern Recognit. 2012;45:2832–42. [Google Scholar]
- 30.Esmaeili M, Rabbani H, Dehnavi AM, Dehghani A. Extraction of Retinal Blood Vessels by Curvelet Transform. 16th IEEE International Conference on Image Processing (ICIP) 2000:3353–6. [Google Scholar]
- 31.Chiu SJ, Li XT, Nicholas P, Toth CA, Izatt JA, Farsiu S. Automatic segmentation of seven retinal layers in SDOCT images congruent with expert manual segmentation. Opt Express. 2010;18:19413–28. doi: 10.1364/OE.18.019413. [DOI] [PMC free article] [PubMed] [Google Scholar]
- 32.Esmaeili M, Rabbani H, Dehnavi AM, Dehghani A. A New Curvelet Transform Based Method for Extraction of Red Lesions in Digital Color Retinal Images. Image Processing (ICIP), 2010 17th IEEE International Conference on: IEEE. 2010:4093–6. [Google Scholar]
- 33.Dice LR. Measures of the amount of ecologic association between species. Ecology. 1945;26:297–302. [Google Scholar]


