

Abstract
Acute myelogenous leukemia (AML) is a subtype of acute leukemia, which is characterized by the accumulation of myeloid blasts in the bone marrow. Careful microscopic examination of stained blood smear or bone marrow aspirate is still the most significant diagnostic methodology for initial AML screening and considered as the first step toward diagnosis. It is time-consuming and due to the elusive nature of the signs and symptoms of AML; wrong diagnosis may occur by pathologists. Therefore, the need for automation of leukemia detection has arisen. In this paper, an automatic technique for identification and detection of AML and its prevalent subtypes, i.e., M2–M5 is presented. At first, microscopic images are acquired from blood smears of patients with AML and normal cases. After applying image preprocessing, color segmentation strategy is applied for segmenting white blood cells from other blood components and then discriminative features, i.e., irregularity, nucleus-cytoplasm ratio, Hausdorff dimension, shape, color, and texture features are extracted from the entire nucleus in the whole images containing multiple nuclei. Images are classified to cancerous and noncancerous images by binary support vector machine (SVM) classifier with 10-fold cross validation technique. Classifier performance is evaluated by three parameters, i.e., sensitivity, specificity, and accuracy. Cancerous images are also classified into their prevalent subtypes by multi-SVM classifier. The results show that the proposed algorithm has achieved an acceptable performance for diagnosis of AML and its common subtypes. Therefore, it can be used as an assistant diagnostic tool for pathologists.
Keywords: Acute myelogenous leukemia, automation, bone marrow, cytoplasm, k-means clustering, support vector machine
INTRODUCTION
Leukemia is the eleventh most common cancer worldwide with more than 250,000–300,000 new cases each year,[1] and the fifth common cancer among people in Iran.[2] It refers to the cancer of blood or the bone marrow where blood cells are produced. Figure 1 shows that how stem cells become mature and evolve into several components of blood. Leukemia is characterized by the proliferation of abnormal white blood cells (WBCs) in the bone marrow without responding to cell growth inhibitors. As a result of this, the number of immature WBCs increases in the bone marrow. Therefore, one of the most significant symptoms of leukemia is the presence of an excess number of blast cells in peripheral blood, so routinely, blood smear is examined under a microscope for proper identification and classification of blast cells by hematologists.[3] Leukemia can be pathologically classified into two categories on a broader sense: (1) Acute leukemia which progresses quickly; and (2) chronic leukemia which progresses slowly. In addition, it can also be categorized based on the affected cell type as (1) myelogenous leukemia and (2) lymphocytic leukemia. These two subtypes can also be further classified into several subcategories. Therefore, specialists generally divide leukemia into four major groups [Figure 2]. In the present paper, acute myelogenous leukemia (AML) was only considered. AML is the second most common type of leukemia diagnosed in both adults and children.[4] The FAB classification system divides AML into eight subtypes, M0–M7, based on the type of cell from which leukemia developed and its degree of maturity. According to the hematologists’ opinion, more than 80% of the people with AML are included in the M2–M5 subtypes. Therefore, these four subtypes of AML, i.e., M2–M5 are much more prevalent than other subtypes, i.e., M0, M1, M6, and M7. The aim of this paper is to diagnose only the prevalent subtypes of AML. When the marrow contains more than 30% blasts, AML is confirmed. Due to its rapid spread into the bloodstream and other vital organs, it is fatal if left untreated.[4] For the recovery of patients, particularly in the case of children, early diagnosis of the disease is fundamental.[5] The precise cause of AML is still unknown. Moreover, the symptoms of the disease are fever, weakness, tiredness, or aches in bones or joints, which are very similar to the symptoms of the flu or other common diseases.[5] As a result, AML is often difficult to diagnose, but if the described symptoms are present, blood tests, such as a full blood count, renal function, electrolytes, and liver exam have to be done.[5] Since there is no staging for AML, choosing the type of treatment can vary from chemotherapy, radiation therapy, bone marrow transplant, and biological therapy.[6]
Figure 1.
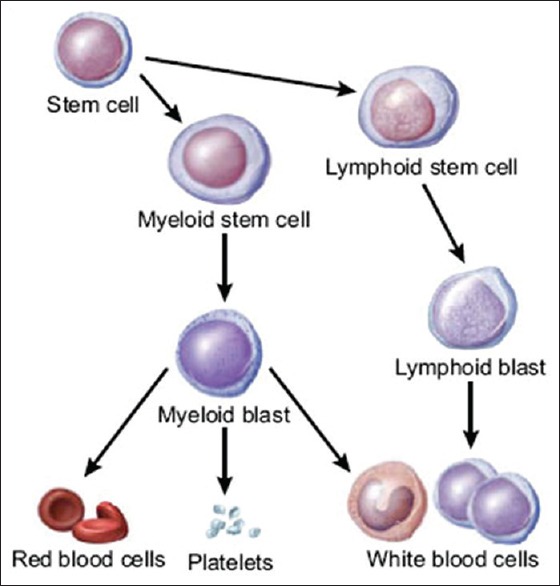
Production of blood cells in the bone marrow
Figure 2.
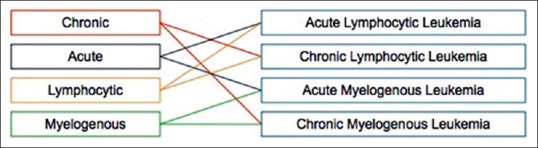
Different types of leukemia
The Purpose of Doing the Research
The most important diagnostic methodology for initial AML screening is microscopic examination of blood smear, which still remains as a standard leukemia diagnosis technique, regardless of advanced techniques such as flow cytometer, immunophenotyping, cytogenetics, molecular probing, etc. Manual examination of the slides is accompanied by inconsistent and subjective reports since they are subjected to bias such as operator experience, tiredness, and etc. For instance, the manual examination has an error rate between 30% and 40% depending on the experience of the hematologist.[7] In addition, diagnostic confusion may occur due to the imitation of similar signs by other disorders.[8] Thus, these factors can lead to the wrong diagnosis. As a result, we need a cost-effective and robust automated system for leukemia screening which can greatly improve the output without being affected by operator's ability and fatigue levels. Image processing techniques can assist pathologists to have more accurate diagnosis by improving the clarity of concerned features in WBC images. In addition, the cost of leukemia treatment can be overwhelming. The average cost of just one round of chemotherapy is $15,000.[9] Unfortunately, many patients require several rounds of chemotherapy to recover. The early and fast identification of the leukemia type greatly aids in providing the appropriate treatment for a particular type of leukemia.[10] Therefore, image processing techniques can decrease the cost of treatment by fast and parallel diagnosis in the early stages of the disease. In the past, digital image processing techniques have helped to analyze the cells that lead to more accurate, standard, and remote disease diagnosis systems. However, due to wide variation of cells in shape, size, edge, and position, there are a few complications in extracting the data from WBCs.[11] Moreover, since illumination is imbalanced, the image contrast between the cell boundaries and the background varies depending on the condition during the capturing process.[12]
Many attempts have been done in the past to construct systems that aid in acute leukemia segmentation and classification. Broadly most of the methods are based on local image information. There are four main categories in segmentation techniques: (1) Thresholding techniques, (2) boundary-based segmentation, (3) region-based segmentation, and (4) hybrid techniques that combine boundary and region criteria.[13] For peripheral blood or bone marrow smears, region-based or edge-based schemes are the most popular.[14] A proper combination of both boundary and region information may present better results than those obtained by either method on its own.[13] Many segmentation algorithms were presented in the literature. Otsu segmentation and automated histogram thresholding were employed to segment WBCs from the blood smear images.[15,16,17] A two-step segmentation process using HSV color model was used.[18] Cell segmentation using active contour models was presented.[19] Color segmentation procedure applied to leukocyte images using mean shift was described.[20] A watershed segmentation algorithm for segmenting nucleus from the surrounding cytoplasm of cervical cancer images was proposed.[14] An unsupervised color segmentation to bring out the WBCs from acute leukemia images was used.[6,21]
The usage of multilayer perceptron neural network in classifying AML and acute lymphoblastic leukemia (ALL) dataset was proposed. The result shows that the highest performance rate achieved was 58%.[22] On the other hand, modular neural network classifier was experimented and as the best performance, 75% was achieved.[23] K-nearest neighbor classifier was proposed for the classification of blast cells in acute leukemia into two types, i.e., AML and ALL. Twelve main features including color-based and shape-based features were extracted from blasts. For this study, a total number of 1500 data, 750 data for ALL, and 750 data for AML were used. Out of 1500, 1200 was considered as the train data while the rest of the data was considered as the test data. The results have shown that k-NN produced good performance in classifying both AML and ALL with high percentage of accuracy up to 86%.[24]
An automatic blast counting method for acute leukemia detection in blood microscopic images was studied. For image segmentation, histogram-based thresholding was performed on s-component of the HSV color space, followed by morphological erosion. Determination of the accurate threshold for separating nucleus from the cytoplasm is important, and no specific methods have been presented for its estimation.[25]
Moreover, many authors have proposed methods for automated leukemia identification and detection. An automatic method for the early diagnosis of ALL in blood microscopic images was presented. At first, identification and segmentation of WBCs were done by means of image clustering. Then, different types of features, such as shape, color, fractal, texture, and Fourier descriptors were extracted from the sub images. Finally, an ensemble of classifiers is trained to recognize ALL. While this method is able to recognize lymphoid blasts up to a certain extent, the system is yet to be tested with myeloid blast samples.[26]
An abnormal localization of immature precursors (ALIP) detection method was proposed to investigate the relevance with AML relapse. At first, kernelized fuzzy C-means clustering was applied to separate the foreground and background. Then, image partition was introduced to separate the overlapping cells. After that, a set of features were extracted, and support vector machine (SVM) was applied to classify precursors based on the features. Thirty-seven patients with AML were examined. ALIP efficiently was detected. The investigation also demonstrates the strong correlations of AML relapse with ALIP.[27]
In the present paper, color segmentation strategy was employed for segregating WBCs from other blood components in AML images. Different features such as fractal dimension, shape features, texture features, and color features are extracted from the nucleus in the whole images, each of which contains multiple nuclei. SVM is employed for classifying whole images based on the extracted features into healthy and leukemic. The aim of the paper is to diagnose only prevalent subtypes of AML that are M2–M5. Therefore, leukemic images are classified into five classes, i.e., M2, M3, M4, M5, and a class which consists of other types of AML, i.e., M0, M1, M6, and M7. Rest of the paper is organized as follows: methods section focuses in detail on the complete and detailed framework of the proposed model including the image acquisition process, the image processing methods used to perform enhancement and segmentation features extracted from the whole images and classification method. Experimental results and evaluation of the proposed algorithm are presented in the results section and discussion section. Finally, conclusions and future work are discussed in the conclusion section.
METHODS
Automatic classification of the blood microscopic images consists of preprocessing, segmentation, postprocessing, feature extraction. and classification. The overall working principle is depicted in Figure 3. The blood smear image consists of red blood cells, WBCs, and platelets. In the proposed method, we use color image segmentation, and our purpose is to extract WBCs from the background and finally separate nucleus from WBCs. As per acute leukemia is concerned, the cytoplasm is scanty, so we have considered only the nucleus as the region of interest and its essential features are extracted.
Figure 3.
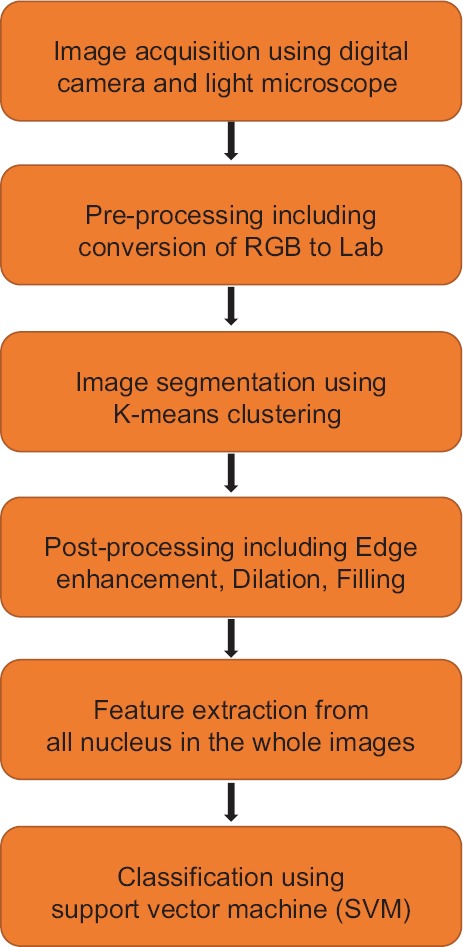
System overview
Image Acquisition
For preparing the database of this study, 17 patients with AML, who have been admitted to Shariati Hospital, including 9 males and 8 females, aged 16–69 years old, were considered. All cases were confirmed by clinical, blood, and bone marrow examination. Then, 27 peripheral blood smear and bone marrow slides of the 17 patients with AML and 10 normal persons were collected from Shariati Hospital pathology laboratories. These slides were prepared and stained using Giemsa staining for visualization of cell components. The images were captured with Olympus, a high-resolution digital camera coupled with an optical laboratory microscope, under ×100 power objective oil immersed setting and with an effective magnification of 1000. All acquired images were in JPEG format with the maximum resolution of the camera, 2592 × 1944 pixels, and with the 24 bit color depth. In this study, 330 digital images from the subtypes of AML, i.e., M0–M7, and normal blood samples have been acquired. Our data set consisted of 165 images from AML patients and 165 images from normal persons. Images from AML patients were comprised of five classes – M2, M3, M4, M5, and a class which includes M0, M1, M6, and M7 – with 33 samples in each class. To speed up the performance of the system, the resolution of the images was reduced to 184 × 138 pixels.
Preprocessing
Because of the excessive staining and also during the image acquisition process, noise may be accumulated in the images. Therefore, selective median filtering followed by unsharp masking was applied to all of the images.[28] Selective median filtering was performed to preserve minute edge details of the microscopic images.
Conversion of RGB to Lab
Typically, an image can be represented with the help of three color components. The images generated by digital microscopes are usually in RGB color space, which are difficult to segment. In practice, various reasons such as camera settings, varying illumination, and aging stain may cause the blood cells and image background to vary greatly with respect to color and intensity. For making the cell segmentation robust with respect to these variations, reducing memory requirement and improving the computational time, an adaptive procedure is used: The RGB input image is converted into the CIELAB or more correctly, the CIEL*a*b* color space.[29,30] This color space consists of a luminosity layer L*, which represents the lightness of the color, chromaticity layers, a* that represents its position between red/magenta and green, and b* that represents its position between yellow and blue. Since all the color information is in a* and b* layers, we use these two components for nucleus segmentation. Moreover, the perceptual difference between colors is proportional to the Cartesian distance in the CIELAB color space. Therefore, the color differences between two samples can be calculated using Euclidean distance. L*a*b produces a proportional change visually for a change of the same amount in color value due to its perceptual uniformity. Therefore, every minute difference in the color value is noticed visually. Figure 4 presents an example of RGB to CIELAB color conversion.[31]
Figure 4.

Example of RGB to Lab conversion and segmentation result
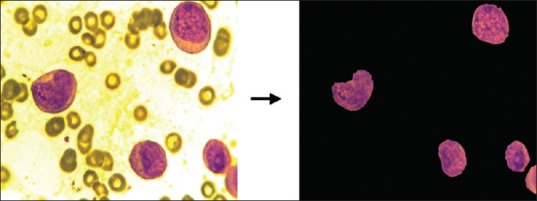
Image Segmentation
The purpose of image segmentation was to extract important information from an input image. It plays a key role since the efficiency of the subsequent feature extraction and classification relies greatly on correct segmentation. K-means clustering algorithm is one of the most popular clustering algorithms from an image segmentation perspective. It is a center-based clustering algorithm which is efficiently employed for clustering large and high-dimensional databases.[32] This technique clusters the data into fixed number of clusters so that the means of these clusters are placed as far away as possible from each other. Every data point is associated to the nearest mean and belongs to one of the clusters.[33]
In this system, color-based clustering segmentation is performed for extracting the nuclei of the leukocytes. In fact, each pixel of an object has two values (a* and b*). Depending on these two values, we classify each pixel into four clusters, because we want to segment the entire image into four regions, i.e., nucleus, cytoplasm, other cells (e.g., erythrocytes), and background stain. Therefore, each pixel in the Lab color space was classified into any of the four clusters by calculating the Euclidean distance between the pixel and each color indicator so that each pixel of the entire image will be labeled to a particular color depending on the minimum distance from each indicator. Since we want to extract nucleus features, we have considered the cluster which contains nucleus. The cluster related to the nuclei will be determined experimentally. Based on the experimental results, the cluster with the minimum red color was the cluster related to the nuclei. Therefore, the mean “a*” and “b*” values were calculated for each cluster center and the cluster with the minimum value was considered as cluster of nuclei. Figure 4 presents an example of segmentation procedure.[31]
Postprocessing
In some of the segmented images, only the edges of the nuclei were obtained as opposed to the whole images of the nuclei. This shortcoming was overcome by employing morphological filtering which improves the perceptibility and visibility of the concerned region. It should be noted that selecting the size of the structuring element is important for morphological operators. The size should be smaller than the minimum size of the nucleus that will be determined. Since all the objects smaller than the structuring element were eliminated. On the other hand, it must be large enough to eliminate the stain artifacts areas. To obtain the desired outcome, the following actions were performed.
Edge enhancement
To improve the segmentation of grouped cells and subsequent edge detection, Sobel operator was used. This helps to enhance the borders of the membranes and the cells.[34]
Canny edge detection
To obtain outputs with continuous edges, canny edge detector was used.[35,36]
Dilation
To connect the separated points of the membrane in a better way, dilation was used which gives a good outline of the perimeter of the nuclei. In this paper, a 2 × 2 structuring element was used for dilation.
Hole-filling
To fill internal holes of the connected elements, hole-filling was used.
Feature Extraction
Feature extraction in image processing is a technique of redefining a large set of redundant data into a set of feature vectors of reduced dimension.[29] In this phase, the idea is to extract the descriptors that best approach the visual patterns to which the pathologists refer and at the same time most relevant to the subsequent step of classification. A correct choice of feature is a very crucial step, since feature selection greatly influences the classifier performance. Based on the expert opinion from a couple of hematologists, it was noticed that to construct an effective feature set, certain features should be considered, since they gave a good classification. Therefore, several features were extracted including Hausdorff dimension (HD), irregularity, nucleus-cytoplasm ratio (N:C ratio), shape features, texture features, and color features. These features were extracted from whole images in our system. Figure 5 gives the set of features chosen to classify the image database.
Figure 5.
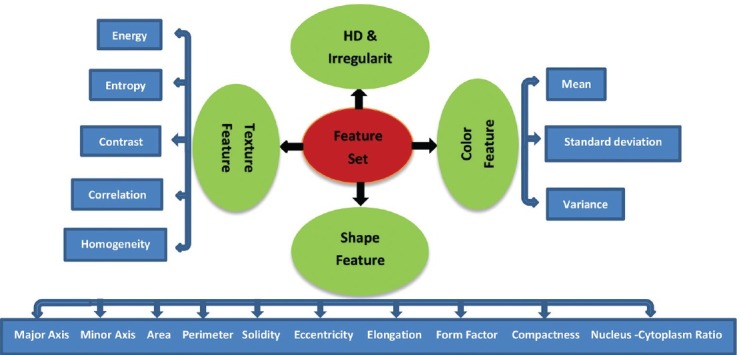
Feature set used for the proposed system
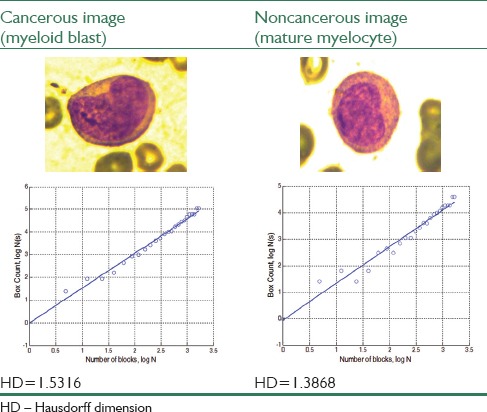
Hausdorff dimension
Fractals have been used in medicine and science earlier for various quantitative measurement.[37,38] One of the most important measures that indicates whether a particular nucleus represents a myeloblast or a mature myelocyte is perimeter roughness of the nucleus. In fact, myeloblast can be differentiated using perimeter roughness of the nucleus. All fractal dimensions are real numbers that characterize the fractalness (texture/roughness) of the objects. HD is an essential theoretical fractal dimensions and will be an essential quantitative measure for cell boundary roughness measurement. The procedure for HD measurement using box counting method[39] is introduced below as an algorithm:
Binary image is obtained from the gray-level image of the blood sample by thresholding
Canny edge detection technique is employed to trace out the nucleus boundaries
A grid of (N) squares is superimposed over the edges, and then the edge occupied squares are counted; the finer the grid gets, the more accurate is the shape approximated
-
The HD may then be defined as in Eq. 1
where, N is the number of squares in the superimposed grid and N (s) is the number of occupied squares or boxes. Higher HD signifies higher degree of roughness.
Irregularity
Irregularity of the nucleus boundary is a significant feature for labeling a WBC nucleus as a blast cell. The nucleus boundary can be represented by a contour of dimension two. For measuring irregularity of the contour, it is better to calculate distances from each contour point or edge pixels to a reference point. A convenient reference for the entire contour is the centroid or center of mass since most nucleus has irregular shapes. Euclidean distance measurement from the centroid to the contour points is described as follows:
Nucleus boundary pixel indices are obtained from the edge image obtained during HD measurement
Centroid coordinates of the nucleus region is calculated using the relations as defined in Eqs. 2 and 3
Euclidean distance is calculated from each boundary pixel to the centroid
-
Variance of all the distances from the centroid obtained in the third step is calculated to measure the irregularity of the nucleus boundary
where (x, y) are the coordinates of the pixels along the contour and N is the total number of the pixels on the contour.
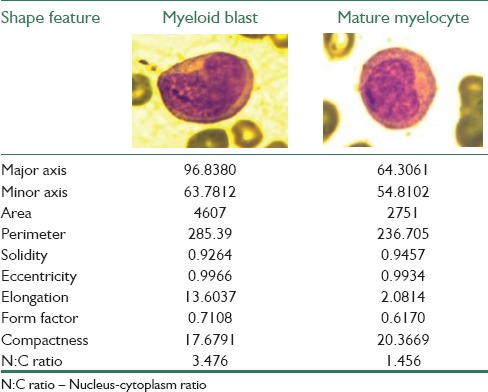
Shape features
All shape features are extracted from the binary equivalent image of the nucleus where the nucleus region is represented by nonzero pixels. According to the hematologists, the shape of the nucleus is an essential feature for discrimination of myeloblasts. For shape analysis of the nucleus, region, and boundary-based shape features are extracted. Based on the extracted features under two classes, i.e., region- and boundary-based, the quantitative evaluation of each nucleus is done. The shape features are as follows:
Minor axis: The length of the shortest line which passes through the centroid of the nucleus, in pixel
Major axis: The length of the longest line which passes through the centroid of the nucleus, in pixel
Area: The area was determined by counting the total number of none zero pixels within the image region
Perimeter: It is obtained by calculating distance between successive boundary pixels
-
Solidity: The ratio of actual area and convex hull area is known as solidity. This measure is defined in Eq. 4

-
Eccentricity: This parameter is used to measure how much a shape of a nucleus deviates from being circular. It is an important feature since mature myelocytes are more circular than myeloblasts. To measure this, a relation is defined in Eq. 5
where a is the major axis and b is the minor axis of the nucleus region
-
Elongation: Abnormal bulging of the nucleus is also a feature which signifies toward leukemia. Hence, the nucleus bulging is measured in terms of a ratio called elongation. This is defined as the ratio between maximum distance (Rmax) and minimum distance (Rmin) from the centroid to the nucleus boundary pixels and is given by Eq. 6
-
Form factor: It is a dimensionless parameter which measures the circularity of the nucleus and is defined as Eq. 7
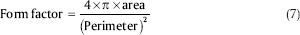
-
Compactness: Compactness or circularity is representing the degree to which a shape is compact. The circle is the most compact shape since among the shapes with the same perimeter, it has the least area. This measure is defined in Eq. 8
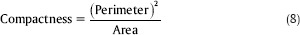
This way to measure shape compactness is taken from the isoperimetric inequality
-
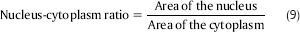
N:C ratio: It is a ratio of the area of the nucleus to the area of the cytoplasm. The N:C ratio indicates the maturity of a cell because as a cell matures, the size of its nucleus generally decreases. Hence, “blast” forms of erythrocytes, leukocytes, and megakaryocytes start with an N:C ratio of 4:1, which decreases as they mature to 2:1 or even 1:1. Therefore, N:C ratio is really discriminative feature in our proposed system. This measure is defined in Eq. 9.
Color features
Mean (µ), standard deviation (σ), and coefficient of variance (CV) of the nucleus images were considered as the color characteristics.
Texture features
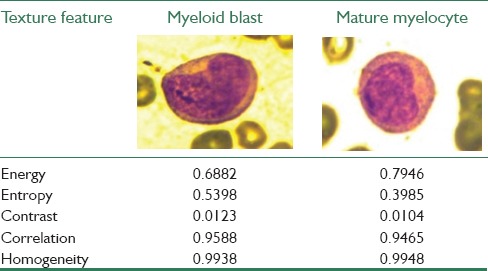
Nucleus texture measurements were performed on the grayscale version of the nucleus images. Texture was defined as a function of the spatial variation in pixel intensities. Gray-level pixel distribution can be described by the second order statistics such as the probability of two pixels having particular gray levels at particular spatial relationships. This information can be depicted in two-dimensional gray-level co-occurrence matrices (GLCM), which can be computed for various distances and orientations. Haralick[40] defined some statistical measures to extract textural characteristics from the GLCM. Some of these features are as follows:
-
Energy: It is used to measure uniformity (or angular second moment)

-
Entropy: This parameter is used for measuring the disorder of an image. When the image is not texturally uniform, entropy is very large

-
Contrast: The contrast feature is used for measuring the amount of local variations present in the image

-
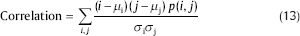
Correlation: The correlation feature is used for calculating regional-pattern linear dependence in the image
-
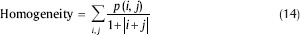
Homogeneity: It is a measure of the degree of variation.
It should be noted that before classification step, all these selected features should be normalized. The normalization process gives a significant contribution to the classifier performance because it balances different features regarding their ranges. In fact, it makes all features lie within a predetermined range of (0, 1), and this step will positively affect the classifier performance. Since some of the features have large values and without normalization, these large values may cause features with lower values to be neglected and have no effect on the classifier.[41] Therefore, all feature vectors were normalized to have zero mean and standard deviation equal to 1 using the Eq. 15:

where xi, min and xi, max are the minimum and maximum values of the feature xi and x̂i is the normalized value.
Classification
In the classification step, based on the feature vectors achieved in the previous step, at first cancerous and noncancerous images should be distinguished and then common subtypes of AML, i.e., M2–M5 should be classified. In this paper, since the patterns were very close in the feature space, SVM was employed for classification. SVM is a promising nonlinear, nonparametric classification technique, which already showed good results in various fields such as medical diagnostics.[42] Moreover, the SVM is a powerful algorithm with strong theoretical foundations based on the Vapnik–Chervonenkis theory and it has strong generalization regarding to the new data. In the case of SVMs, a data point is viewed as an m-dimensional vector, and the question is that whether such points can be separated with a hyperplane.[27] There are many hyperplanes that might classify the data. The general idea of SVM is to find the best hyperplane which represents the largest separation or margin between the two classes.[43] In fact, SVM constructs a decision surface in the feature space by different kernel functions; linear or nonlinear such as quadratic, polynomials, and radial basis functions (RBF).
It should be noted since, in the first step, there were two classes, two-class SVM classifier was used, and in the second step because of the existence of five classes, multiclass SVM classifier was employed. To find the efficient kernel which gives the maximum accuracy in the classification, an experiment was done. Various SVM kernels were tested, and their accuracies were compared (polynomial with range [1, 10] and RBF with sigma range: [1, 10]). Finally, it was found out that RBF kernel with sigma 3 has the best performance.
RESULTS
The superiority of the scheme is demonstrated with the help of an experiment. A microscopic blood image of size 184 × 138 is considered for this purpose. The input image is processed sequentially as per the steps mentioned in methods section. Figure 6 presents the result of RGB to CIELAB color conversion. The segmented output of the image obtained after applying K-means clustering algorithm is shown in Figure 7.
Figure 6.

The result of RGB to CIELAB conversion
Figure 7.
Segmentation result
Feature extraction can be done using presented methods over whole images. First of all, for calculating the perimeter roughness of each nucleus using the procedure explained in the methods section, we should extract the nucleus boundaries whose roughness is measured by HD using box counting method. The results of box counting algorithm are shown by a graphical plot. The straight line in the plot represents the line of best fit and HD is achieved from the polynomial coefficients of this line equation. The difference between the values of the HD for a pair of cancerous and noncancerous nucleus is shown in Table 1.
Table 1.
Result of Hausdorff dimension
In the next step, for calculating the irregularity, the centroid of the nucleus contour is determined using the relation 2 and 3. Euclidean distance between the centroid and boundary pixels is measured. The variance of all the distances is found to be 462.812 for cancerous nucleus and 38.873 for noncancerous nucleus. Similarly, the shape features are also measured using the relations given in the methods section. Table 2 displays the differences in the values of the shape features for a pair of cancerous and noncancerous nuclei.
Table 2.
Results of various shape features
Color and texture features are also extracted from the image nucleus sample and recorded. The differences in the values of the color and texture features for a pair of cancerous and noncancerous nuclei are tabulated in Tables 3 and 4, respectively. Similarly, all the mentioned features were extracted from all 330 blood smear images and used for classification.
Table 3.
Results of various color features
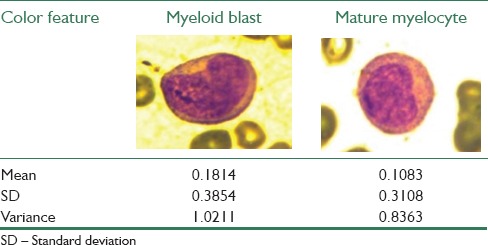
Table 4.
Results of various texture features
The results obtained for the values of the different features are also verified by hematologists. It is observed that there are noticeable differences between the values of the features for cancerous and noncancerous nuclei. Therefore, although the features used in the study are simple, they are really discriminative and effective features.
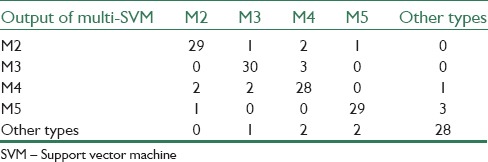
Confusion matrices which are achieved from binary SVM classification for cancerous and noncancerous images and multi-SVM classification for AML prevalent subtypes can be seen in Tables 5 and 6, respectively.
Table 5.
Confusion matrix achieved from binary support vector machine classifier
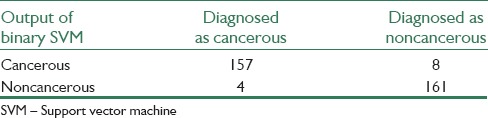
Table 6.
Confusion matrix achieved from multi-support vector machine classifier
Following the classification using the SVM, a statistical method called cross-validation is used for evaluating and comparing learning algorithms. Cross-validation is a technique for judging how the results of statistical analysis will generalize to an independent data set. In this paper, the k-fold cross validation technique with k = 10 has been used as validation technique. In this technique, the dataset is randomly partitioned into k equal-sized subsets. Of the k subsets, a single subset is retained as the validation data for testing the model, and the remaining k − 1 subsets are used as training data. The cross-validation process is then repeated k times, with each of the k subsets used exactly once as the validation data. The k results from the folds can then be averaged to produce a single estimation.
The performance of the binary classifier is evaluated by three parameters, i.e., sensitivity, specificity, and accuracy. These parameters are defined in relation to the four possible outcomes of the classifier, which are: true positives (TP), when cancerous images are correctly identified; false positives (FP), when noncancerous images are identified as cancerous; true negatives (TN), when noncancerous images are correctly identified; and false negatives (FN), when cancerous images are identified as noncancerous.
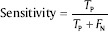
Sensitivity: This parameter is the probability of being cancerous among the people diagnosed as cancerous. It is defined as:
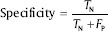
Specificity: This criterion is the probability of being noncancerous among the people diagnosed as noncancerous. It is defined as:
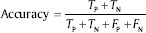
Accuracy: This parameter shows the closeness of the output of the classifier and real value. It is defined as:
The results of the proposed system for binary SVM classifier show that sensitivity, specificity, and accuracy are 95%, 98%, and 96%, respectively. For multi-SVM classifier, an accuracy of 87% has been achieved. Therefore, an effective and a reliable source of classification of AML and its common sub-types provided.
DISCUSSION
Many of the previously proposed methods were able to recognize ALL up to a certain extent, but they have not yet been tested for identification and detection of AML. Moreover, some of these methods which were applied to AML and had good results, have used a proprietary dataset, so the reproducibility of the experiment and comparisons with other methods was not possible. In fact, many authors tested their system with their own data sets, which were not publicly available. Thus, we could not directly compare our findings with the results obtained by various proposed systems. As a result, to have a comparison, we had to implement their methods on our dataset. A set of four existing systems that employ the same color correlation, segmentation, and classification techniques as the proposed system, were taken into consideration. Figure 8 presents comparisons between the proposed system and the existing systems while performing on our data set.[9,29,44,45]
Figure 8.
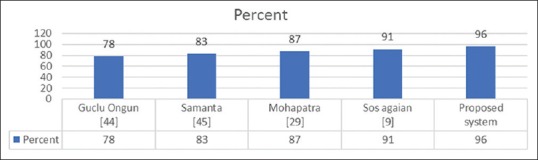
Accuracy of existing systems versus proposed system
The advantage of the proposed system over the existing systems is that it not only enables the classification of whole images containing multiple nuclei but also presents a better performance when compared with the existing systems.
The main contribution of this study is the use of the mentioned methods for detection of common subtypes of AML, i.e., M2–M5, which has not been done before. Pervious works usually focused on the detection of cancerous and noncancerous images and did not work on AML subtypes. This fact can be considered as the significance and novelty of the work.
CONCLUSION
This paper has proposed an automatic identification system for AML and its prevalent subtypes, which performs processing, including color correlation, segmentation of the nucleated cells, and effective validation, and classification. To obtain all the information required for performing efficient classification, a feature set exploiting the shape, color, and texture parameters of a cell are constructed. By referring to the classification results as mentioned in “Results” section, it is obvious that although our proposed methods are relatively simple, this algorithm demonstrates satisfactory performance for the diagnosis between AML patients and normal persons and also for the detection of prevalent subtypes of AML, i.e., M2, M3, M4, and M5. Hence, the proposed algorithm can be used as an assistant diagnostic tool for pathologists.
Further research will focus on the segmentation of cytoplasm and extraction features from it, to improve the performance of the presented system. Moreover, the proposed method can be used for the classification of all subtypes of AML. Therefore, it will also be necessary to expand the size of the data set to provide the classification model with a greater number of samples in the training phase.
Financial Support and Sponsorship
Nil.
Conflicts of Interest
There are no conflicts of interest.
Acknowledgment
The authors would like to thank the pathology group of the Shariati Hospital for providing blood smear and bone marrow samples, especially they wish to appreciate Dr. Farid Kosari and Dr. Salma Sefidbakht, Faculty of Medicine, Department of Pathology, Tehran University of Medical Sciences, for providing ground truth information and guidance which helped us significantly in conducting the research.
REFERENCES
- 1.Fallah M. Cancer Incidence in Five Provinces of Iran: Ardebil, Gilan, Mazandaran, Golestan and Kerman, 1996-2000. 2007 [Google Scholar]
- 2.Sadjadi A, Nouraie M, Mohagheghi MA, Mousavi-Jarrahi A, Malekezadeh R, Parkin DM. Cancer occurrence in Iran in 2002, an international perspective. Asian Pac J Cancer Prev. 2005;6:359–63. [PubMed] [Google Scholar]
- 3.Haworth C, Heppleston AD, Morris Jones PH, Campbell RH, Evans DI, Palmer MK. Routine bone marrow examination in the management of acute lymphoblastic leukaemia of childhood. J Clin Pathol. 1981;34:483–5. doi: 10.1136/jcp.34.5.483. [DOI] [PMC free article] [PubMed] [Google Scholar]
- 4.Piuri V, Scotti F. Morphological Classification of Blood Leucocytes by Microscope Images. In 2004 IEEE International Conference on Computational Intelligence for Measurement Systems and Applications. CIMSA. 2004:103–8. [Google Scholar]
- 5.Scotti F. Automatic Morphological Analysis for Acute Leukemia Identification in Peripheral Blood Microscope Images. In 2005 IEEE International Conference on Computational Intelligence for Measurement Systems and Applications. CIMSA. 2005:96–101. [Google Scholar]
- 6.Abdul Nasir A, Mashor M, Rosline H. Penang: 2011. Unsupervised Colour Segmentation of White Blood Cell for Acute Leukaemia Images. In 2011 IEEE International Conference on Imaging Systems and Techniques (IST) pp. 142–5. [Google Scholar]
- 7.Amin MM, Kermani S, Talebi A, Oghli MG. Recognition of acute lymphoblastic leukemia cells in microscopic images using k-means clustering and support vector machine classifier. J Med Signals Sens. 2015;5:49–58. [PMC free article] [PubMed] [Google Scholar]
- 8.Serbouti S, Duhamel A, Harms H, Gunzer U, Aus H, Mary JY, et al. Image segmentation and classification methods to detect leukemias. Vol. 13. Proceedings of the Annual International Conference of the IEEE Engineering in Medicine and Biology Society. 1991:260–1. [Google Scholar]
- 9.Agaian S, Madhukar M, Chronopoulos AT. Automated screening system for acute myelogenous leukemia detection in blood microscopic images. IEEE Syst J. 2014;8:995–1004. [Google Scholar]
- 10.Khashman A, Al-Zgoul E. Vol. 27. Wisconsin, USA: World Scientific and Engineering Academy and Society; 2010. Image segmentation of blood cells in leukemia patients. Recent Advances in Computer Engineering and Application; pp. 104–9. [Google Scholar]
- 11.Mandal D, Panetta K, Agaian S. Face Recognition Based on Logarithmic Local Binary Patterns. Proceedings SPIE, Image Processing, Algorithms and Systems. 2013;8655:865514. [Google Scholar]
- 12.Sadeghian F, Seman Z, Ramli AR, Abdul Kahar BH, Saripan MI. A framework for white blood cell segmentation in microscopic blood images using digital image processing. Biol Proced Online. 2009;11:196–206. doi: 10.1007/s12575-009-9011-2. [DOI] [PMC free article] [PubMed] [Google Scholar]
- 13.Sezgin M. Survey over image thresholding techniques and quantitative performance evaluation. J Electron Imaging. 2004;13:146–68. [Google Scholar]
- 14.Nallaperumal K, Krishnaveni K. Watershed segmentation of cervical images using multiscale morpholigcal gradient and HSI color space. Int J Imaging Sci Eng. 2008;2:212–6. [Google Scholar]
- 15.Setarehdan, Setarehdan SK, Singh S. Springer-Verlag, London, Berlin: Springer Science & Business Media; 2012. Advanced Algorithmic Approaches to Medical Image Segmentation: State-of-the-art Applications in Cardiology, Neurology, Mammography and Pathology. [Google Scholar]
- 16.Scotti F. Robust Segmentation and Measurements Techniques of White Cells in Blood Microscope Images. Proceedings of the IEEE Conference on Instrumentation and Measurement Technology. IMTC. 2006:43–8. [Google Scholar]
- 17.Chang CC, Lin CJ. LIBSVM: A library for support vector machines. ACM Trans Intell Syst Technol. 2011;2:27. [Google Scholar]
- 18.Sinha N, Ramakrishnan AG. Automation of differential blood count. In TENCON 2003. Vol. 2. IEEE Conference on Convergent Technologies for the Asia-Pacific Region. 2003:547–51. [Google Scholar]
- 19.Ongun G, Halici U, Leblebicioglu K, Atalay V, Beksac M, Beksac S. An Automated Differential Blood Count System. Vol. 3. Proceedings of the 23rd Annual International Conference of the IEEE Engineering in Medicine and Biology Society. 2001:2583–6. [Google Scholar]
- 20.Comaniciu D, Meer P. Advanced Algorithmic Approaches to Medical Image Segmentation. Vol. 10. London: Springer; 2002. Cell image segmentation for diagnostic pathology; pp. 541–58. [Google Scholar]
- 21.Mohapatra S, Patra D, Satpathy S. Unsupervised blood microscopic image segmentation and leukemia detection using color based clustering. Int J Comput Inf Syst Ind Manag Appl. 2012;4:477–85. [Google Scholar]
- 22.Toure A, Basu M. Application of neural network to gene expression data for cancer classification. Vol. 1. IEEE International Joint Conference on Neural Network (IJCNN) 2001:583–7. [Google Scholar]
- 23.Ryu J, Cho SB. Gene Expression Classification Using Optimal Feature/Classifier Ensemble with Negative Correlation. Vol. 2. IEEE International Joint Conference on Neural Network (IJCNN) 2002:198–203. [Google Scholar]
- 24.Supardi NZ, Mashor MY, Harun NH, Bakri FA, Hassan R. Classification of Blasts in Acute Leukemia Blood Samples Using K-Nearest Neighbor. 2012 IEEE 8th International Colloquium on Signal Processing and its Applications. 2012:461–5. [Google Scholar]
- 25.Halim NH, Mashor MY, Hassan R. Automatic blasts counting for acute leukemia based on blood samples. Int J Res Rev Comput Sci. 2011;2:971. [Google Scholar]
- 26.Mohapatra S, Patra D, Satpathy S. An ensemble classifier system for early diagnosis of acute lymphoblastic leukemia in blood microscopic images. Neural Comput Appl. 2014;24:1887–904. [Google Scholar]
- 27.Huang HQ, Fang XZ, Shi J, Hu J. Abnormal localization of immature precursors (ALIP) detection for early prediction of acute myelocytic leukemia (AML) relapse. Med Biol Eng Comput. 2014;52:121–9. doi: 10.1007/s11517-013-1122-x. [DOI] [PubMed] [Google Scholar]
- 28.Mohapatra S, Patra D. Automated Leukemia Detection Using Hausdorff Dimension in Blood Microscopic Images. 2010 IEEE International Conference on Emerging Trends in Robotics and Communication Technologies (INTERACT) 2010:64–8. [Google Scholar]
- 29.Mohapatra S, Patra D. Automated Cell Nucleus Segmentation and Acute Leukemia Detection in Blood Microscopic Images. 2010 IEEE International Conference on Systems in Medicine and Biology (ICSMB) 2010:49–54. [Google Scholar]
- 30.Hu JL, Deng JB, Sui MX. Color Space Conversion Model from CMYK to LAB Based on Prism. IEEE International Conference on Granular Computing. 2009:235–8. [Google Scholar]
- 31.Labati RD, Piuri V, Scotti F. All-IDB: The Acute Lymphoblastic Leukemia Image Database for Image Processing. 2011 18th IEEE International Conference on Image Processing (ICIP) 2011:2045–8. [Google Scholar]
- 32.Gan G, Ma C, Wu J. Vol. 20. Philadelphia: Siam; 2007. Data Clustering: Theory, Algorithms, and Applications. [Google Scholar]
- 33.Verma NK, Roy A, Vasikarla S. Medical Image Segmentation Using Improved Mountain Clustering Technique Version-2.), 2010 Seventh International Conference on Information Technology: New Generations (ITNG) 2010:156–61. [Google Scholar]
- 34.Agaian S, Almuntashri A. A New Edge Detection Algorithm in Image Processing Based on LIP-Ratio Approach. Processing SPIE, Image Processing, Algorithms and Systems. 2010;7532:753204. [Google Scholar]
- 35.Panetta KA, Agaian SS, Nercessian SC, Almunstashri AA. Shape-dependent canny edge detector. Opt Eng. 2011;50:087008. [Google Scholar]
- 36.Canny J. A computational approach to edge detection. IEEE Trans Pattern Anal Mach Intell. 1986;8:679–98. [PubMed] [Google Scholar]
- 37.Milne BT. Measuring the fractal geometry of landscapes. Appl Math Comput. 1988;27:67–79. [Google Scholar]
- 38.Lopez CM, Agaian S. A New Set of Wavelet-and Fractals-Based Features for Gleason Grading of Prostate Cancer Histopathology Images. Vol. 8655. Processing SPIE, Image Processing, Algorithms and Systems. 2013:865516–1. [Google Scholar]
- 39.Pentland AP. Fractal-based description of natural scenes. IEEE Trans Pattern Anal Mach Intell. 1984;6:661–74. doi: 10.1109/tpami.1984.4767591. [DOI] [PubMed] [Google Scholar]
- 40.Haralick RM. Statistical and Structural Approaches to Texture. Proc IEEE. 1979;67:786–804. [Google Scholar]
- 41.Ramezani M, Karimian A, Moallem P. Automatic detection of malignant melanoma using macroscopic images. J Med Signals Sens. 2014;4:281–90. [PMC free article] [PubMed] [Google Scholar]
- 42.Agarwal A, Chapelle O, Dudík M, Langford J. A reliable effective terascale linear learning system. J Mach Learn Res. 2014;15:1111–33. [Google Scholar]
- 43.Saberkari H, Shamsi M, Joroughi M, Golabi F, Sedaaghi MH. Cancer classification in microarray data using a hybrid selective independent component analysis and υ-support vector machine algorithm. J Med Signals Sens. 2014;4:291–8. [PMC free article] [PubMed] [Google Scholar]
- 44.Ongun G, Halici U, Leblebicioglu K, Atalay V, Beksaç M, Beksaç S. Feature Extraction and Classification of Blood Cells for an Automated Differential Blood Count System. Vol. 4. Proceedings of the International Joint Conference In Neural Networks. 2001:2461–6. [Google Scholar]
- 45.Mohapatra S, Samanta SS, Patra D, Satpathi S. Fuzzy Based Blood Image Segmentation for Automated Leukemia Detection. 2011 IEEE International Conference on Devices and Communications (ICDeCom) 2011:1–5. [Google Scholar]