Abstract
Arrestins are cytosolic proteins that regulate G protein-coupled receptor (GPCR) desensitization, internalization, trafficking, and signaling1,2. Arrestin recruitment uncouples GPCRs from heterotrimeric G proteins, and targets them for internalization via clathrin-coated pits3,4. Arrestins also function as ligand-regulated scaffolds that recruit multiple non-G protein effectors into GPCR-based ‘signalsomes’5,6. While the dominant function(s) of arrestins vary between receptors, the mechanism whereby different GPCRs specify divergent arrestin functions is not understood. Using a panel of intramolecular FlAsH-BRET reporters7 to monitor conformational changes in arrestin3, we show here that GPCRs impose distinctive arrestin ‘conformational signatures’ that reflect the stability of the receptor-arrestin complex and role of arrestin3 in activating or dampening downstream signaling events. The predictive value of these signatures extends to structurally distinct ligands activating the same GPCR, such that the innate properties of the ligand are reflected as changes in arrestin3 conformation. Our findings demonstrate that information about ligand-receptor conformation is encoded within the population average arrestin3 conformation, and provide insight into how different GPCRs can use a common effector for different purposes. This approach may have application in the characterization and development of functionally selective GPCR ligands8,9 and in identifying factors that dictate arrestin conformation and function.
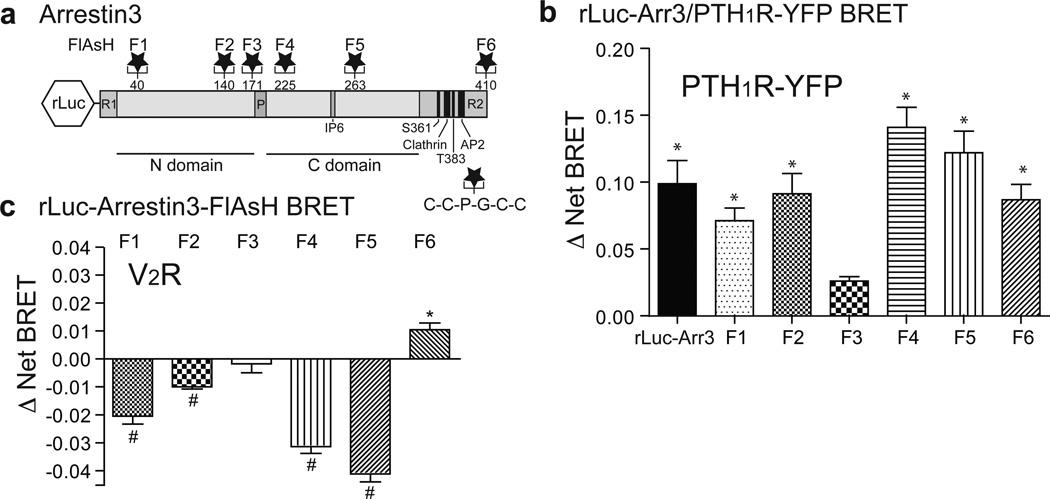
The two non-visual arrestins, arrestin2 and arrestin3 (β-arrestin1 and β-arrestin2, respectively), bind to and regulate the majority of extra-retinal GPCRs1,2. Both static crystallographic structures10–14 and biophysical studies in live cells15, 16 indicate that arrestins undergo conformational rearrangement upon GPCR binding. To probe the impact of GPCR activation on the dynamics of arrestin3 conformation and function, we prepared a series of intramolecular fluorescent arsenical hairpin (FlAsH) bioluminescence resonance energy transfer (BRET) probes7 by inserting the six amino-acid motif, C-C-P-G-C-C, into the arrestin3 sequence at sites not predicted to be involved in its interactions with receptors or major binding partners (Fig. 1a). Each probe (rLuc-arrestin3-FlAsH1–6) was designed to measure BRET between a Renilla luciferase (rLuc) fluorescence donor at the N-terminus, and a fluorescent arsenical acceptor located at one of six positions along the length of arrestin3. We hypothesized that observing changes in BRET efficiency from multiple vantage points would yield an arrestin3 ‘conformational signature’ that would correlate with its molecular functions. We first tested whether insertion of the FlAsH motif compromised arrestin3 recruitment by measuring the agonist-induced increase in intermolecular BRET between a C-terminal YFP-tagged GPCR and the N-terminal rLuc moiety of each rLuc-arrestin3-FlAsH construct. As shown in Fig. 1b, five of the rLuc-arrestin3-FlAsH constructs (F1, F2, F4, F5 and F6) generated BRET signals comparable to unmodified rLuc-arrestin3. The sixth construct (F3), which was poorly recruited, was included in subsequent experiments as an internal negative control. We then tested whether GPCR activation would produce an intramolecular rLuc-arrestin3-FlAsH BRET signal upon recruitment to an untagged GPCR. Agonist stimulation elicited changes in the arrestin3-FlAsH BRET signal (Δ Net BRET) that were maintained over at least 10 min (see Extended Data Fig 1a) and proportional to receptor occupancy at less than saturating ligand concentration (see Extended Data Fig 1b). Thus, measuring the Δ Net BRET of each construct produced an arrestin3-FlAsH BRET signature that was characteristic of the receptor being interrogated (Fig. 1c). For the vasopressin 2 receptor (V2R), ligand stimulation caused significant decreases in the signal from FlAsH sensors in the N-terminal (F1 and F2) and C-terminal (F4 and F5) globular domains, and a significant increase in signal from the sensor located at the C-terminus (F6). Predictably, given its poor recruitment, the F3 construct did not significantly change with stimulation.
Figure 1. Design and characterization of rLuc-arrestin-3 FlAsH BRET reporters.
a, Six rLuc-arrestin3-FlAsH BRET reporters (F1-F6) were constructed by inserting the amino acid motif, C-C-P-G-C-C, following amino acid residues 40, 140, 171, 225, 263, and 410 of arrestin3. The location of each FlAsH motif is shown in relation to the globular N and C domains of arrestin3, as well as the clathrin and adapter protein 2 (AP2) binding sites and reported phosphorylation sites (Ser361 and Thr383) in the arrestin3 C-terminal regulatory (R2) domain1. b, Intermolecular BRET demonstrating ligand-dependent recruitment of rLuc-arrestin3 FlAsH1–6 to hPTH1R. The bar graph depicts Mean ± s.e.m. of independent biological replicates (n=3). c, rLuc-arrestin3-FlAsH1–6 ‘signature’ of arrestin3 binding to the V2R. The bar graph depicts mean ± s.e.m. of independent biological replicates (n=5). In all panels; * p<0.05, # p<0.005 greater or less than vehicle stimulated control.
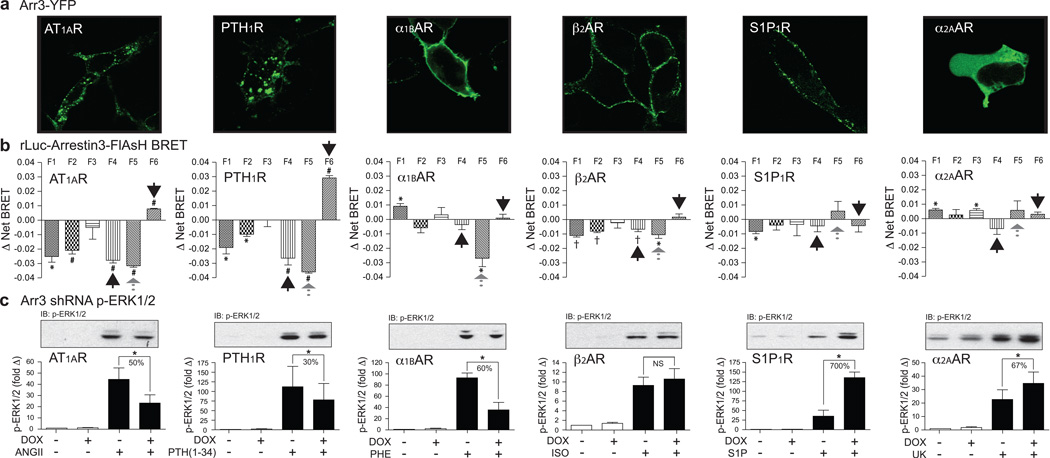
To determine whether arrestin3-FlAsH signatures were conserved between GPCRs, we selected a panel of six receptors with diverse G protein coupling, arrestin binding, and arrestin-dependent signaling characteristics (see Extended Data Table 1). Our test panel included two stable arrestin binding ‘class B’17 GPCRs; the angiotensin AT1A receptor (AT1AR) and the type 1 parathyroid hormone receptor (PTH1R); three transient arrestin binding ‘class A’17 GPCRs, the α1B adrenergic receptor (α1BAR), the β2 adrenergic receptor (β2AR), and the sphingosine 1-phosphate 1 receptor (S1P1R); and the α2A adrenergic receptor (α2AAR) that does not produce detectable arrestin3 translocation. The G protein-mediated signaling of each receptor was characterized using a FLIPRTETRA to measure ligand dependent activation/inhibition of adenylyl cyclase and stimulation of transmembrane Ca2+ entry18 (see Extended Data Fig. 2). The pattern of arrestin recruitment was confirmed by confocal fluorescence microscopy using GFP-tagged arrestin319 (Fig. 2a). The arrestin3-FlAsH BRET signature generated by each receptor is shown in Fig. 2b. Since the Δ Net BRET observed with each probe reflects the ‘population average’ conformation of the cellular pool of rLuc-arrestin3-FlAsH, signatures were generated under conditions of receptor excess and saturating ligand concentration to ensure that the largest possible fraction of the reporter pool was receptor-bound at steady state. Inspection of the rLuc-arrestin3-FlAsH BRET signatures revealed that the ‘class B’ receptors, AT1AR, PTH1R, and V2R (shown in Fig. 1c), which form stable GPCR-arrestin complexes that transit to endosomes17, produced significant negative Δ Net BRET signals at the F4 position and positive Δ Net BRET signals at the C-terminus (Fig 2b; black arrows). In contrast, the ‘class A’ α1BAR, β2AR and S1P1R, which dissociate from arrestin soon after internalization17, produced little to no signal in these positions. Only small N-terminal responses were observed with the α2AAR, which interacts weakly with arrestin320.
Figure 2. Relationship between GPCR-arrestin3 complex formation, rLuc-arrestin3-FlAsH BRET signature, and arrestin-dependent ERK1/2 activation for six different GPCRs.
a, Agonist-dependent recruitment of arrestin3-GFP. Each panel depicts a representative field of stimulated cells. Arrestin3-GFP was diffusely cytosolic in the absence of agonist (not shown). b, Receptor-specific rLuc-arrestin3 FlAsH1–6 signatures. Each bar graph depicts Mean ± s.e.m. of independent biological replicates (n=5). * p<0.05, # p<0.005, † p<0.001, greater or less than vehicle stimulated. c, Effect of downregulating arrestin2/3 expression on GPCR-mediated ERK1/2 phosphorylation. A representative phospho-ERK1/2 immunoblot is shown above a bar graph depicting the mean +/− s.e.m. of independent biological replicates (n=5, S1P1R and α2AAR; n=6, α1BAR; n=7, AT1AR; n=9, PTH1R; n=20, β2AR). Responses were normalized to the basal level of phospho-ERK1/2 in non-stimulated samples. * p<0.05, greater or less than stimulated response in non-induced cells. NS, no significant difference.
To relate the arrestin3-FlAsH BRET signature to arrestin-dependent signaling, we determined the effect of silencing arrestin2/3 expression on ligand-stimulated ERK1/2 activation21, 22 using HEK293 FRT/TO arrestin2/3 shRNA cells that carry tetracycline-inducible shRNA targeting arrestin2/323. As shown in Fig. 2c, ERK1/2 activation by the AT1AR, PTH1R, and α1BAR was significantly attenuated by arrestin2/3 silencing, indicating a positive signaling role for arrestin scaffolds24. Arrestin2/3 silencing had no net effect on ERK1/2 activation by the β2AR, which reportedly activates ERK1/2 via both Gi/o-dependent and arrestin-dependent pathways in HEK293 cells25, and significantly enhanced ERK1/2 activation by the S1P1R and α2AAR, suggesting that for these receptors the major role of arrestins is to dampen G protein-dependent ERK1/2 activation by promoting desensitization. Consistent with this, we found that ERK1/2 activation via the β2AR, S1P1R and α2AAR, was strongly pertussis toxin-sensitive, indicating a predominantly Gi/o-mediated mechanism of activation (see Extended Data Fig. 3). Comparison with the rLuc-arrestin3-FlAsH BRET signatures revealed a correlation between arrestin-dependent ERK1/2 activation and a significant negative Δ Net BRET signal at the F5 position. This was most striking for the ‘class A’ α1BAR, which lacked the F4 and F6 signals characteristic of ‘class B’ receptors, but retained the F5 signal shared by GPCRs mediating arrestin-dependent signals (Fig. 2b; gray arrows). The relationship between α1BAR-induced F5 signal and ERK1/2 activation was present over a range of agonist concentration (see Extended Data Fig. 4a), while at saturating ligand concentration the F5 signal readily separated the positive and negative roles of arrestin in ERK1/2 activation by our panel of seven GPCRs (see Extended Data Fig. 4b).
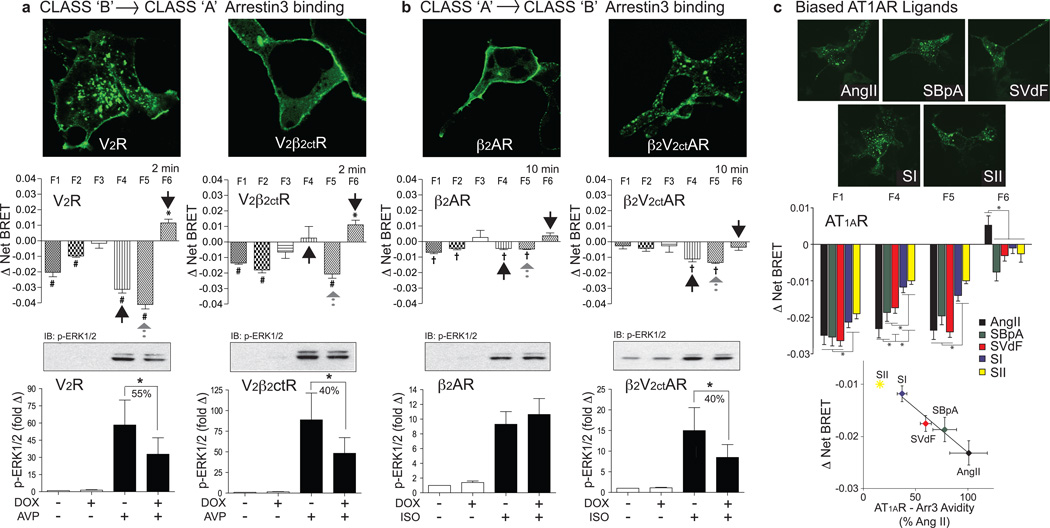
We next examined chimeric GPCRs wherein the receptor C-tail was exchanged to reverse the ‘class A’ and ‘class B’ patterns of arrrestin binding. As shown in Fig. 3a, replacing the C-tail of the ‘class B’ V2R with that of the ‘class A’ β2AR (V2β2ctR) is sufficient to reverse the arrestin binding pattern26. While the C-tail exchange affected the stability of the receptor-arrestin complex, it did not affect arrestin-dependent ERK1/2 activation, which persisted in the V2β2ctR. Comparison of the rLuc-arrestin3-FlAsH BRET profiles generated by the V2R and V2β2ctR revealed that conversion of ‘class B’ to ‘class A’ binding caused the loss of the negative F4 signal characteristic of class B receptors like the AT1AR, PTH1R, and V2R (Fig. 2b). In contrast, the F5 signal was preserved, such that the rLuc-arrestin3-FlAsH BRET signature of the chimeric V2β2ctR resembled that of the α1BAR, the other ‘class A’ GPCR that retained arrestin signaling. The opposite experiment, involving conversion of a ‘class A’ receptor to ‘class B’, is shown in Fig. 3b. Replacing the C-tail of the ‘class A’ β2AR with that of the ‘class B’ V2R (β2V2ctR) reverses the arrestin binding pattern. In this case, β2V2ctR mediated ERK1/2 activation became more arrestin-dependent, as evidenced by acquired sensitivity to shRNA silencing of arrestin2/3 expression. Inspection of the arrestin3-FlAsH BRET profiles of the β2R and V2β2ctR revealed that conversion of ‘class A’ to ‘class B’ produced a significant increase in the F4 signal that was most apparent following 10min of ligand stimulation. Notably, the F5 signal also increased, consistent with the gain of arrestin-dependent signaling. Thus, reversing the stability of the arrestin-GPCR complex, without altering the other intracellular loops of the receptor, was sufficient to produce loss/gain of FlAsH BRET signal at the F4 position, while the magnitude of change in the F5 position correlated with arrestin-dependent signaling.
Figure 3. Impact of GPCR-arrestin trafficking pattern and ligand structure on the rLuc-arrestin3 FlAsH BRET conformational signature.
a, Effect of converting stable ‘class B’ arrestin3 binding to transient ‘class A’ binding. The upper panels depict representative confocal fluorescence images showing the pattern of ligand-stimulated GFP-arrestin3 recruitment to the V2R or the chimeric V2β2ctR. The center panels depict the arrestin3-FlAsH1–6 profiles generated by V2R and V2β2ctR. The lower panels depict the arrestin-dependence of ERK1/2 phosphorylation by the V2R and V2β2ctR. b, Analogous experiment demonstrating the effect of converting transient ‘class A’ arrestin3 binding to stable ‘class B’ binding using the β2AR and the chimeric β2V2ctAR. c, Effect of ligand structure on the rLuc-arrestin3-FlAsH BRET signature. The upper panels depict representative confocal fluorescence images showing the pattern of GFP-arrestin3 recruitment to the AT1AR upon stimulation with AngII, SBpA, SVdF, SI or SII. The center panel depicts the F1-4-5-6 profiles generated by each ligand. The lower panel depicts the relationship between the amplitude of the F4 signal and the independently determined avidity of AT1AR and arrestin3 measured by FRAP27. SII (*) was not included in the linear fit, as the AT1AR-Arr3 avidity is too low to measure by FRAP27. In all panels, the rLuc-arrestin3-FlAsH BRET graphs represent mean ± s.e.m. of independent biological replicates (n=5, V2R and V2β2ctR; n=6, β2AR and β2V2ctR; n=6, AT1AR with each ligand). * p<0.05, # p<0.005, † p<0.001, greater or less than vehicle stimulated control. In panels a and b, the phospho-ERK1/2 bar graphs depict Mean +/− s.e.m. of independent biological replicates (n=12, V2R and V2β2ctR; n=20, β2AR; n=12 β2V2ctR). * p<0.05, less than stimulated response in non-induced cells.
We then compared the arrestin3-FlAsH-BRET signature generated by angiotensin II (AngII) with those of a previously characterized series of arrestin-selective ‘biased’ AngII analogs28 (Fig. 3c). While all five ligands; AngII, [Sar1,Ile4,Ile8]-AngII (SII), [Sar1,Ile8]-AngII (SI), [Sar1,Val5,D-Phe8]-AngII (SVdF), and [Sar1,Val5,Bpa8]-AngII (SBpA), promote the assembly of endosomal AT1AR-arrestin complexes, fluorescence recovery after photobleaching (FRAP) has demonstrated that they engender different avidity between the receptor and arrestin3, with the rank order of receptor-arrestin complex half-life of AngII > SBpA > SVdF > SI > SII27. The efficiency with which these ligands promote arrestin-dependent ERK1/2 activation corresponds to the avidity of the complex, with longer half-life complexes generating proportionally greater arrestin-dependent signaling27. Inspection of the arrestin3-FlAsH BRET signatures demonstrated that while different ligands had little effect on the magnitude of the N-terminal F1 shift, the amplitude of the F4 and F5 signals were very sensitive to ligand structure. Plotting the F4 signal versus receptor-arrestin avidity measured by FRAP revealed a strong linear correlation. Thus, the signature presented by arrestin3-FlAsH BRET probes in the C-terminal domain reflected the avidity of the AT1AR-arrestin3 interaction, even when comparing ligands that all evoke a canonical ‘class B’ pattern of arrestin recruitment.
The rLuc-arrestin3-FlAsH BRET signature reflects both changes in the distance/orientation of the fluorophores due to conformational rearrangement, and steric effects generated by arrestin interaction with its receptor and non-receptor binding partners. While it is not possible to ascribe the rLuc-arrestin3-FlAsH BRET signal at a given position to specific conformational shifts or engagement of binding partners, our data clearly demonstrate that ligand/GPCR complexes confer distinctive arrestin3 conformations, and that features of the conformational signature are conserved between receptors with similar arrestin binding/signaling characteristics. Moreover, we find that the Δ Net BRET at selected positions correlates with downstream arrestin function, e.g. ‘class A’ versus ‘class B’ trafficking and arrestin-dependent ERK1/2 activation, suggesting that arrestin3-FlAsH BRET probes can predict arrestin function based on the ligand-induced conformational signature. Thus, intramolecular rLuc-arrestin3-FlAsH BRET probes may aid in identifying the factors that determine arrestin conformation and function, such as ligand ‘bias’8,9, GPCR C-tail ‘phosphorylation codes’ written by different GRKs28, and post-translational modifications of arrestin that stabilize/destabilize the complex29.
While this work was in progress, we became aware of a complementary study using arrestin3-FlAsH FRET sensors30. This study confirms the existence of GPCR-specific arrestin3 conformations, and with the superior temporal resolution of FRET provides key insights into the kinetics of receptor binding and arrestin activation.
METHODS
Materials
Cell culture medium and cell culture additives were from Life Technologies (Grand Island, NY). FuGENE HD transfection reagent and Promega GloSensor™ cAMP reagent were from Fisher Scientific (Pittsburgh, PA). FLIPR Calcium 5 Assay Kit was from Molecular Devices, Inc. (Sunnyvale, CA). Lipofectamine 2000 and TC-FlAsH™ II In-Cell Tetracysteine Tag Detection Kits were from Invitrogen (Grand Island, NY). hPTH(1–34) was obtained from Bachem, Inc. (Torrance, CA). Angiotensin II, [Arg8]-vasopressin, isoproternol, phenylephrine, and UK14303 were from Sigma-Aldrich (St. Louis, MO). Sphingosine 1-phosphate (S1P) was from Avanti Polar Lipids Inc. (Alabaster, AL). SI was from MP Biomedicals (Santa Ana, CA). SVdF and SBpA were synthesized by the Department of Pharmacology and Therapeutics, McGill University (Montreal, Quebec, Canada). Rabbit polyclonal anti-arrestin2/3 was a gift from Robert J. Lefkowitz (Duke University, Durham, NC). Anti-phospho-ERK1/2 IgG (T202/Y204; #9101) and anti-ERK1/2 IgG (#4695) were from Cell Signaling Technology (Beverly, MA). Horseradish peroxidase-conjugated donkey anti-rabbit IgG was from Jackson Immuno-Research Laboratories, Inc. (West Grove, PA).
Renilla luciferase-arrestin3 FlAsH BRET reporters
The pcDNA3.1 plasmid encoding rat arrestin3 tagged at the N-terminus with Renilla luciferase (rLuc) was a gift from M. Bouvier (University of Montreal, Montreal, Quebec, Canada). A series of six rLuc-arrestin3-FlAsH BRET reporters were constructed by inserting a cDNA sequence encoding the amino acid motif, C-C-P-G-C-C, immediately following amino acid residues 40, 140, 171, 225, 263, and 410 of arrestin3, using a modification of the precise gene fusion PCR method of Yon and Fried31. For each construct, two PCR steps were performed using the primer sets shown in Extended Data Table 2. The first step was to generate two PCR fragments using the primer pairs: RlucHindF/FlashR and FlashF/RlucApalR. One PCR product contained a HindIII restriction site at the 5’ end and the CCPGCC FlAsH motif at the 3’ end, and the other contained the complementary FlAsH sequence at the 5’ end and an ApaI restriction site at the 3’end. A second PCR step was used to fuse the two fragments using three primers: RlucHindF, FlashR and RluApalR, and the two PCR fragments as template DNA. The resultant full-length arrestin3 PCR product containing the FlAsH motif insert was digested with HindIII and ApaI and cloned into the parent rLuc-arrestin3 plasmid to generate the rLuc-arrestin3-FlAsH1–6 expression plasmids. All constructs were verified by dideoxynucleotde sequencing.
Cell culture and transfection
HEK293 cells (ATCC CRL1573) were from the American Type Culture Collection. HEK-293 GloSensor™ cells were from Promega Corp. (Madison, WI). HEK293 cells were maintained in minimum essential medium supplemented with 10% fetal bovine serum and 1% antibiotic/antimycotic solution. The HEK293 FRT/TO arrestin2/3 shRNA cell line carrying tetracycline-inducible shRNA simultaneously targeting the arrestin2 and 3 isoforms (5’-CGTCCACGTCACCAACAAC-3’) was generated as previously described23. These cells were maintained in Dulbecco’s modified Eagle medium supplemented with 10% fetal bovine serum, 1% antibiotic/antimycotic solution and 50µg/mL zeocin, 50µg/mL blasticidin, and 50µg/mL puromycin to maintain selection. Transient transfections were performed using Lipofectamine 2000 or FuGENE HD according to the manufacturer's protocols. Prior to experimentation, cells were serum-deprived overnight in 1% fetal bovine serum growth medium. Cells were not tested for mycoplasma contamination.
FLIPRTETRA assay of calcium influx
HEK293 cells in 6-well plates were transiently transfected with 1µg of plasmid cDNA encoding the angiotensin AT1A, type 1 parathyroid hormone (PTH1R), α1B adrenergic (α1BAR), β2 adrenergic (β2AR), sphingosine 1-phosphate 1 (S1P1R), or α2A adrenergic (α2AAR) receptors, using Lipofectamine 2000. 24h after transfection, cells were seeded onto collagen coated black-wall clear-bottom 96-well plates (BD Biosciences, San Jose, CA), allowed to grow for 24h, then serum deprived overnight. Fresh FLIPR Calcium 5 assay reagent (100 µl/well) was added to 100µl of serum deprivation medium and plates were incubated for an additional 1h prior to stimulation. Stimulations were carried out on a FLIPRTETRA (Molecular Devices, Sunnyvale, CA) with 470–495nm excitation and 515–575nm emission filters as previously described18. All assays were performed using saturating ligand concentrations: AngII (0.1µM), hPTH(1–34) (0.1µM), isoproterenol (1µM), phenylephrine (10µM), S1P (1µM) or UK14303 (10µM) and run at room temperature. The instrument was programmed to simultaneously dispense 50µl of vehicle control, 5× ligand, or the calcium ionophore A23187 (10µM), from the drug plate into the 200µl of medium in the corresponding wells of the assay plate to achieve the final ligand concentration. Fluorescence was recorded every 1sec for 10 reads to establish baseline fluorescence, then every 1sec for 300 reads. Raw data representing the time-fluorescence relationship for each well were exported to Microsoft Excel for background subtraction and analysis.
FLIPRTETRA assay of cAMP production
Assays were performed using HEK293 GloSensor™ cAMP cells that stably express a genetically encoded biosensor composed of a cAMP binding domain fused to a mutated form of Photinus Pyralis luciferase32. 24h following transient transfection with plasmid cDNA encoding the receptors of interest, HEK293 GloSensor™ cAMP cells were seeded onto poly-d-lysine coated white-wall clear-bottom 96-well plates (BD Biosciences, San Jose, CA). cAMP assays were performed 72h after transfection as previously described16. cAMP reagent medium was prepared by adding 200 µl of freshly thawed GloSensor™ cAMP reagent to 10 mL of serum free MEM buffered with 10mM HEPES; pH 7.4. The growth medium was gently aspirated and replaced with 100 µl/well of pre-warmed cAMP reagent medium. Plates were incubated at 37°C with 5% CO2 for 1.5 h, then removed from the incubator and incubated at room temperature in the dark for an additional 30 min. Stimulations were performed at room temperature in the FLIPRTETRA using saturating ligand concentrations. Luminescence was recorded every 1sec for 10 reads to establish baseline luminescence, then every 1sec for 50 reads. Thereafter, luminescence was recorded every 2sec for 600 reads. Raw data representing the time-luminescence relationship for each well following ligand addition was exported to Microsoft Excel for background subtraction and analysis. All responses were normalized to the cAMP luminescence generated in response to 10µM forksolin. To assay Gi-mediated inhibition of cAMP production (α22AR and S1P1R), cells were pre-incubated with or without agonist for 30 min, then stimulated with 10 µM forskolin.
Intermolecular BRET using rLuc-arrestin3 and PTH1R-YFP
HEK 293 cells were transiently transfected with 1.5µg of plasmid DNA encoding the C-terminal yellow fluorescent protein (YFP)-tagged PTH1R33 and 0.15µg of either rLuc-arrestin3 or one of the rLuc-arrestin3-FlAsH constructs using Fugene HD. 48h after transfection, cells were detached, collected by centrifugation, resuspended in BRET buffer [1mM CaCl2, 140mM NaCl, 2.7mM KCl, 900µM MgCl2, 370µM NaH2PO4, 5.5mM d-glucose, 12mM NaHCO3, 25mM HEPES; pH 7.4] and aliquotted into white-wall clear-bottom 96-well plates at a density of 100,000 cells per well. Background and total Venus fluorescence were read on an OptiPlate™ microplate reader (PerkinElmer, Waltham, MA) with 485nm excitation and 525–585 emission filters. Cells were stimulated with 0.1µM PTH(1–34) for 2min and coelenterazine was then added to a final concentration of 5µM. Luciferase (440–480nm) and Venus (525–585nm) emissions were read to calculate the BRET ratio (emission eYFP/emission Rluc). Net BRET ratio was calculated by background subtracting the BRET ratio measured for vehicle versus ligand treated cells in the same experiment.
Intramolecular FlAsH BRET using the rLuc-arrestin3-FlAsH constructs
HEK293 cells seeded in 6-well plates were co-transfected with 1.5µg of plasmid DNA encoding the receptor of interest and 0.1µg of DNA encoding one rLuc-arrestin3-FlAsH construct using Fugene HD. 48h after transfection, cells were detached, collected by centrifugation, and resuspended in 600 µl of Hank’s balanced salt solution. TC-FlAsH™ II In-Cell Tetracystein detection reagent was added at 2.5µM final concentration and the cells incubated at room temperature for 30 min, after which they were washed using 1× BAL buffer from the TC-FlAsH™ kit, resuspended in BRET buffer and placed in white-wall clear-bottom 96-well plates at a density of 100,000 cells per well. Background and total TC-FlAsH fluorescence were read on an Optiplate™ microplate reader (Perkin-Elmer, Waltham, MA) with 485nm excitation and 525–585 emission filters. Except as noted in the figure legends, all stimulations were carried out at saturating ligand concentration: AngII (0.1µM), [Arg8]-vasopressin (1µM), hPTH(1–34) (0.1µM), isoproterenol (1µM), phenylephrine (10µM), S1P (1µM), SBpA (1µM), SI (1µM) SVdF (1µM), or UK14303 (10µM). Cells were exposed to agonist for 2 to 10 min, after which coelenterazine was added at a final concentration of 5µM. Six consecutive readings of luciferase (440–480nm) and TC-FlAsH (525–585nm) emissions were taken, and the BRET ratio (emission eYFP/emission Rluc) calculated using Berthold Technologies Tristar 3 LB 941. The Δ net change in intramolecular BRET ratio for each of the six rLuc-arrestin3-FlAsH constructs was calculated by background subtracting the BRET ratio measured for cells in the same experiment stimulated with vehicle only.
Confocal microscopy
For determining the pattern of GPCR-arrestin trafficking, HEK293 cells were seeded into collagen-coated 35mm glass bottom Petri dishes (MatTek Corp., Ashland, MA) and co-transfected with 1.3µg of plasmid DNA encoding the receptors of interest and 0.7µg of plasmid encoding green fluorescent protein (GFP)-tagged arrestin319 using FuGene HD. Forty-eight h after transfection, cells were serum derived for 4h, stimulated with a saturating ligand concentration for 8min, fixed with 4% paraformaldehyde in phosphate buffered saline for 30min and washed with 4°C saline. Arrestin distribution was determined by confocal microscopy performed on a Zeiss LSM510 META laser-scanning microscope with 60× objective using 488nm excitation and 505–530nm emission wavelengths. Measurement of AT1AR-Arr3 avidity was performed as previously published27. HEK293 cells stably expressing AT1AR and transfected with Arrestin3-pEYFP were stimulated with AngII (1µM) or analogs (10µM) for 15 min, after which endosomes were bleached and fluorescence recovery was monitored every 30sec over a period of 5 min.
Immunoblotting
HEK293 FRT/TO arrestin2/3 shRNA cells were used to determine the contribution of arrestins to GPCR-stimulated ERK1/2 activation23,34. Cells in 12-well plates were transiently transfected with 1µg of plasmid cDNA encoding the receptor of interest using FuGENE HD. 24h after transfection, downregulation of arrestin2/3 expression was induced by 48 h exposure to 1µM doxycycline. After overnight serum deprivation, cells were stimulated with for 5min, after which monolayers were lysed in 1× Laemmli sample buffer. Stimulations were performed at saturating ligand concentration, except as noted in the figure legends, Lysates containing 10µg of whole cell protein were resolved by sodium dodecyl sulfate polyacrylamide gel electrophoresis and transferred to polyvinylidine difluoride membranes. Immunoblots of phospho-ERK1/2, total ERK1/2, and arrestin2/3 were performed using rabbit polyclonal IgG with HRP-conjugated goat anti-rabbit IgG as secondary antibody. Proteins were visualized using enhanced chemiluminescence (PerkinElmer, Wellesley, MA).
Statistical analysis
The sample size (n) reported in each figure legend refers to number of independently performed biological replicates in the dataset. All analyzable data points were included in the statistical analyses. No pretest sample size calculation was performed. For experimental methods that were highly reproducible, e.g. measurement of Δ Net BRET, five to six biological replicates were sufficient to discern effects of +/− 0.01 with p<0.05. For experimental methods with greater variability between replicates, e.g. fold ERK1/2 activation, five to 20 biological replicates were necessary to discern effects of arrestin2/3 silencing that were +/− 10% of the control response with p<0.05. The experimenter was not blinded. All values are expressed as Mean ± SEM (n≥5). For comparisons between two groups, statistical significance was assessed with a two-tailed unpaired t-test. Computations were performed and graphs constructed with the GraphPad Prism 4.0 scientific graphing, curve fitting, and statistics program (GraphPad Software, San Diego, CA).
Extended Data
Extended Data Figure 1. Time course and relationship of the arrestin3 intramolecular FlAsH BRET signal to receptor occupancy.
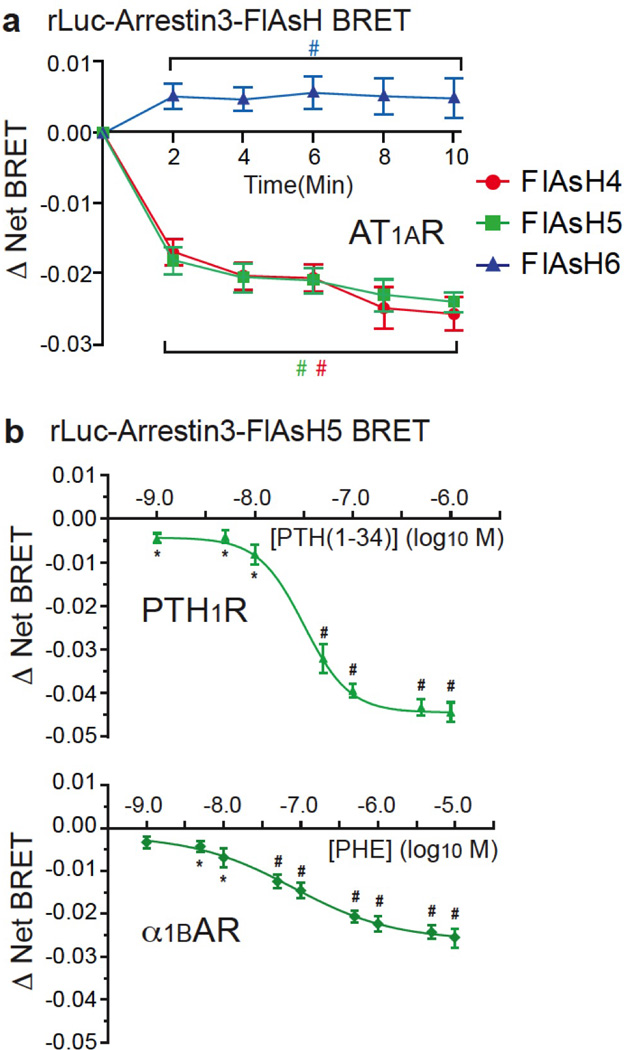
a, Time course of AT1AR-induced changes in intramolecular FlAsH BRET. HEK293 cells were co-transfected with plasmid cDNA encoding AT1AR and the indicated rLuc-arrestin3 FlAsH reporter. Stimulations were carried out at a saturating concentration of AngII for the indicated times. The graph depicts the mean ± s.e.m. of independent biological replicates of ligand-induced Δ Net BRET for each rLuc-arrestin3-FlAsH construct (n=6). b, Ligand concentration dependence of PTH1R- and α1BAR-induced changes in intramolecular FlAsH BRET. HEK293 cells were co-transfected with plasmid cDNA encoding the PTH1R or α1BAR and the rLuc-arrestin3 FlAsH5 reporter. Stimulations were for 2 min using the indicated agonist concentration. The graph depicts the mean ± s.e.m. of independent biological replicates of ligand-induced Δ Net BRET (n=5). The EC50 for PTH(1–34) (PTH1R) and phenylephrine (α1BAR) were 30 nM and 80 nM, respectively. In all panels; * p<0.05, # p<0.005 greater or less than vehicle stimulated control.
Extended Data Figure 2. G protein coupling profiles of selected GPCRs.
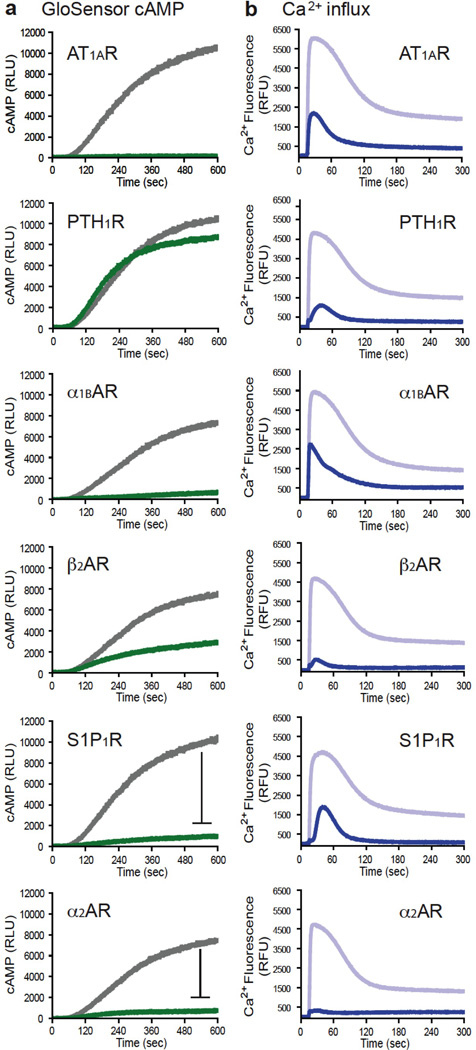
a, Representative time courses of cAMP luminescence following stimulation of HEK293 GloSensor™ cAMP cells transfected with each of six GPCRs. For the Gi/o-coupled S1P1R and α2AAR, stimulations were carried out in the presence of 10µM forskolin to detect inhibition of adenylyl cyclase. Each panel depicts the agonist effect (green) compared to the control response to 10µM forskolin (gray) measured in adjacent wells. Data are presented in relative luminescence units (RLU). b, Representative time courses of intracellular calcium fluorescence following stimulation of HEK293 cells transfected with the same panel of GPCRs. Each panel depicts the agonist effect (blue) compared to the control response to the calcium ionophore A23187 (lavender) measured in adjacent wells. Data are presented in relative fluorescence units (RFU).
Extended Data Figure 3. Pertussis toxin sensitivity of ERK1/2 activation by Gi/o-coupled GPCRs.
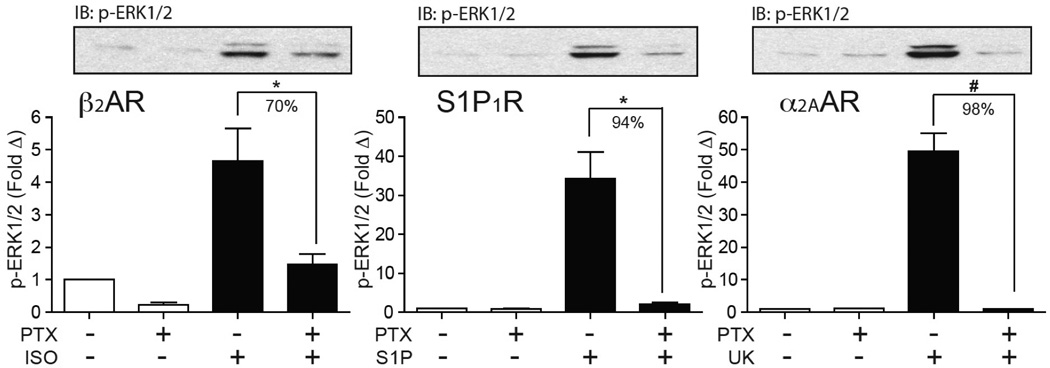
HEK293 cells transfected with the β2AR, S1PR1, or α2AAR were serum-deprived overnight the presence or absence of 1ng/mL Bordetella pertussis toxin (PTX) prior to 5min stimulation with isoproterenol, S1P, or UK14303, respectively. Representative phospho-ERK1/2 immunoblots are shown above bar graphs depicting the mean +/− s.e.m. of independent biological replicates (n=5, β2AR, S1P1R and α2AAR). Responses were normalized to the basal level of phospho-ERK1/2 in non-stimulated samples. * p<0.05, # p<0.005 less than stimulated response in the absence of pertussis toxin.
Extended Data Figure 4. Concentration-response relationship between FlAsH5 signal and arrestin-dependent ERK1/2 activation.
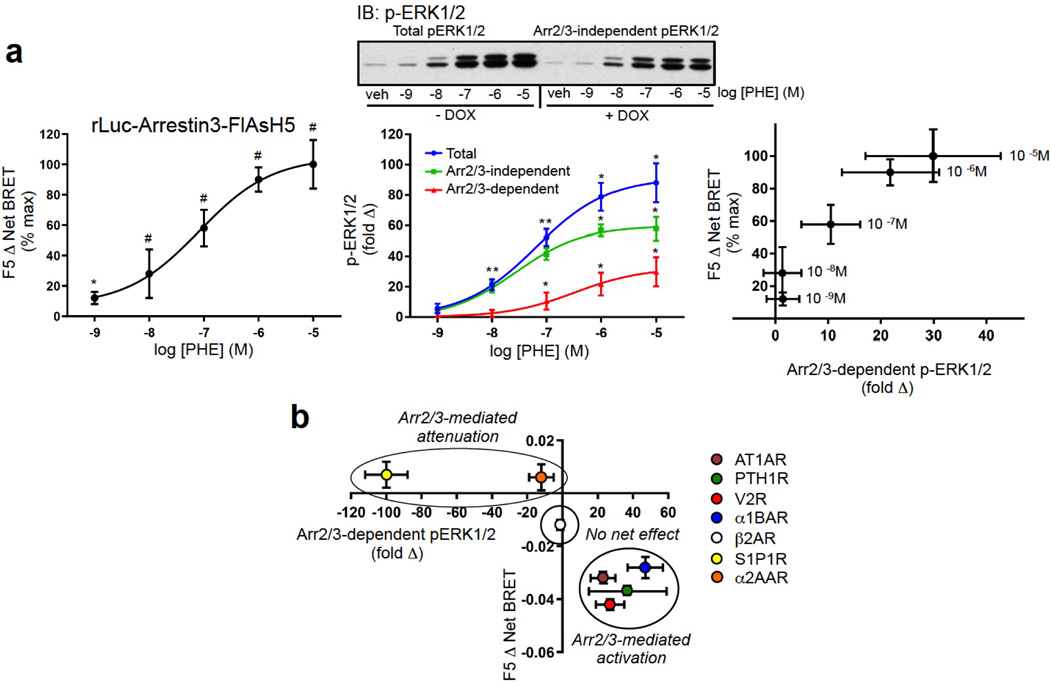
a, Relationship between α1BAR-induced change in FlAsH5 Δ Net BRET and arrestin-dependent ERK1/2 activation at varying agonist concentration. The percent maximal phenylephrine-induced FlAsH5 Δ Net BRET was determined in HEK293 cells transfected with α1BAR and rLuc-arrestin3-FlAsH5 expression plasmids (left panel). The concentration dependence of phenylephrine-stimulated ERK1/2 activation was determined in α1BAR-expressing HEK293 FRT/TO arrestin2/3 shRNA cells stimulated for 5 min (center panel). Arr2/3-dependent ERK1/2 activation was defined as the fold difference between agonist-stimulated ERK1/2 phosphorylation in the absence (total ERK1/2 signal) and presence (Arr2/3-independent ERK1/2 signal) of doxycycline. A representative phospho-ERK1/2 immunoblot is shown above a graph depicting the mean +/− s.e.m. of independent biological replicates (n=4). EC50 for total ERK1/2, Arr2/3-independent ERK1/2, and Arr2/3-dependent ERK1/2 were 64 nM, 27 nM and 334 nM, respectively. The right panel depicts the relationship between percent maximal α1BAR-induced change in FlAsH5 Δ Net BRET and Arr2/3-dependent ERK1/2 activation over a range of agonist concentrations. In all panels,* p<0.05, # p<0.005; greater than nonstimulated. b, Relationship between GPCR-induced change in FlAsH5 Δ Net BRET and arrestin-dependent ERK1/2 activation at saturating agonist concentration. The ligand-induced FlAsH5 Δ Net BRET was determined in HEK293 cells transfected with the indicated GPCR and rLuc-arrestin3-FlAsH5 expression plasmids. The graph depicts the Mean ± s.e.m. of independent biological replicates (n=5).
Extended Data Table 1.
G Protein Coupling and Trafficking Profiles of Selected GPCRs
| Receptor | G protein | Arrestin binding |
|---|---|---|
| Angiotensin AT1A | Gq/11 | Class B stable binding |
| Parathyroid Hormone PTH1 | Gs > Gq/11 | Class B stable binding |
| Vasopressin V2 | Gs | Class B stable binding |
| α1B Adrenergic | Gq/11 | Class A transient binding |
| β2 Adrenergic | Gs > Gi | Class A transient binding |
| sphingosine 1-phosphate S1P1 | Gi >Gq/11 | Class A transient binding |
| α2A adrenergic | Gi | Not detectable |
Extended Data Table 2.
Primer sequences used to generate rLuc-arrestin3-FlAsH1–6
| Primer | Sequence |
|---|---|
| RlucHindF | ATAAGCTTGCGTTACCGGATCCATGGGTGAA |
| RlucApalR | AACGGGCCCTCTAGACTAGCAGAACTGGTCA |
| FlAsH1F | GGATCCTGTCGATGGTTGTTGTCCTGGTTGTTGTGTGGTGCTTGTGGATC |
| FlAsH1R | GATCCACAAGCACCACACAACAACCAGGACAACAACCATCGACAGGATCC |
| F1AsH2F | GAGGACACAGGGAAGTGTTGTCCTGGTTGTTGTGCCTGTGGAGTAGAC |
| F1AsH2R | GTCTACTCCACAGGCACAACAACCAGGACAACACTTCCCTGTGTCCTC |
| FlAsH3F | GCTTATCATCAGAAAGTGTTGTCCTGGTTGTTGTGTACAGTTTGCTCCTG |
| FlAsH3R | CAGGAGCAAACTGTACACAACAACCAGGACAACACTTTCTGATGATAAGC |
| FlAsH4F | CCACGTCACCAACAATTGTTGTCCTGGTTGTTGTTCTGCCAAGACCGTCA |
| FlAsH4R | TGACGGTCTTGGCAGAACAACAACAACCAGGACAACAATTGGTGACGTGG |
| FlAsH5F | AGCTTGAACAAGATGACCAGTGTTGTCCTGGTTGTTGTGTGTCTCCCAGTTCCACATT |
| FlAsH5R | AATGTGGAACTGGGAGACACACAACAACCAGGACAACACTGGTCATCTTGTTCAAGCT |
| F1AsH6r | ACGGGCCCTCTAGACTAACAACAACCAGGACAACAGCAGAACTGGTCATC |
Acknowledgments
Supported by National Institutes of Health Grants DK055524 (L.M.L.) and GM095497 (L.M.L.), funds provided by Dialysis Clinics, Incorporated (T.A.M), and the Research Service of the Charleston, SC Veterans Affairs Medical Center (L.M.L.). Supported by Canadian Institutes of Health Research (CIHR) Operating Grant MOP-74603 (S. A. L.). National Institutes of Health Grant RR027777 (L.M.L.) supported the FLIPRTETRA facility. The contents of this article do not represent the views of the Department of Veterans Affairs or the United States Government.
Footnotes
SUPPLEMENTARY INFORMATION is linked to the online version of the paper at www.nature.com/nature.
AUTHOR CONTRIBUTIONS: M-H.L., K.A.M., E.G.S., J.Y.K, and S.A.L. performed experimental measurements and data analysis. T.A.M., Y.K.P., and S.A.L. provided technical expertise. M-H.L. and L.M.L. conceived the project. All authors contributed to preparation of the manuscript and approved the final version.
The authors declare no competing financial interests.
REFERENCES
- 1.Ferguson SS. Evolving concepts in G protein-coupled receptor endocytosis: the role in receptor desensitization and signaling. Pharm. Rev. 2001;53:1–24. [PubMed] [Google Scholar]
- 2.Gurevich VV, Gurevich EV. Structural determinants of arrestin functions. Prog. Mol. Biol. Transl. Sci. 2013;118:57–92. doi: 10.1016/B978-0-12-394440-5.00003-6. [DOI] [PMC free article] [PubMed] [Google Scholar]
- 3.Goodman OB, Jr, et al. Beta-arrestin acts as a clathrin adaptor in endocytosis of the beta2-adrenergic receptor. Nature. 1996;383:447–450. doi: 10.1038/383447a0. [DOI] [PubMed] [Google Scholar]
- 4.Laporte SA, et al. The beta2-adrenergic receptor/betaarrestin complex recruits the clathrin adaptor AP-2 during endocytosis. Proc. Natl. Acad. Sci. U.S.A. 1999;96:3712–3717. doi: 10.1073/pnas.96.7.3712. [DOI] [PMC free article] [PubMed] [Google Scholar]
- 5.Shenoy SK, Lefkowitz RJ. Angiotensin II-stimulated signaling through G proteins and beta-arrestin. Sci. STKE. 2005;2005(308):cm10. doi: 10.1126/stke.3112005cm14. [DOI] [PubMed] [Google Scholar]
- 6.Luttrell LM, Gesty-Palmer D. Beyond desensitization: physiological relevance of arrestin-dependent signaling. Pharm. Rev. 2010;62:305–330. doi: 10.1124/pr.109.002436. [DOI] [PMC free article] [PubMed] [Google Scholar]
- 7.Hoffmann C, et al. A FlAsH-based FRET approach to determine G protein-coupled receptor activation in living cells. Nat. Methods. 2005;2:171–176. doi: 10.1038/nmeth742. [DOI] [PubMed] [Google Scholar]
- 8.Kenakin TP. Functional selectivity through protean and biased agonism: who steers the ship? Mol. Pharmacol. 2007;72:1393–1401. doi: 10.1124/mol.107.040352. [DOI] [PubMed] [Google Scholar]
- 9.Luttrell LM. Minireview: More than just a hammer: ligand "bias" and pharmaceutical discovery. Mol. Endocrinol. 2014;2014:me20131314. doi: 10.1210/me.2013-1314. [DOI] [PMC free article] [PubMed] [Google Scholar]
- 10.Han M, et al. Crystal structure of beta-arrestin at 1.9 A: possible mechanism of receptor binding and membrane translocation. Structure. 2001;9:869–880. doi: 10.1016/s0969-2126(01)00644-x. [DOI] [PubMed] [Google Scholar]
- 11.Zhan X, et al. Crystal structure of arrestin-3 reveals the basis of the difference in receptor binding between two non-visual subtypes. J. Mol. Biol. 2011;406:467–478. doi: 10.1016/j.jmb.2010.12.034. [DOI] [PMC free article] [PubMed] [Google Scholar]
- 12.Shukla AK, et al. Structure of active β-arrestin-1 bound to a G-protein-coupled receptor phosphopeptide. Nature. 2013;497:137–141. doi: 10.1038/nature12120. [DOI] [PMC free article] [PubMed] [Google Scholar]
- 13.Kim YJ, et al. Crystal structure of pre-activated arrestin p44. Nature. 2013;497:142–146. doi: 10.1038/nature12133. [DOI] [PubMed] [Google Scholar]
- 14.Kang Y, et al. Crystal structure of rhodopsin bound to arrestin by femtosecond X-ray laser. Nature. 2015;523:561–567. doi: 10.1038/nature14656. [DOI] [PMC free article] [PubMed] [Google Scholar]
- 15.Charest PG, Terrillon S, Bouvier M. Monitoring agonist-promoted conformational changes of beta-arrestin in living cells by intramolecular BRET. EMBO Rep. 2005;6:334–340. doi: 10.1038/sj.embor.7400373. [DOI] [PMC free article] [PubMed] [Google Scholar]
- 16.Shukla AK, et al. Distinct conformational changes in beta-arrestin report biased agonism at seven-transmembrane receptors. Proc. Natl. Acad. Sci. U.S.A. 2008;105:9988–9993. doi: 10.1073/pnas.0804246105. [DOI] [PMC free article] [PubMed] [Google Scholar]
- 17.Oakley RH, Laporte SA, Holt JA, Caron MG, Barak LS. Differential affinities of visual arrestin, beta arrestin1, and beta arrestin2 for G protein-coupled receptors delineate two major classes of receptors. J. Biol. Chem. 2000;275:17201–17210. doi: 10.1074/jbc.M910348199. [DOI] [PubMed] [Google Scholar]
- 18.Appleton KM, et al. Biasing the parathyroid hormone receptor: relating in vitro ligand efficacy to in vivo biological activity. Meth. Enzymol. 2013;522:229–262. doi: 10.1016/B978-0-12-407865-9.00013-3. [DOI] [PubMed] [Google Scholar]
- 19.Barak LS, Ferguson SS, Zhang J, Caron MG. A beta-arrestin/green fluorescent protein biosensor for detecting G protein-coupled receptor activation. J. Biol. Chem. 1997;272:27497–27500. doi: 10.1074/jbc.272.44.27497. [DOI] [PubMed] [Google Scholar]
- 20.Wu G, Krupnick JG, Benovic JL, Lanier SM. Interaction of arrestins with intracellular domains of muscarinic and alpha2-adrenergic receptors. J. Biol. Chem. 1997;272:17836–17842. doi: 10.1074/jbc.272.28.17836. [DOI] [PubMed] [Google Scholar]
- 21.DeFea KA, et al. beta-Arrestin-dependent endocytosis of proteinase-activated receptor 2 is required for intracellular targeting of activated ERK1/2. J. Cell Biol. 2000;148:1267–1281. doi: 10.1083/jcb.148.6.1267. [DOI] [PMC free article] [PubMed] [Google Scholar]
- 22.Luttrell LM, et al. Activation and targeting of extracellular signal-regulated kinases by beta-arrestin scaffolds. Proc. Natl. Acad. Sci. U.S.A. 2001;98:2449–2454. doi: 10.1073/pnas.041604898. [DOI] [PMC free article] [PubMed] [Google Scholar]
- 23.Zimmerman B, Simaan M, Lee M-H, Luttrell LM, Laporte SA. c-Src-mediated phosphorylation of AP-2 reveals a general mechanism for receptors internalizing through the clathrin pathway. Cell Signal. 2009;21:103–110. doi: 10.1016/j.cellsig.2008.09.013. [DOI] [PubMed] [Google Scholar]
- 24.Wei H, et al. Independent beta-arrestin 2 and G protein-mediated pathways for angiotensin II activation of extracellular signal-regulated kinases 1 and 2. Proc. Natl. Acad. Sci. U.S.A. 2003;100:10782–10787. doi: 10.1073/pnas.1834556100. [DOI] [PMC free article] [PubMed] [Google Scholar]
- 25.Shenoy SK, et al. beta-Arrestin-dependent, G protein-independent ERK1/2 activation by the beta2 adrenergic receptor. J. Biol. Chem. 2006;281:1261–1273. doi: 10.1074/jbc.M506576200. [DOI] [PubMed] [Google Scholar]
- 26.Oakley RH, Laporte SA, Holt JA, Barak LS, Caron MG. Association of beta-arrestin with G protein-coupled receptors during clathrin-mediated endocytosis dictates the profile of receptor resensitization. J. Biol. Chem. 1999;274:32248–32257. doi: 10.1074/jbc.274.45.32248. [DOI] [PubMed] [Google Scholar]
- 27.Zimmerman B, et al. Differential β-arrestin-dependent conformational signaling and cellular responses revealed by angiotensin analogs. Sci. Signal. 2012;5:ra33. doi: 10.1126/scisignal.2002522. [DOI] [PubMed] [Google Scholar]
- 28.Tobin AB, Butcher AJ, Kong KC. Location, location, location…site-specific GPCR phosphorylation offers a mechanism for cell-type-specific signalling. Trends Pharmacol. Sci. 2008;29:413–420. doi: 10.1016/j.tips.2008.05.006. [DOI] [PMC free article] [PubMed] [Google Scholar]
- 29.Kommaddi RP, Shenoy SK. Arrestins and protein ubiquitination. Prog. Mol. Biol. Transl. Sci. 2013;118:175–204. doi: 10.1016/B978-0-12-394440-5.00007-3. [DOI] [PubMed] [Google Scholar]
- 30.Nuber S, et al. FRET-based β-arrestin biosensors reveal a rapid, receptor-dependent activation/deactivation cycle in living cells. Nature. 2016 doi: 10.1038/nature17198. In press. [DOI] [PMC free article] [PubMed] [Google Scholar]
References
- 31.Yon J, Fried M. Precise gene fusion by PCR. Nucleic Acids Res. 1989;17:4895. doi: 10.1093/nar/17.12.4895. [DOI] [PMC free article] [PubMed] [Google Scholar]
- 32.Binkowski BF, Fan F, Wood KV. Luminescent biosensors for real-time monitoring of intracellular cAMP. Meth. Mol. Biol. 2011;756:263–271. doi: 10.1007/978-1-61779-160-4_14. [DOI] [PubMed] [Google Scholar]
- 33.Leonard AP, Appleton KM, Luttrell LM, Peterson YK. A high-content, live-cell, and real-time approach to the quantitation of ligand-induced β-Arrestin2 and Class A/Class B GPCR mobilization. Microsc Microanal. 2013;19:150–170. doi: 10.1017/S1431927612014067. [DOI] [PMC free article] [PubMed] [Google Scholar]
- 34.Wilson PC, et al. The arrestin-selective angiotensin AT1 receptor agonist [Sar1,Ile4,Ile8]-AngII negatively regulates bradykinin B2 receptor signaling via AT1-B2 receptor heterodimers. J Biol Chem. 2013;288:18872–18884. doi: 10.1074/jbc.M113.472381. [DOI] [PMC free article] [PubMed] [Google Scholar]


