

Abstract
Obesity increases the risk for postmenopausal breast cancer. We have modeled this metabolic context using female Wistar rats that differ in their polygenic predisposition for obesity under conditions of high-fat feeding and limited physical activity. At 52 days of age, rats were injected with 1-methyl-1-nitrosourea (MNU, 50 mg/kg) and placed in an obesogenic environment. At 19 weeks of age, the rats were separated into lean, mid-weight, and obese rats, based upon their weight gained during this time. The rats were ovariectomized (OVX) at ~24 weeks of age and the change in tumor multiplicity and burden, weight gain, energy intake, tumor estrogen receptor (ER) status, and humoral metabolite and cytokine profiles were examined. The survival and growth of tumors increased in obese rats in response to OVX. OVX induced a high rate of weight gain during post-OVX weeks 1–3, compared to SHAM-operated controls. During this time, feed efficiency (mg gain/kcal intake) was lower in obese rats, and this reduced storage efficiency of ingested fuels predicted the OVX-induced changes in tumor multiplicity (r = −0.64, P < 0.001) and burden (r = −0.57, P < 0.001). Tumors from obese rats contained more cells that expressed ERα, and post-OVX plasma from rats with the lowest feed efficiency had lower interleukin (IL)-2 and IL-4 levels. Our observations suggest a novel link between obesity and mammary tumor promotion that involves impaired fuel metabolism during OVX-induced weight gain. The metabolically inflexible state of obesity and its inability to appropriately respond to the OVX-induced energy imbalance provides a plausible explanation for this relationship and the emergence of obesity’s impact on breast cancer risk after menopause.
INTRODUCTION
Obesity increases the risk for breast cancer in postmenopausal women (1,2). A 10 kg/m2 increase in BMI translates into a 40% increase in risk and a 36% increase in mortality associated with postmenopausal breast cancer (3). The magnitude of this problem is highlighted by the fact that in the United States, it has been estimated that 22.6% of cases of postmenopausal breast cancer can be attributed to being overweight or obese (4).
The reason for the emergence of an obesity effect after menopause has been the subject of much research and debate. The fundamental paradox can be appreciated with the best anthropometric predictor: total adult weight gain. Adult weight gain predicts postmenopausal, but not premenopausal, breast cancer incidence (5–10). Moreover, the majority of studies suggest that total adult weight gain, rather than weight gain occurring after menopause is the stronger predictor. Even so, postmenopausal weight gain appears to be necessary, as calorie restricted weight loss and/or maintenance eliminates the obesity-related risk (7,11). One interpretation of this epidemiological evidence is that excess adult weight gain creates a physiological context that is primed to promote mammary tumors, but one that remains quiescent until menopause. Cumulatively, existing data indicate that the transition through menopause activates this physiological context, and the tumor-promoting effects of obesity emerge. Not all researchers embrace this simplified working model of the relationship between obesity and breast cancer (12), but doing so allows us to frame two critical questions: what aspect(s) of obesity are critical for the “primed environment” and what changes occur with menopause that “trigger” its impact on tumor progression?
In order to understand the emergence of obesity-related tumor promotion after menopause, the quiescent premenopausal context and the menopausal transition must be carefully modeled. The purpose of this study was to develop a physiologically relevant paradigm that models key aspects of this complex human condition, in order to study the link between the primed environment and the menopausal trigger. We merged a well-established model of polygenic obesity, an approach to induce a broad range of mammary tumors that generally reflect human breast cancer, and a surgical intervention (ovariectomy, ovariectomized (OVX)) in mature adults to initiate a distinct transition to an estrogen-deprived state that shares some characteristics with menopause. Our hypothesis was that a strong tumor-promoting effect of obesity would emerge only after the OVX surgery, reflecting the relationship between obesity and breast cancer risk observed after menopause in women. We based this hypothesis on the idea that the loss of ovarian function would provide some “trigger” that would differentially affect tumor progression, based upon preexisting adiposity.
Consistent with this hypothesis, obesity facilitated the survival and growth of mammary tumors after OVX, and this affect was inversely associated with the energetic storage efficiency of ingested fuels after the surgery. These observations suggest a novel explanation in which impaired regulation of fuel utilization (the “primed” environment), in response to the OVX-induced positive energy imbalance (the “trigger”), facilitates the survival and growth of mammary tumors. This experimental paradigm, which we have termed the OR-OP/OVX model, is likely to provide a valuable tool to pursue a better understanding of the relationship between obesity, the regulation of fuel metabolism, and breast cancer, and, potentially, be used to develop more effective prevention and treatment strategies.
METHODS AND PROCEDURES
Animal care and treatment
Female Wistar rats (100–125 g) were purchased from Charles River Laboratories (Wilmington, MA) and were individually housed (22–24 °C; 12:12-h light-dark cycle) with free access to water. Rats were fed a high-fat purified diet (46% kcal fat; Research Diets, New Brunswick, NJ; RD#12344) in metabolic caging designed for intake monitoring and minimizing physical activity. Body weight and food intake were monitored as previously described (13), every 2 weeks before the surgical intervention and twice weekly thereafter. All procedures were approved by the Institutional Animal Care and Use Committee.
Mammary tumor induction
A single injection of 1-methyl-1-nitrosourea (MNU, 50 mg/kg) at 52 ± 1 days of age induces mammary tumors similar to human tumors in the percentage of tumors that are intraductal, the progression of histologic stages from hyperplasia to in situ to invasive, and steroid receptor positivity (14,15). In addition, this approach induces a tumor profile with a similar heterogeneity in histology (including glandular, cribri-form, papillary, and high-grade patterns with comedo necrosis), and hormonal risk factors known to be important for human breast cancers (16). Rats were palpated twice per week for the study’s duration. MNU was provided by the National Cancer Institute’s Chemical Carcinogen Reference Standards Repository operated under contract by Midwest Research Institute, Kansas City, MO. N02-CB-07008.
Modeling obesity and menopause
Rats gained weight according to their polygenic/epigenetic disposition for obesity under the obesigenic conditions of a high-fat diet and limited physical activity. Rats were separated into lean (n = 12), overweight (n = 12), and obese (n = 12) groups, according to tertiles of total weight gain from the MNU injection (up to 19 weeks of age). Growth curves for these groups are shown in Figure 1a. The tapering of body weight gain around this time coincides with the decline in lean body mass accumulation in our previous studies with this model (17), so we interpret this to indicate that animals are fully mature. These environmental conditions were maintained for approximately five more weeks, after which the animals were surgically OVX. In addition to the 36 OVX rats, 9 additional animals (4 lean, 2 mid-weight, and 3 obese) received a SHAM surgical operation. Body composition was determined before euthanasia by dual-energy X-ray absorptiometry with a Lunar DPX-IQ (Lunarcorp, Madison, WI) as previously described (13,17). The tissue composition analysis of several tumors was assessed with a Piximus II dual-energy X-ray absorptiometry (Lunarcorp) and found to be consistently 90% fat-free mass and 10% fat mass. Body composition data and weight gain data were corrected for the contribution of tumor burden by subtracting the tumor burden contribution to each compartment. In general, the change in burden represented a very small portion of post-OVX weight gain (<5%) and of total body mass. For this reason, this adjustment did not impact the analyses of weight gain energetics.
Figure 1.
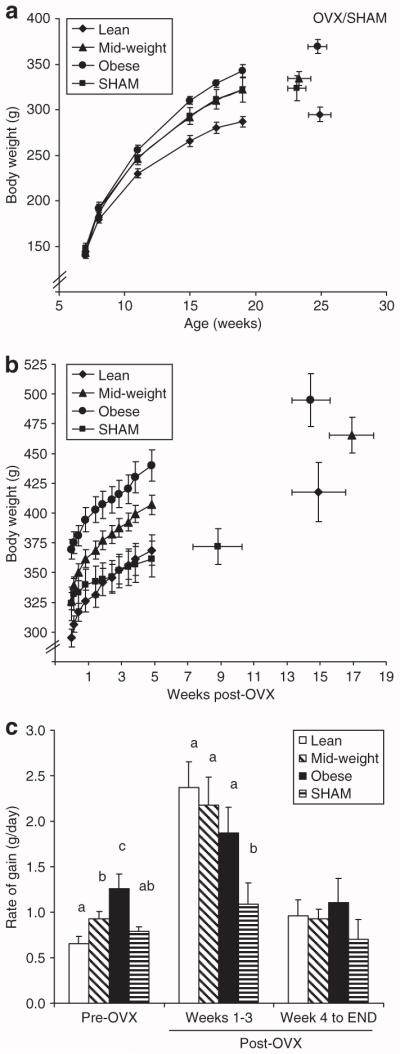
Weight gain before and after OVX. (a) Body weights are shown for lean, mid-weight, obese, and SHAM groups (n = 12/group) up to the surgical intervention. (b) Post-surgical body weight was measured every few days for the first 6 weeks, and then weekly thereafter. (c) The rate of weight gain during the 2 weeks before the surgery (pre-OVX), first 3 weeks after the surgical intervention (post-OVX weeks 1–3), and after post-OVX week 4 (week 4 to END) is shown for the four groups. Groups with the same letter designation are not significantly different. OVX, ovariectomized.
Post-OVX monitoring
Food intake, body weight, tumor multiplicity (number of tumors), and burden (total tumor mass) were monitored twice weekly for the study’s duration. Animals were monitored for up to 25 weeks after OVX, unless tumor burden or illness required euthanasia. To ensure that the groups experienced a similar post-OVX time and had the same average age, matched animals from other groups were euthanized as well. Rats were euthanized by CO2-asphyxiation followed by cervical dislocation, and tumors were excised, weighed, and processed for histological evaluation. Mammary tumors were classified histologically by the criteria of Young and Hallowes (18) and only adenocarcinomas were included in subsequent analyses.
Tissue analysis
Cytokine profiling
Blood was collected from the tail vein before OVX and again 5 weeks after the OVX surgery, during the latter part of the light cycle and after food had been removed for 3 h. Plasma was isolated and stored at −80 °C until analyzed. Estradiol (17β-estradiol) was measured in the plasma by enzyme-linked immunosorbent assay (Cayman Chemical, Ann Arbor, MI). Concentrations of insulin, leptin, amylin, and glucagon were simultaneously measured in plasma samples using the Rat Endocrine LINCOplex Kit 96 Well Plate Assay (RENDO-85K; Linco Research/Millipore, St Charles, MO). Measurements of plasma cytokine profiles were made in a similar manner using the Rat Cytokine/Chemokine LINCOplex Kit 96 Well Plate Assay (RCYTO-80K; Linco Research/Millipore).
Immunohistochemistry for estrogen receptor (ER) status
Formalin-fixed, paraffin-embedded mammary tissue sections (5 μm, 2/tumor, 8–10 fields/section) adjacent to the lymph node chain in gland #5 were evaluated (40× objective) for the immunohistochemical detection of ERα+ cells (mouse monoclonal, clone 6F11 at 1:100; Vector Laboratories, Burlingame, CA). Antigen retrieval was performed in 10 mmol/l citrate buffer, at 120 °C for 5 min at 20 psi. Primary antibody signal was detected using biotin-labeled rabbit anti-mouse secondary antibody according to manufacturer’s recommendations. Sections were counterstained with Harris hematoxylin. Cells were considered negative (unstained) or positive (stained) for the determination of ER status. ER status was distinguished into four categories; <5% positive cells as +0, 5–25% positive cells as +1, 25–75% positive cells as +2, and >75% positive cells as +3.
Statistical analysis
Data were examined with SPSS 16.0 software (SPSS, Chicago, IL) by ANOVA or χ2 analysis, for nominal and ordinal data, respectively. Relationships between variables were assessed with the Spearman correlation coefficient. In some cases, data were analyzed by analysis of covariance with a specified covariate in the model. Differences and relationships were considered statistically significant when P < 0.05.
RESULTS
Weight gain before and after OVX
Body weights from the time of the MNU injection to the surgical intervention show how the three groups were separated according to tertiles of weight gain during the pre-OVX period (Figure 1a). The SHAM group had an average weight before the surgery that was similar to the mid-weight rats. Body weights after the surgical intervention demonstrate that total amount of weight gained during the post-OVX period was similar for lean (125 ± 25 g), mid-weight (133 ± 17 g), and obese (130 ± 15g) rats, and that this OVX-induced weight gain was greater than that observed in SHAM rats (46 ± 12 g) (Figure 1b). OVX induced a transient period of elevated weight gain in all three groups, which persisted for 3 weeks following the surgery (Figure 1c). Thereafter, the rate of weight gain returned to levels observed in the SHAM rats.
Tumor multiplicity and burden
At the time of surgery, no statistical differences between groups in tumor incidence, or number of tumors per rat (multiplicity) were detected (Figure 2a), although mid-weight rats tended to have fewer tumors (Figure 2a, Table 1). Average burden was also similar for the three groups (Table 1). In response to OVX, multiplicity significantly increased in the obese and SHAM rats (Figure 2a), and this was reflected in the change in the number of tumors that continued to grow (Figure 2b). When compared to lean rats, obese rats experienced half as many tumors that permanently regressed (21 in lean; 10 in mid-weight; 11 in obese) and over two and a half times as many new tumors that emerged after OVX (10 in lean; 15 in mid-weight; 27 in obese). Moreover, tumor burden increased in a greater proportion of obese and SHAM rats than in lean rats, and this differential shift in tumor growth occurred early in the post-OVX period (Figure 2c). Finally, the SHAM rats exhibited the most aggressive tumor progression of all the rats, which necessitated their early removal from the study (Figure 1b). These studies indicate that after OVX, obesity developed before the surgery was associated with enhanced tumor progression and a higher incidence of new tumor development when compared to lean OVX rats.
Figure 2.

Change in tumor multiplicity and burden in response to OVX. (a) Tumor number is shown at the time of the surgery and at the end of the study (*different from multiplicity at OVX). (b) Change in the number of progressing tumors, normalized to post-OVX time is shown. Groups with the same letter designation are not significantly different. (c) The percentage of animals in each group exhibiting an increase in tumor burden is shown. Time points marked with an asterisk indicate a significant difference between lean and obese groups. OVX, ovariectomized.
Table 1.
Pre-OVX tumor and humoral characteristics
| Lean | Mid-weight | Obese | |
|---|---|---|---|
| Total tumors | 25 | 17 | 27 |
| Average burden (g) | 1.8 ± 1.4 | 3.6 ± 1.2 | 3.7 ± 1.5 |
| Insulin (pmol/l) | 101 ± 10 | 140 ± 23 | 121 ± 18 |
| Glucagon (pmol/l) | 19 ± 6a | 20 ± 9a | 65 ± 17b |
| Leptin (pmol/l) | 364 ± 73a | 407 ± 101ab | 717 ± 134b |
| Amylin (pmol/l) | 6.66 ± 0.44 | 6.85 ± 0.52 | 7.86 ± 0.33 |
| Insulin/glucagon | 9.6 ± 2.4a | 15.6 ± 6.5a | 2.9 ± 0.8b |
| Glucose (mmol/l) | 10.7 ± 0.4a | nd | 12.0 ± 0.6b |
| NEFA (μmol/l) | 594 ± 51 | nd | 704 ± 62 |
| Triglycerides (mg/dl) | 101 ± 14a | nd | 165 ± 39b |
| Cholesterol (mg/dl) | 97 ± 5 | nd | 102 ± 6 |
Tumor number of tumors in each group and average burden (total tumor mass/ rat) at the time of the surgical intervention are shown for the entire cohort of rats (n = 12/group). Blood was collected from representative animals in each group (n = 8–10/group) for humoral profiling. Groups with the same letter designation are not significantly different (P < 0.05).
nd, not determined; NEFA, nonesterified free fatty acid.
Energetics of weight gain before and after OVX
Energy intake and feed efficiency, defined as mg body weight gained per kcal intake, before and after the surgical intervention are shown in Figures 3a,b. During the first 3 weeks after the surgery, energy intake increased in the lean and mid-weight rats, but not in the obese or SHAM rats (P < 0.05). Thereafter, intake normalized to pre-OVX levels. Feed efficiency during this 3-week period of time was increased in all OVX groups, but obesity attenuated this elevation (P < 0.05). In OVX rats, feed efficiency during this period of time correlated with the change in tumor multiplicity (r = −0.64, P < 0.001) (Figure 3c) and burden (r = −0.57, P < 0.001) that occurred over the entire post-OVX period. That is, obese rats were less efficient at storing a similar amount of ingested energy, and thus tended to gain less weight during this period of time, while experiencing enhanced tumor promotion. Dual-energy X-ray absorptiometry-determined body composition analyses in representative animals from each group indicated that essentially all of the OVX-induced weight gain was fat mass (Table 2).
Figure 3.

Intake and feed efficiency before and after surgery. (a) Daily energy intake during the three stages of the study are presented. The asterisk in lean and overweight rats indicates a significant increase in food intake during weeks 1–3 post-OVX. (b) Feed efficiency (weight gain/energy intake) during the three phases of the study is shown. At each time point, groups with the same letter designation are not significantly different. (c) The post-OVX change in tumor number is plotted against the feed efficiency during weeks 1–3 post-OVX, and the Spearman correlation coefficient for the entire cohort is shown. OVX, ovariectomized.
Table 2.
Body composition at study’s end
| Lean | Mid-weight | Obese | SHAM | |
|---|---|---|---|---|
| Age (days) | 267 ± 16 | 266 ± 17 | 267 ± 15 | 227 ± 10 |
| Postsurgery (days) | 94 ± 16 | 105 ± 13 | 95 ± 12 | 66 ± 8 |
| Body weight (g) | 393 ± 29ab | 438 ± 16b | 505 ± 30c | 364 ± 14a |
| Fat-free mass (g) | 294 ± 19 | 301 ± 6 | 291 ± 20 | 298 ± 18 |
| Fat mass (g) | 99 ± 20ab | 137 ± 16b | 213 ± 39c | 67 ± 10a |
| % Body fat | 24.3 ± 4.0a | 30.1.3 ± 2.6b | 40.9 ± 6.1b | 18.4 ± 3.0a |
| Mesenteric fat (g) | 12.2 ± 3.1ab | 11.6 ± 1.4a | 18.0 ± 2.9b | 8.3 ± 0.9a |
| Retroperitoneal fat (g) | 13.8 ± 2.0a | 17.6 ± 2.4ab | 23.0 ± 2.2b | 13.1 ± 1.7a |
| Bone (g) | 5.42 ± 0.31a | 6.01 ± 0.55ab | 5.44 ± 0.47a | 6.70 ± 0.43b |
| Bone density (g/cm3) | 0.283 ± 0.003 | 0.297 ± 0.009 | 0.293 ± 0.003 | 0.289 ± 0.003 |
Body composition and fat pad weight was assessed in ovariectomized (OVX) and SHAM rats by dual-energy X-ray absorptiometry at ~80 days post-OVX (n = 6–8/group). Groups with the same letter designation are not significantly different.
ER status of post-OVX progressing tumors
OVX resulted in a dramatic decline in circulating estrogen levels, which was one factor that confirmed the elimination of ovarian estrogen production (Figure 4a). Consistent with the elimination of ovarian estrogen production, OVX rats gained more body fat, particularly in the abdominal fat pads (Table 2). In addition, SHAM rats had a higher total bone content than OVX rats (6.7 ± 0.4 vs. 5.7 ± 0.15, P < 0.05). To assess whether the tumor-promoting effects of obesity were associated with ER expression, 51 progressing tumors were randomly selected for the determination of ERα receptor expression by immunohistochemistry. The majority (80%) of these tumors were found to have a significant number of cells (>5% of cells) expressing the ERα receptor. When tumors were segregated into low- and high-ERα expressors, (< or >25% cells, respectively), the nonobese rats (lean and mid-weight) had fewer tumors with >25% ERα+ cells (Figure 4b).
Figure 4.

Post-OVX hormones, cytokines, and metabolites, and tumor ERα expression. (a) Estrogen levels measured at the time of surgery and 6 weeks after the surgery are presented. OVX minimized circulating estrogens levels in all three groups (P < 0.001). (b) Fifty-one randomly selected tumors were characterized for ERα expression. SHAM and OVX obese rats had a higher proportion of tumors in which >25% of the cells expressed ERα, when compared to nonobese (lean + mid-weight) rats (P < 0.05). (c–d) Humoral cytokine and metabolite profiles are expressed as the % difference from the SHAM, comparing (c) nonobese (lean and mid-weight rats) and obese rats and (d) rats with high-feed efficiency (>27 mg/kcal) and those with low-feed efficiency (<22 mg/kcal). * Significant difference between SHAM and all OVX animals, P < 0.05. †Difference between (c) nonobese vs. obese or (d) high-vs. low-feed efficiency; P < 0.05. ERα, estrogen receptor α; GRO/KC, growth related oncogene chemokine; IFN-γ, interferon-γ; IL, interleukin; MCP-1, monocyte chemoattractant protein 1; NEFAs, nonesterified free fatty acids; OVX, ovariectomized; TG, triglyceride.
Humoral profiles
Endocrine factors, cytokines, and metabolites were measured on a subset of animals (n = ~8/group). Before OVX, obesity was associated with higher levels of glucose, triglycerides, leptin, glucagon, and amylin (Table 1). No differences were observed between any of the other cytokines that were assessed (data not shown). The same assessments were measured 6 weeks after the surgical intervention (Figure 4c). OVX induced an increase in insulin, glucagon, and leptin, changes that were closely associated with the amount of post-OVX weight gain (data not shown). Obesity was associated with higher glucagon, triglycerides, and free fatty acids, when compared to non-obese rats. When OVX rats were classified according to their feed efficiency during post-OVX weeks 1–3, rats with the lowest feed efficiency (high-tumor promotion) exhibited lower insulin, leptin, interleukin (IL)-2, and IL-4, and had higher triglycerides and free fatty acids, when compared to rats with the highest feed efficiency (Figure 4d).
DISCUSSION
Several metabolic characteristics of obesity have been tied to tumor promotion, including insulin resistance, dyslipidemia, poor glucose control, and changes in a number of hormones and cytokines (5,7,12,19,20). Based upon this evidence, one might expect that obesity would always enhance tumor progression, regardless of menopause. Supporting this notion, several preclinical studies have shown obesity-related tumor promotion under premenopause-like conditions (21–26). Other models are more reflective of the human condition, showing no effect (27–30) or that obesity may even impart some protection (31,32). The wide range of responses in animal models and the complex nature of obesity and its interaction with mammary tumors have made it difficult to identify the key factors that contribute to the lack of effect before menopause and the emergence of an obesity effect after menopause. Merging well-established models of obesity, breast cancer, and a menopause-like state, we have recapitulated the human condition with respect to: (i) a minimal effect of obesity before menopause; (ii) the emergence of an adverse effect of obesity shortly after menopause; and (iii) the relationship between total adult weight gain and postmenopausal breast cancer risk. The novel observation from this model is that obesity reduces the storage efficiency of ingested nutrients during the OVX-induced positive energy imbalance and that this reduced storage efficiency predicts the changes in tumor multiplicity and burden. This study is among the first to link the energetics of OVX-induced weight gain to tumor progression, and, as such, may contribute to our understanding of the primed environment of obesity and the menopausal trigger that coordinately enhance mammary tumor survival and growth.
Our observations suggest that the manner in which excess fuels are metabolized and stored during the 3-week period of rapid weight gain may influence tumor promotion, more so than the total amount of weight gained after OVX. A reasonable explanation for obesity’s effects on OVX-induced weight gain energetics comes from two critical effects of obesity on energy homeostasis. First, obese rats exhibit a pre-existing state of central resistance to insulin and leptin (33,34), and the impact of removing estrogen, which also induces hypothalamic resistance to these hormones (35,36), would likely be blunted. The observation that intake did not increase in the obese rats in response to OVX is consistent with this assertion, but it is also necessitates, based on the fact that they did gain weight, that these animals experienced a reduced level of energy expenditure. What is important to note about the influence of obesity on the adjustment in energy homeostasis is that OVX induced the same total amount of weight gain and fat mass in lean and obese rats, but that this weight gain tended to be delayed in the obese rats.
The second aspect of energy homeostasis that could contribute to the reduced storage efficiency is the pre-existing insulin resistance in the periphery and a state of metabolic inflexibility. Metabolic inflexibility is manifested by the inability to regulate fuel metabolism in response to a number of metabolic challenges, like fasting, exercise, or an insulin infusion (37). We have observed that obese animals derived from obesity-prone outbred strains are insulin resistant and exhibit this same impairment in the response to the metabolic challenge of overfeeding (13,38,39). The normal response to an excess of calories is a shift in fuel preference favoring the oxidization of ingested carbohydrates for energy needs and the trafficking of ingested fat to lipid storage depots (40). Relatively speaking, this shift in fuel metabolism is a rapid, energetically efficient way to clear and store excess energy. In contrast, the lack of this response in obese rats is accompanied by the accumulation of these excess nutrients in the blood, liver, and muscle. If this characteristic of metabolic inflexibility persists during the OVX-induced positive energy imbalance, it could contribute to less efficient storage of ingested fuels and, potentially, a delay in the process of gaining weight.
The more pertinent and speculative question then becomes whether these changes in weight gain energetics impart some influence on the fate of mammary tumors. The observation that the period of rapid weight gain preceded, or at least coincided with, the temporal responses in tumor burden would suggest it may be. Several hormones, metabolites, and cytokines commonly elevated in obese patients are reported to be tumorigenic (5,7,19), but the conundrum of why these abnormalities impart risk only after menopause has been difficult to address. Based upon our observations, it would be relevant to examine how these humoral factors change during this 3-week period of rapid weight gain. Postprandial excursions in insulin, leptin, glucose, triglycerides, and other factors are commonly observed in obese, insulin resistant individuals, and the persistent, large positive energy imbalance may be accompanied by an exacerbated elevation in one or more of these factors, with unfavorable consequences on tumor growth and survival. Our measurements, made outside this window, could have missed these critical changes. Whereas the lower IL-2 after OVX in rats with low-feed efficiency could plausibly contribute to enhanced tumor progression in these animals (41), we believe that it will be more informative to profile the metabolites, endocrine factors, and cytokines when aspects of metabolism predict long-term tumor growth and survival.
Whereas this link to impaired metabolism is novel and intriguing, the potential contribution of other putative effects of obesity should not be overlooked in this model. OVX is known to cause tumor regression in most animal models (30,42–44), and this regression has been associated with ovarian–hormone dependency of the tumors (43). Consistent with previous reports in obese models (23,30,45,46), obesity in the OR-OP/OVX model attenuated OVX-induced regression and was accompanied by tumors with a greater number of ERα+ cells. ER+ tumors in postmenopausal women are relatively common, particularly in those who have gained more weight (6,9,47,48). The prevailing thought on the persistence of ER+ tumors with greater adiposity is that adipose tissue, with its own intrinsic aromatase activity, could elevate localized levels of estrogen in the mammary gland (49). Over time, extragonadal aromatase activity has been shown to lead to partial recovery of circulating estradiol levels in the OVX rat (50). Consistent with that study, circulating estradiol levels in the present study did not show signs of recovery at 6-weeks post-OVX, but it is possible that local levels in specific tissues may have been altered (50). Our ongoing studies will pursue a better understanding of whether obesity enhances extragonadal aromatase activity and local estradiol levels within the mammary gland.
In summary, our initial characterization of the OR-OP/OVX paradigm revealed some surprising aspects of post-OVX weight gain and its relationship to tumor promotion. Obesity reduced the energetic efficiency of weight gain during a transient period of time shortly after OVX, and this difference in weight gain energetics was predictive of mammary tumor promotion. Our observations provide the basis for a novel hypothesis linking obesity and energy balance to breast cancer after menopause. This hypothesis asserts the primed environment of obesity (e.g., leptin and insulin resistance, metabolic inflexibility) imparts no risk on its own, but sets the stage for sustained tumor survival and growth when challenged with the menopausal trigger (positive energy imbalance). From this perspective the reduced energetic efficiency of weight gain and enhanced tumor promotion are concomitant consequences of an impaired metabolic response to the caloric excess during OVX-induced weight gain. Even so, this association may be coincidental to other effects of obesity, such as the promotion of ERα+ tumors via extragonadal estradiol production. The OR-OP/OVX paradigm should provide a physiologically relevant context to pursue a better understanding of the significance of this surprising relationship, and other putative mediators of obesity’s effects, and may ultimately help us to understand the complex relationship between obesity and postmenopausal breast cancer.
ACKNOWLEDGMENTS
We appreciate Dr Anderson for his review and editing of the manuscript. This work was supported by the University of Colorado Cancer Center and the American Cancer Society (IRC/UCCC Seed Grant to P.S.M.) and the National Institutes of Health (DK67403 and DK38088 to P.S.M.). We also gratefully acknowledge the support of the National Institutes of Health via the Colorado Clinical Nutrition Research Unit (DK48520) and the Susan G. Komen Foundation (KG081323).
Footnotes
DISCLOSURE
The authors declared no conflict of interest.
REFERENCES
- 1.Osler M. Obesity and cancer. A review of epidemiological studies on the relationship of obesity to cancer of the colon, rectum, prostate, breast, ovaries, and endometrium. Dan Med Bull. 1987;34:267–274. [PubMed] [Google Scholar]
- 2.Barnett JB. The relationship between obesity and breast cancer risk and mortality. Nutr Rev. 2003;61:73–76. doi: 10.1301/nr.2003.febr.73-76. [DOI] [PubMed] [Google Scholar]
- 3.Reeves GK, Pirie K, Beral V, et al. Million Women Study Collaboration. Cancer incidence and mortality in relation to body mass index in the Million Women Study: cohort study. BMJ. 2007;335:1134. doi: 10.1136/bmj.39367.495995.AE. [DOI] [PMC free article] [PubMed] [Google Scholar]
- 4.Calle EE, Kaaks R. Overweight, obesity and cancer: epidemiological evidence and proposed mechanisms. Nat Rev Cancer. 2004;4:579–591. doi: 10.1038/nrc1408. [DOI] [PubMed] [Google Scholar]
- 5.Radimer KL, Ballard-Barbash R, Miller JS, et al. Weight change and the risk of late-onset breast cancer in the original Framingham cohort. Nutr Cancer. 2004;49:7–13. doi: 10.1207/s15327914nc4901_2. [DOI] [PubMed] [Google Scholar]
- 6.Ahn J, Schatzkin A, Lacey JV, Jr, et al. Adiposity, adult weight change, and postmenopausal breast cancer risk. Arch Intern Med. 2007;167:2091–2102. doi: 10.1001/archinte.167.19.2091. [DOI] [PubMed] [Google Scholar]
- 7.Eliassen AH, Colditz GA, Rosner B, Willett WC, Hankinson SE. Adult weight change and risk of postmenopausal breast cancer. JAMA. 2006;296:193–201. doi: 10.1001/jama.296.2.193. [DOI] [PubMed] [Google Scholar]
- 8.Feigelson HS, Jonas CR, Teras LR, Thun MJ, Calle EE. Weight gain, body mass index, hormone replacement therapy, and postmenopausal breast cancer in a large prospective study. Cancer Epidemiol Biomarkers Prev. 2004;13:220–224. doi: 10.1158/1055-9965.epi-03-0301. [DOI] [PubMed] [Google Scholar]
- 9.Han D, Nie J, Bonner MR, et al. Lifetime adult weight gain, central adiposity, and the risk of pre- and postmenopausal breast cancer in the Western New York exposures and breast cancer study. Int J Cancer. 2006;119:2931–2937. doi: 10.1002/ijc.22236. [DOI] [PubMed] [Google Scholar]
- 10.Lahmann PH, Schulz M, Hoffmann K, et al. Long-term weight change and breast cancer risk: the European prospective investigation into cancer and nutrition (EPIC) Br J Cancer. 2005;93:582–589. doi: 10.1038/sj.bjc.6602763. [DOI] [PMC free article] [PubMed] [Google Scholar]
- 11.Harvie M, Howell A, Vierkant RA, et al. Association of gain and loss of weight before and after menopause with risk of postmenopausal breast cancer in the Iowa women’s health study. Cancer Epidemiol Biomarkers Prev. 2005;14:656–661. doi: 10.1158/1055-9965.EPI-04-0001. [DOI] [PubMed] [Google Scholar]
- 12.Pichard C, Plu-Bureau G, Neves-E Castro M, Gompel A. Insulin resistance, obesity and breast cancer risk. Maturitas. 2008;60:19–30. doi: 10.1016/j.maturitas.2008.03.002. [DOI] [PubMed] [Google Scholar]
- 13.MacLean PS, Higgins JA, Johnson GC, et al. Metabolic adjustments with the development, treatment, and recurrence of obesity in obesity-prone rats. Am J Physiol Regul Integr Comp Physiol. 2004;287:R288–R297. doi: 10.1152/ajpregu.00010.2004. [DOI] [PubMed] [Google Scholar]
- 14.Thompson HJ, McGinley JN, Wolfe P, et al. Temporal sequence of mammary intraductal proliferations, ductal carcinomas in situ and adenocarcinomas induced by 1-methyl-1-nitrosourea in rats. Carcinogenesis. 1998;19:2181–2185. doi: 10.1093/carcin/19.12.2181. [DOI] [PubMed] [Google Scholar]
- 15.Thompson HJ, Adlakha H, Singh M. Effect of carcinogen dose and age at administration on induction of mammary carcinogenesis by 1-methyl-1-nitrosourea. Carcinogenesis. 1992;13:1535–1539. doi: 10.1093/carcin/13.9.1535. [DOI] [PubMed] [Google Scholar]
- 16.Nandi S, Guzman RC, Yang J. Hormones and mammary carcinogenesis in mice, rats, and humans: a unifying hypothesis. Proc Natl Acad Sci USA. 1995;92:3650–3657. doi: 10.1073/pnas.92.9.3650. [DOI] [PMC free article] [PubMed] [Google Scholar]
- 17.MacLean PS, Higgins JA, Johnson GC, et al. Enhanced metabolic efficiency contributes to weight regain after weight loss in obesity-prone rats. Am J Physiol Regul Integr Comp Physiol. 2004;287:R1306–R1315. doi: 10.1152/ajpregu.00463.2004. [DOI] [PubMed] [Google Scholar]
- 18.Young S, Hallowes RC. Tumours of the mammary gland. IARC Sci Publ. 1973;31 [PubMed] [Google Scholar]
- 19.Young CD, Anderson SM. Sugar and fat – that’s where it’s at: metabolic changes in tumors. Breast Cancer Res. 2008;10:202. doi: 10.1186/bcr1852. [DOI] [PMC free article] [PubMed] [Google Scholar]
- 20.Jernström H, Barrett-Connor E. Obesity, weight change, fasting insulin, proinsulin, C-peptide, and insulin-like growth factor-1 levels in women with and without breast cancer: the Rancho Bernardo Study. J Womens Health Gend Based Med. 1999;8:1265–1272. doi: 10.1089/jwh.1.1999.8.1265. [DOI] [PubMed] [Google Scholar]
- 21.Hakkak R, Holley AW, Macleod SL, et al. Obesity promotes 7,12-dimethylbenz(a)anthracene-induced mammary tumor development in female zucker rats. Breast Cancer Res. 2005;7:R627–R633. doi: 10.1186/bcr1263. [DOI] [PMC free article] [PubMed] [Google Scholar]
- 22.Dogan S, Hu X, Zhang Y, et al. Effects of high-fat diet and/or body weight on mammary tumor leptin and apoptosis signaling pathways in MMTV-TGF-alpha mice. Breast Cancer Res. 2007;9:R91. doi: 10.1186/bcr1840. [DOI] [PMC free article] [PubMed] [Google Scholar]
- 23.Hakkak R, MacLeod S, Shaaf S, et al. Obesity increases the incidence of 7,12-dimethylbenz(a)anthracene-induced mammary tumors in an ovariectomized Zucker rat model. Int J Oncol. 2007;30:557–563. [PubMed] [Google Scholar]
- 24.Klurfeld DM, Lloyd LM, Welch CB, et al. Reduction of enhanced mammary carcinogenesis in LA/N-cp (corpulent) rats by energy restriction. Proc Soc Exp Biol Med. 1991;196:381–384. doi: 10.3181/00379727-196-43202. [DOI] [PubMed] [Google Scholar]
- 25.Whitehead TL, Holley AW, Korourian S, et al. (1)H nuclear magnetic resonance metabolomic analysis of mammary tumors from lean and obese Zucker rats exposed to 7,12-dimethylbenz[a]anthracene. Int J Mol Med. 2007;20:573–580. [PubMed] [Google Scholar]
- 26.de Assis S, Wang M, Goel S, et al. Excessive weight gain during pregnancy increases carcinogen-induced mammary tumorigenesis in Sprague-Dawley and lean and obese Zucker rats. J Nutr. 2006;136:998–1004. doi: 10.1093/jn/136.4.998. [DOI] [PubMed] [Google Scholar]
- 27.Ray A, Nkhata KJ, Grande JP, Cleary MP. Diet-induced obesity and mammary tumor development in relation to estrogen receptor status. Cancer Lett. 2007;253:291–300. doi: 10.1016/j.canlet.2007.02.005. [DOI] [PubMed] [Google Scholar]
- 28.Cohen LA, Chan PC, Wynder EL. The role of a high-fat diet in enhancing the development of mammary tumors in ovariectomized rats. Cancer. 1981;47:66–71. doi: 10.1002/1097-0142(19810101)47:1<66::aid-cncr2820470113>3.0.co;2-m. [DOI] [PubMed] [Google Scholar]
- 29.Cleary MP, Grande JP, Juneja SC, Maihle NJ. Diet-induced obesity and mammary tumor development in MMTV-neu female mice. Nutr Cancer. 2004;50:174–180. doi: 10.1207/s15327914nc5002_7. [DOI] [PubMed] [Google Scholar]
- 30.Nunez NP, Perkins SN, Smith NC, et al. Obesity accelerates mouse mammary tumor growth in the absence of ovarian hormones. Nutr Cancer. 2008;60:534–541. doi: 10.1080/01635580801966195. [DOI] [PubMed] [Google Scholar]
- 31.Lee WM, Lu S, Medline A, Archer MC. Susceptibility of lean and obese Zucker rats to tumorigenesis induced by N-methyl-N-nitrosourea. Cancer Lett. 2001;162:155–160. doi: 10.1016/s0304-3835(00)00635-2. [DOI] [PubMed] [Google Scholar]
- 32.Cleary MP, Phillips FC, Getzin SC, et al. Genetically obese MMTV-TGF-alpha/Lep(ob)Lep(ob) female mice do not develop mammary tumors. Breast Cancer Res Treat. 2003;77:205–215. doi: 10.1023/a:1021891825399. [DOI] [PubMed] [Google Scholar]
- 33.Clegg DJ, Benoit SC, Reed JA, et al. Reduced anorexic effects of insulin in obesity-prone rats fed a moderate-fat diet. Am J Physiol Regul Integr Comp Physiol. 2005;288:R981–R986. doi: 10.1152/ajpregu.00675.2004. [DOI] [PubMed] [Google Scholar]
- 34.Levin BE, Dunn-Meynell AA, Banks WA. Obesity-prone rats have normal blood-brain barrier transport but defective central leptin signaling before obesity onset. Am J Physiol Regul Integr Comp Physiol. 2004;286:R143–R150. doi: 10.1152/ajpregu.00393.2003. [DOI] [PubMed] [Google Scholar]
- 35.Clegg DJ, Brown LM, Woods SC, Benoit SC. Gonadal hormones determine sensitivity to central leptin and insulin. Diabetes. 2006;55:978–987. doi: 10.2337/diabetes.55.04.06.db05-1339. [DOI] [PubMed] [Google Scholar]
- 36.Lemieux C, Picard F, Labrie F, Richard D, Deshaies Y. The estrogen antagonist EM-652 and dehydroepiandrosterone prevent diet- and ovariectomy-induced obesity. Obes Res. 2003;11:477–490. doi: 10.1038/oby.2003.65. [DOI] [PubMed] [Google Scholar]
- 37.Storlien L, Oakes ND, Kelley DE. Metabolic flexibility. Proc Nutr Soc. 2004;63:363–368. doi: 10.1079/PNS2004349. [DOI] [PubMed] [Google Scholar]
- 38.Jackman MR, Steig A, Higgins JA, et al. Weight regain after sustained weight reduction is accompanied by suppressed oxidation of dietary fat and adipocyte hyperplasia. Am J Physiol Regul Integr Comp Physiol. 2008;294:R1117–R1129. doi: 10.1152/ajpregu.00808.2007. [DOI] [PubMed] [Google Scholar]
- 39.MacLean PS, Higgins JA, Jackman MR, et al. Peripheral metabolic responses to prolonged weight reduction that promote rapid, efficient regain in obesity-prone rats. Am J Physiol Regul Integr Comp Physiol. 2006;290:R1577–R1588. doi: 10.1152/ajpregu.00810.2005. [DOI] [PubMed] [Google Scholar]
- 40.Schutz Y. Dietary fat, lipogenesis and energy balance. Physiol Behav. 2004;83:557–564. doi: 10.1016/j.physbeh.2004.09.015. [DOI] [PubMed] [Google Scholar]
- 41.Nicolini A, Carpi A, Rossi G. Cytokines in breast cancer. Cytokine Growth Factor Rev. 2006;17:325–337. doi: 10.1016/j.cytogfr.2006.07.002. [DOI] [PubMed] [Google Scholar]
- 42.Manjanatha M, Shelton S, Bishop M, Lyn-Cook L, Aidoo A. Dietary effects of soy isoflavones daidzein and genistein on 7,12-dimethylbenz[a]anthracene-induced mammary mutagenesis and carcinogenesis in ovariectomized Big Blue transgenic rats. Carcinogenesis. 2006;27:1970–1979. doi: 10.1093/carcin/bgl028. [DOI] [PubMed] [Google Scholar]
- 43.Allred CD, Allred KF, Ju YH, et al. Dietary genistein results in larger MNU-induced, estrogen-dependent mammary tumors following ovariectomy of Sprague-Dawley rats. Carcinogenesis. 2004;25:211–218. doi: 10.1093/carcin/bgg198. [DOI] [PubMed] [Google Scholar]
- 44.Lacroix A, Doskas C, Bhat PV. Inhibition of growth of established N-methyl-N-nitrosourea-induced mammary cancer in rats by retinoic acid and ovariectomy. Cancer Res. 1990;50:5731–5734. [PubMed] [Google Scholar]
- 45.Waxler SH, Leef MF. Augmentation of mammary tumors in castrated obese C3H mice. Cancer Res. 1966;26:860–862. [PubMed] [Google Scholar]
- 46.Yakar S, Nunez NP, Pennisi P, et al. Increased tumor growth in mice with diet-induced obesity: impact of ovarian hormones. Endocrinology. 2006;147:5826–5834. doi: 10.1210/en.2006-0311. [DOI] [PubMed] [Google Scholar]
- 47.Feigelson HS, Patel AV, Teras LR, et al. Adult weight gain and histopathologic characteristics of breast cancer among postmenopausal women. Cancer. 2006;107:12–21. doi: 10.1002/cncr.21965. [DOI] [PubMed] [Google Scholar]
- 48.Giuffrida D, Lupo L, La Porta GA, et al. Relation between steroid receptor status and body weight in breast cancer patients. Eur J Cancer. 1992;28:112–115. doi: 10.1016/0959-8049(92)90397-k. [DOI] [PubMed] [Google Scholar]
- 49.Simpson ER, Mahendroo MS, Nichols JE, Bulun SE. Aromatase gene expression in adipose tissue: relationship to breast cancer. Int J Fertil Menopausal Stud. 1994;39(Suppl 2):75–83. [PubMed] [Google Scholar]
- 50.Zhao H, Tian Z, Hao J, Chen B. Extragonadal aromatization increases with time after ovariectomy in rats. Reprod Biol Endocrinol. 2005;3:6. doi: 10.1186/1477-7827-3-6. [DOI] [PMC free article] [PubMed] [Google Scholar]