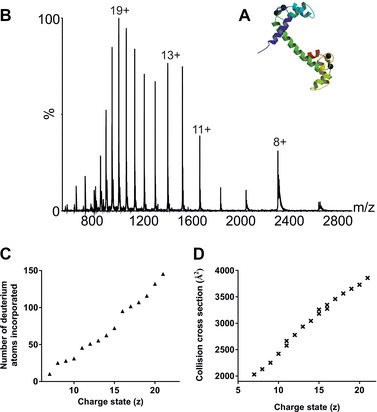
Figure 5.

(A) Ribbon diagram of bovine calmodulin (PDB: 1OSA 50); (B) ESI‐MS spectrum of bovine calmodulin from 50 mM aqueous ammonium acetate solution; (C) number of deuterium atoms incorporated from gas‐phase HDX as a function of charge state; (D) ESI‐IMS‐MS estimated collision cross‐sections for calmodulin as a function of charge state.
