
FIGURE 3.
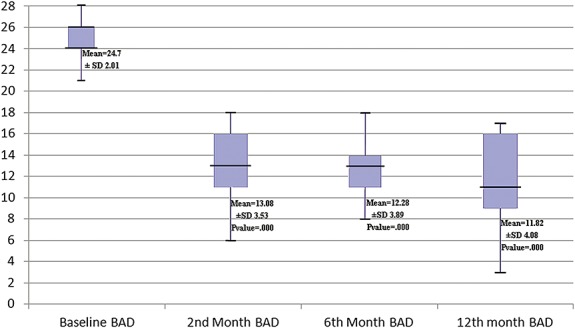
Demonstrating changes in the mean Barry-Albright Dystonia Scale (BAD) during the follow-up period. Color version available online only.
Official websites use .gov
A
.gov website belongs to an official
government organization in the United States.
Secure .gov websites use HTTPS
A lock (
) or https:// means you've safely
connected to the .gov website. Share sensitive
information only on official, secure websites.
Demonstrating changes in the mean Barry-Albright Dystonia Scale (BAD) during the follow-up period. Color version available online only.