

Abstract
BACKGROUND
Metachronous Colorectal Cancer (MCRC) incidence amongst colorectal cancer (CRC) survivors varies significantly and the optimal colonoscopy surveillance practice to mitigate MCRC incidence is unknown.
METHODS
We conducted a cost-effectiveness analysis by comparing performances of the US Multi-Society Task Force guideline and all clinically-reasonable colonoscopy surveillance strategies among 50–79-year-old post-treatment CRC patients using a computer-simulation model.
RESULTS
The US guideline [(1,3,5)] recommends the first colonoscopy 1-year after treatment while the second and third colonoscopies are repeated with 3- and 5-year intervals. We identified some promising alternative cost-effective strategies. Compared to the US guideline under various scenarios for 20-year period, 1) reducing the surveillance interval of the guideline after the first colonoscopy by 1-year [(1,2,5)] saves/prevents up to 78 discounted-life-years and 23 MCRCs per 1000-patients (incremental cost-effectiveness ratio (ICER)≤$23,270/life-year); 2) reducing the intervals after the first and second negative colonoscopy by 1-year [(1,2,4)] saves/prevents up to 109 discounted-life-years and 36 MCRCs (ICER≤$52,155/life-year); 3) (1,2,3) saves/prevents up to 141 discounted-life-years and 50 MCRCs (ICER≤$68,822/life-year). These strategies require up to 1100 additional colonoscopies per 1000-patients. Although, the US guideline may not be cost-effective compared to less-intensive oncology guideline (3,3,5) (ICER can be as high as $140,000/LY), the promising strategies are cost-effective compared to such less-intensive guidelines unless cumulative MCRC incidence is very low.
CONCLUSIONS
The US guideline might be improved by slightly increasing the surveillance intensity at the expense of moderately increased cost. More research is warranted to explore the benefits/harms of such practices.
Keywords: Cancer Surveillance, Second Primary Cancer, Economic Evaluation, Discrete-event Simulation, Cost-effectiveness
INTRODUCTION
There is a growing colorectal cancer (CRC) survivor (post-treatment CRC) population in the US (1.16-million in 2011)1. Patients are recommended to undergo intensive colonoscopy surveillance after CRC treatment because of the high incidence of metachronous CRC (MCRC)2–4. Although indirect evidence exists for its effectiveness5, the actual benefit and the optimal frequency of colonoscopy surveillance among post-treatment CRC patients are unknown4,6. Reported long-term cumulative MCRC incidence (defined over a follow-up period of up to 20 years) varies significantly in the range of 2%–12%* and is associated with several risk-factors (age, family history, CRC stage/location) reflecting the heterogeneity in MCRC progression rates among the post-treatment CRC population5,7–9. Therefore, evaluating the effectiveness of post-treatment CRC surveillance in MCRC prevention/early-detection and determining the optimal colonoscopy surveillance strategies for different cumulative MCRC incidence scenarios are imperative.
Although similar issues for primary CRC are well-addressed through economic evaluations using computer-models10–13, such research is limited on post-treatment CRC surveillance. Only two studies analyzed the performances of a few surveillance strategies using computer models14,15. However, they either considered a limited horizon or used only data from the literature with significant assumptions. Erenay et al. (2011) developed an MCRC natural history (MCRC-NH) simulation model using a dataset from the Mayo Clinic, Rochester16. Using the MCRC-NH model, we conducted a cost-effectiveness analysis from the societal perspective for all clinically-reasonable colonoscopy surveillance strategies among 50–79-year-old US post-treatment CRC population who recently completed their initial treatment. We identified effective colonoscopy surveillance strategies under various cost, colonoscopy sensitivity, and cumulative MCRC incidence scenarios.
DATA AND METHODS
MCRC-NH Simulation Model and MCRC Progression
The MCRC-NH model, coded in Java, is a discrete-event micro-simulation model which mimics MCRC development in a post-treatment CRC population by simulating one patient at-a-time based on gender (male and female) and age-group (50–59, 60–69, and 70–79-year-old). That is, MCRC progression parameters used in the model vary among different patient-groups while these parameters (thus, the average MCRC incidence and mortality) are similar among those in the same patient-group. The model was calibrated and validated using longitudinal data from Mayo Clinic, Rochester16. We ran the MCRC-NH model for 500,000 patients for each gender/age-group for 20 years after the initial treatment to evaluate each surveillance strategy based on prevented MCRCs, saved life-years (LYs), number of required colonoscopies, and total costs (details about their derivation are given in Supplementary-Materials I).
As a common practice, we defined any new cancer diagnosed after the first six months from the primary CRC treatment as an MCRC5,7. Assuming a successful and complete treatment, post-treatment CRC patients are cancer- and polyp-free when the model initiates MCRC progression. A patient may develop multiple colorectal lesions in 20 years and each lesion independently progresses through the polyp-to-CRC sequence following the annual Markovian state-transition pattern illustrated in Figure 1a. We divided the cancer state into MCRC (local/regional cancer) and M-MCRC (metastatic/distant cancer) stages. M-MCRCs are symptomatically detected within a year while MCRCs are detected by surveillance colonoscopies. Patients diagnosed with metachronous lesions undergo appropriate treatment after which, they may develop new lesions. Although we did not explicitly model CRC recurrence, its effect is incorporated into the estimated treatment mortality probabilities. More details about the MCRC-NH model are available elsewhere16.
Figure 1.
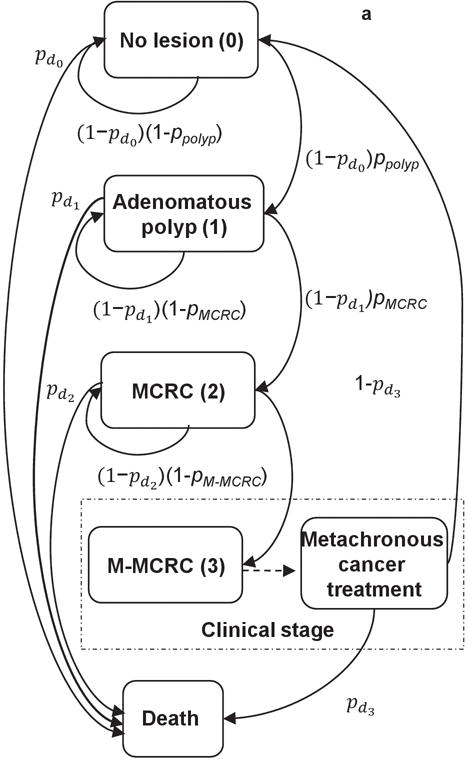

a,b Metachronous colorectal cancer (MCRC) progression flow-chart and surveillance colonoscopy intervals for the US guideline after the initial treatment at age 60. In Figure 1a, the arrows illustrate annual MCRC lesion progression pathways with the associated probabilities. ppolyp: Annual polyp-onset probability; pMCRC: Annual probability of polyp-to-MCRC progression; pM-MCRC: Annual probability of MCRC-to-M-MCRC progression; , : Annual probability of mortality from other causes not associated with MCRC; : Annual probability of mortality from undetected MCRC; : Annual probability of mortality after M-MCRC treatment. In Figure 1b, I1 represents the surveillance interval after colorectal cancer (CRC) treatment or a positive colonoscopy while I2 and I3 represent the surveillance intervals after the first and second negative colonoscopy, respectively. Circles represent the ages at surveillance colonoscopies. Test +/− refer to detecting/not- detecting metachronous polyps or MCRC. The surveillance interval is reduced to 1-year based on I1 after a positive finding at age 61, i.e., next colonoscopy is at age 62. After the second Test - at age 64, the surveillance interval is fixed to 5-year until the next abnormal finding.
Input Parameters
Table 1 presents the input parameters of the MCRC-NH simulation model whose baseline MCRC progression parameters (within 5 years after primary CRC treatment) were derived from a longitudinal dataset of around 300 patients diagnosed and treated at Mayo Clinic, Rochester during 1992–2006. These patients are randomly selected among approximately 600 local post-treatment CRC patients resided within or immediately surrounding Olmsted County to eliminate missing data issues. We excluded patients with genetic conditions such as familial adenomatous polyposis (FAP) and hereditary nonpolyposis colorectal cancer (HNPCC) as well as those younger than 50 and older than 80 years. We did not exclude patients with family history of colorectal cancer. The data included colonoscopy histories, polyp/MCRC incidents, and mortalities from MCRC and other causes over a 5-year period after CRC treatment.
Table 1.
Estimates, Ranges, and Sources of Input Parameters
| Parameters | Baseline | Low | High | Source |
|---|---|---|---|---|
| Annual MCRC progression probabilities | ||||
| Adenomatous polyp-onset | 12%* | Varies based on cumulative MCRC incidence scenario (see Supplementary-Materials IV) | ||
| Adenomatous polyp-to-MCRC progression | 16%* | |||
| MCRC-to-M-MCRC progression | 27%* | 16 | ||
| Mortality after MCRC treatment | 3%* | |||
| Mortality from undetected MCRC | 8%* | |||
| Mortality after M-MCRC treatment | 11%* | |||
| Mortality from other causes | 1%* | |||
| Adenoma number at polyp-onset | ||||
| 1, 2, and 3 polyps | 78%,13%,9% | 16 | ||
| Inputs related to colonoscopy surveillance | ||||
| Colonoscopy sensitivity: for adenomatous polyps | 85% | 80% | 90% | 10,13 |
| for MCRC | 90% | 85% | 95% | |
| Colonoscopy specificity | 100% | 10,13 | ||
| Probability of detecting/biopsying other lesions (e.g., inflammation, hyperplastic polyp) | 16% | 30 | ||
| Probability of major complication with and without polypectomy/biopsy | 7/1000, 8/10000 | 18 | ||
| Probability of mortality from perforation with and without polypectomy/biopsy | 1.6/10000*, 1/10000* | 18,19 | ||
| Costs (USD) | ||||
| Colonoscopy | $865 | $430 | $1,725 | |
| Polypectomy/biopsy plus pathology lab | $240 | $120 | $480 | |
| Colonoscopy complication treatment | $6,750 | $3,400 | $13,500 | |
| MCRC treatment (costs within the first year after the treatment) | $51,100* | $42,000* | $62,000* | 11,12,31 |
| Costs (USD) | ||||
| M-MCRC treatment (costs within the first year after the treatment) | $84,500* | $70,000 | $132,600* | |
| Annual continuing care after CRC/MCRC treatment | $5,300* | $4,350* | $6,475* | |
| Annual continuing care after M-MCRC treatment | $13,600* | $11,250* | $16,600* | |
| Terminal care for MCRC deaths (last year of life) | $69,000* | $56,500* | $83,000* | 11,12,31 |
| Terminal care for M-MCRC deaths (last year of life) | $96,000* | $78,700* | $116,000* | |
| Terminal care for deaths from other causes (last year of life) | $23,200* | $19,000* | $28,400* | |
| Other parameters | ||||
| Gender/age distribution among US post-treatment CRC population | Varies by age and gender | 1,17 | ||
| Cancer stage distribution to restructure costs from the literature to comply with our stage definition | Varies by stage | 32 | ||
| Discount rate | 3% | 11,21 | ||
| Consumer Price Index in 2007–2013 (medical care component) | 3.4%** | 20 | ||
| MCRC progression rate multiplier | 1 | 0.32 | 1 | Supl.-Materials IV |
M-MCRC, metastatic/distant MCRC. The table presents only the average values. The inputs with * vary by age and gender while those with ** vary by year (See Supplementary-Materials III for the derivation and details).
The details about the data and derivation of parameters are described elsewhere16. In order to better represent the general population and extend the analysis horizon to 20 years for accurate long-term performance evaluation, we recalibrated the baseline probability of mortality from other causes and lesion progression probabilities while our results comply with particular trends in the Surveillance, Epidemiology, and End Results (SEER) reports and literature. The methodology for recalibrating these parameters is described in Supplementary-Materials II.
We derived age/gender distribution of the recently treated 50–79-year-old post-treatment CRC population using SEER (1975–2008) CRC incidence rates and 2008 US census estimates1,17. We derived the characteristics of colonoscopy and perforation risk from the primary CRC literature10,13,18,19. The total cost includes costs of MCRC treatment, colonoscopy surveillance, and terminal care which are derived from the primary CRC literature and updated to 2013 US dollars using Consumer Price Index20. The high- and low-cost scenarios are estimated based on Ramsey et al. (2010)11,12. We used a 3% annual discount rate for costs and health-outcomes21.
The US Guideline and Alternative Surveillance Strategies
We assumed that a colonoscopy may independently detect different colorectal lesions. US Multi-Society Task Force guideline recommends undergoing the first colonoscopy surveillance 1 year after CRC treatment and increasing the surveillance interval to 3 and 5 years after the first and second negative colonoscopy, respectively3. This surveillance guideline can be represented in the form of (I1=1,I2=3,I3=5). Figure 1b illustrates how (1,3,5) specifies the US guideline’s colonoscopy surveillance intervals for a 60-year-old post-treatment CRC patient.
We evaluated the performance of all strategies in the form of (I1,I2,I3) where I1≤I2≤I3≤5(full list is given in Supplementary-Materials V). Among them, we identified a set of promising strategies that may improve the US guideline. We first identified the Pareto-efficient strategies. Strategy A dominates B, if A both improves health-outcomes and reduces costs compared to B. When all dominated strategies are removed from the set of feasible strategies, the remaining ones are the Pareto-efficient strategies for which no other alternative strategy may lead to better health-outcomes with less cost.
Some Pareto-efficient surveillance strategies like (1,1,1) may require too many additional colonoscopies than the US guideline. Therefore, we reported detailed performance of “promising strategies”, a subset of Pareto-efficient or close-to-Pareto-efficient strategies that require at most 40% (i.e., around 1/patient) additional colonoscopies compared to the existing guideline in the baseline case.
Sensitivity Analysis
We only considered baseline, high, and low values for colonoscopy sensitivity and costs, whereas we used 20-year MCRC incidence rate scenarios of 1.7%, 3%, 5.5%, 7.2%, 9.6%, and 12.8% to represent the long-term MCRC incidence range reported in the literature (2%–12%)5,9. The baseline input parameters of the MCRC-NH model represents the high-end of this range with a 20-year MCRC incidence of 12.8%. In order to derive these scenarios, we multiplied the annual MCRC progression probabilities with a set of progression rate multipliers representing how fast and commonly MCRC is developed. We selected these multipliers by matching the estimated cumulative MCRC incidences to those reported in existing cohort studies (See Supplementary-Materials IV for details).
RESULTS
Among 50–79-year-old post-treatment CRC population, the US guideline is associated with 1.7%–12.8% cumulative MCRC incidence, 7.75–8.13 discounted LYs per patient, and a total cost of $49,101–$55,162/patient while requiring 2.97–3.34 colonoscopies/patient over a 20-year period under various parameter scenarios.
Performances of Alternative Strategies in the Baseline Scenario
Figure 2 presents the incremental performance of alternative strategies compared to the US guideline in the baseline scenario. Most strategies in Regions I and IV require more intensive surveillance than the guideline; thus, they are associated with reduced MCRC incidence and treatment costs which offset the increase in colonoscopy surveillance cost for strategies in Region IV. Therefore, strategies in Region IV dominate the guideline, while those in Region I are more effective but more costly. Excluding strategies generating less life-years than the US guideline, Regions I and IV contain all of the Pareto-efficient strategies which are cost-effective for the baseline scenario (See Supplementary-Materials VI). Because most Pareto-efficient strategies in Region IV move to Region I as cumulative MCRC incidence increases, we analyze the promising strategies from both Region I and IV rather than only those from IV.
Figure 2.

Relative performance of the alternative strategies compared to the US guideline for the baseline model parameters in Table 1. The figure shows the average incremental performance (per patient) of all-clinically reasonable strategies. The gray-square refers to the guideline while dotted-gray diamonds represent Pareto-efficient alternative strategies. The strategies within the ellipsoid are the promising Pareto-efficient and close-to-Pareto-efficient strategies.
Table 2 shows improvements associated with the Pareto-efficient alternative strategies compared to the guideline for the baseline scenario. Strategies such as annual colonoscopy [(1,1,1)], annual colonoscopy until the second negative surveillance and biennial afterwards [(1,1,2)], and (1,2,2) improve health-outcomes significantly; however, require at least two additional colonoscopies/patient compared to the guideline. The other Pareto-efficient strategies (excluding (1,1,3)) may incur up to two-fifth of the achievable baseline life-year savings and number of prevented MCRCs at the expense of less than 1.2 additional colonoscopies/patient (< 35% increase in the number of colonoscopies).
Table 2.
The Performance of Pareto-efficient Strategies for the Baseline Parameters Compared to the Guideline
| (1,1,1) | (1,1,2) | (1,2,2) | (1,1,3) | (1,2,3) | (2,2,3) | (1,2,4) | (2,2,4) | (2,2,5) | |
|---|---|---|---|---|---|---|---|---|---|
| Saved LYs per 1000-patients | 323 | 237 | 183 | 142 | 141 | 113 | 109 | 82 | 56 |
| 4.1% | 3.0% | 2.3% | 1.8% | 1.8% | 1.4% | 1.4% | 1.0% | 0.7% | |
| Prevented MCRCs per 1000-patients | 119 | 82 | 65 | 52 | 50 | 35 | 36 | 22 | 12 |
| 92.7% | 63.9% | 50.8% | 40.6% | 39.0% | 27.0% | 27.8% | 17.1% | 9.0% | |
| Additional CLs per 1000-patients | 6243 | 2945 | 2092 | 1698 | 1148 | 395 | 675 | 40 | −252 |
| 187.2% | 88.3% | 62.7% | 50.9% | 34.4% | 11.8% | 20.2% | 1.2% | −7.5% |
The guideline requires 3335 colonoscopies (CLs), and results in 128 MCRC incidents and 7842 LYs (life-years) per 1000 post-treatment CRC patients for baseline parameters. Rows 1, 3, and 5 show performance differences compared to the guideline. Rows 2, 4, and 6 present the proportion of these differences, e.g., (1,1,1) saves 323 more discounted life-years (4.1%=100×323/7848), prevents 119 MCRCs (92.7%=100×119/128), and requires 6,243 more colonoscopies (187.2%=100×6243/3335).
Sensitivity Analysis Results
As illustrated in Supplementary-Materials VII, 5–10% variation in colonoscopy sensitivity minimally affects the performances and composition of set of Pareto-efficient strategies. Figure 3 shows that changes in cost and cumulative MCRC incidence lead to significant variation in health-outcomes and incremental cost-effectiveness ratios (ICERs) of Pareto-efficient strategies. As expected, the improvements in saved life-years and prevented MCRCs decrease as the cumulative MCRC incidence decreases and ICERs exponentially increase with the surveillance intensity. Note that, most Pareto-efficient alternative strategies are cost-effective (i.e., ICERs < $50,000/LY) compared to the guideline except very intensive ones (e.g., (1,1,1), (1,1,2)). Supplementary-Materials VI provides detailed evaluation of the strategies in Figure 3.
Figure 3.


Pareto-efficient strategies for different cumulative metachronous colorectal cancer (MCRC) incidence and cost scenarios given the baseline colonoscopy sensitivity. LYs, life-years. Both figures illustrate the performance Pareto-efficient strategies based on average cost and life-years per patient. Figure 3a is for the baseline-cost scenario; while, Figure 3b is for the high-cost scenario. Because the results for the low-cost scenario are similar to those in the baseline-cost scenario, they are omitted. Large-black icons represent the guideline while gray icons represent Pareto-efficient-strategies that are associated with an incremental cost-effectiveness ratio (ICER)>$50,000/LY compared to the guideline.
Although the composition of set of Pareto-efficient strategies varies significantly based on the cumulative MCRC incidence, (1,1,1), (1,1,2), (1,2,3), (2,2,2), (2,2,3), (2,2,4), and (2,2,5) are amongst the Pareto-efficient strategies for almost all parameter scenarios. Among these, we refer to (1,2,3), (2,2,2), (2,2,3), (2,2,4) and (2,2,5) as “promising strategies” because they improve health-outcomes by moderately increasing required number of colonoscopies compared to the US guideline. We have also included (1,2,4) and (1,2,5) among them due to their similar performance to (2,2,3) and (2,2,4), respectively. Table 3 illustrates the performances of the promising strategies compared to the guideline for both baseline and high-cost scenarios. Only Strategy (2,2,5) is always both more effective and cost-saving than the guideline. However, in all scenarios, (2,2,5) only generates around 17–35% and 10% of achievable saved life-years and prevented MCRCs (e.g., the performance difference between (1,1,1) and (1,3,5)), respectively.
Table 3.
Performances of Promising Strategies Compared to the Guideline for the Baseline Colonoscopy Sensitivity
| 12.8% Cumulative MCRC incidence | (1,2,3) | (2,2,2) | (1,2,4) | (2,2,3) | (1,2,5) | (2,2,4) | (2,2,5) | ||
|---|---|---|---|---|---|---|---|---|---|
| Saved LYs per 1000-patients | 141 | 138 | 109 | 113 | 78 | 82 | 56 | ||
| Prevented MCRCs per 1000-patients | 50 | 47 | 36 | 35 | 23 | 22 | 12 | ||
| Additional CLs per 1000-patients | 1148 | 1134 | 675 | 395 | 332 | 40 | −252 | ||
| Number of CLs per prevented MCRC | 23.0 | 24.1 | 18.9 | 11.4 | 14.2 | 1.8 | −21.9 | ||
| Number of CLs per saved LYs | 8.1 | 8.2 | 6.2 | 3.5 | 4.2 | 0.5 | −4.5 | ||
| ICER compared to (1,3,5) for baseline-cost | $1,351 | $1,801 | ** | ** | |||||
| ICER compared to (1,3,5) for high-cost | $3,963 | $3,310 | $428 | ||||||
| 9.6% Cumulative MCRC incidence | (1,2,3) | (2,2,2) | (1,2,4) | (2,2,3) | (1,2,5) | (2,2,4) | (2,2,5) | ||
| Saved LYs per 1000-patients | 110 | 109 | 83 | 87 | 56 | 65 | 46 | ||
| Prevented MCRCs per 1000-patients | 39 | 38 | 27 | 28 | 17 | 17 | 9 | ||
| Additional CLs per 1000-patients | 1132 | 1253 | 650 | 453 | 297 | 77 | −228 | ||
| Number of CLs per prevented MCRC | 29.3 | 32.8 | 23.9 | 16.4 | 17.2 | 4.4 | −24.6 | ||
| Number of CLs per saved LYs | 10.3 | 11.5 | 7.8 | 5.2 | 5.3 | 1.2 | −5.0 | ||
| ICER compared to (1,3,5) for baseline-cost | $3,954 | $4,234 | $1,593 | $1,099 | ** | ||||
| ICER compared to (1,3,5) for high-cost | $8,695 | $8,067 | $4,374 | $1,168 | |||||
| 7.3% Cumulative MCRC incidence | (1,2,3) | (2,2,2) | (1,2,4) | (2,2,3) | (1,2,5) | (2,2,4) | (2,2,5) | ||
| Saved LYs per 1000-patients | 83 | 89 | 60 | 71 | 44 | 55 | 40 | ||
| Prevented MCRCs per 1000-patients | 30 | 30 | 21 | 22 | 13 | 14 | 7 | ||
| Additional CLs per 1000-patients | 1116 | 1354 | 628 | 502 | 270 | 108 | −209 | ||
| Number of CLs per prevented MCRC | 36.9 | 44.6 | 29.6 | 22.8 | 20.3 | 7.8 | −27.9 | ||
| Number of CLs per saved LYs | 13.5 | 15.3 | 10.4 | 7.1 | 6.2 | 2.0 | −5.3 | ||
| ICER compared to (1,3,5) for baseline-cost | $6,596 | $7,065 | $3,447 | $2,813 | ** | ** | |||
| ICER compared to (1,3,5) for high-cost | $13,963 | $13,518 | $8,352 | $4,417 | $1,906 | ||||
| 5.5% Cumulative MCRC incidence | (1,2,3) | (2,2,2) | (1,2,4) | (2,2,3) | (1,2,5) | (2,2,4) | (2,2,5) | ||
| Saved LYs per 1000-patients | 63 | 69 | 46 | 56 | 30 | 45 | 30 | ||
| Prevented MCRCs per 1000-patients | 23 | 24 | 16 | 17 | 10 | 11 | 6 | ||
| Additional CLs per 1000-patients | 1104 | 1433 | 614 | 541 | 246 | 132 | −195 | ||
| Number of CLs per prevented MCRC | 47.2 | 59.1 | 37.5 | 31.0 | 23.6 | 12.1 | −32.3 | ||
| Number of CLs per saved LYs | 17.5 | 20.9 | 13.2 | 9.7 | 8.3 | 2.9 | −6.5 | ||
| ICER compared to (1,3,5) for baseline-cost | $9,914 | $10,626 | $6,123 | $4,716 | $823 | ** | |||
| ICER compared to (1,3,5) for high-cost | $20,479 | $20,590 | $13,457 | $8,106 | $4,857 | ||||
| 3.0% Cumulative MCRC incidence | (1,2,3) | (2,2,2) | (1,2,4) | (2,2,3) | (1,2,5) | (2,2,4) | (2,2,5) | ||
| Saved LYs per 1000-patients | 32 | 42 | 19 | 31 | 13 | 25 | 14 | ||
| Prevented MCRCs per 1000-patients | 13 | 14 | 9 | 10 | 6 | 6 | 4 | ||
| Additional CLs per 1000-patients | 1086 | 1576 | 587 | 607 | 210 | 173 | −172 | ||
| Number of CLs per prevented MCRC | 82.0 | 110.9 | 62.7 | 59.0 | 36.4 | 27.0 | −48.1 | ||
| Number of CLs per saved LYs | 33.9 | 38.0 | 30.4 | 19.7 | 16.6 | 7.0 | −12.6 | ||
| ICER compared to (1,3,5) for baseline-cost | $22,221 | $21,465 | $16,704 | $10,803 | $6,230 | ** | |||
| ICER compared to (1,3,5) for high-cost | $45,309 | $41,889 | $36,620 | $20,341 | $18,115 | ||||
| 1.7% Cumulative MCRC incidence | (1,2,3) | (2,2,2) | (1,2,4) | (2,2,3) | (1,2,5) | (2,2,4) | (2,2,5) | ||
| Saved LYs per 1000-patients | 25 | 29 | 16 | 23 | 15 | 20 | 11 | ||
| Prevented MCRCs per 1000-patients | 8 | 8 | 5 | 6 | 3 | 4 | 2 | ||
| Additional CLs per 1000-patients | 1080 | 1670 | 576 | 651 | 193 | 202 | −153 | ||
| Number of CLs per prevented MCRC | 140.6 | 199.0 | 107.1 | 105.7 | 60.1 | 52.3 | −76.9 | ||
| Number of CLs per saved LYs | 44.0 | 56.8 | 36.9 | 28.3 | 13.3 | 10.0 | −13.4 | ||
| ICER compared to (1,3,5) for baseline-cost | $32,423 | $34,165 | $25,951 | $17,670 | $11,796 | $1,689 | ** | ||
| ICER compared to (1,3,5) for high-cost | $63,822 | $66,238 | $52,155 | $33,041 | $23,270 | $689 | |||
LYs, life-years; CLs, colonoscopies; ICER, incremental cost-effectiveness ratios; **, cost saving strategies.
Strategy (2,2,4) is biennial surveillance until the second negative colonoscopy followed by colonoscopies every four years thereafter while (1,2,5) refers to reducing the surveillance interval of the US guideline after the first negative colonoscopy by one year. In all scenarios, these strategies require up to 330 additional colonoscopies per 1000-patients while incurring around 25–50% of achievable saved LYs and 20% of achievable prevented MCRCs compared to the guideline. Strategy (2,2,3) and (1,2,4) require up to 675 additional colonoscopies per 1000-patients while generating 35–60% of achievable saved life-years and 30–35% of achievable prevented MCRCs. These strategies are cost-effective for all cost and incidence scenarios (ICER<$53,000/LY) compared to the guideline.
Biennial surveillance [(2,2,2)] and reducing the surveillance intervals of the US guideline after the first and second negative colonoscopy by one and two years [(1,2,3)] require around 1100–1600 additional colonoscopies per 1000-patients while incurring around 45–80% of achievable saved LYs and 40–50% of prevented MCRCs compared to the guideline. However, their ICERs slightly exceed $50,000/LY in the 1.7% cumulative MCRC incidence and high-cost scenario.
Comparison with Other Guidelines
We also compared the US guideline with the following less intensive guidelines (suggested by American Society of Clinical Oncology (ASCO), UK, and Canada): i) the first colonoscopy is three years after the treatment and once every five years thereafter [(3,5,5)]2, colonoscopy every five years [(5,5,5)]4, and (1,5,5)22. The US guideline, (1,3,5), improves health-outcomes over these less-intensive guidelines; however, the performance gap between (1,3,5) and (3,5,5) diminishes as cumulative MCRC incidence decreases. When cumulative MCRC incidence is below 5.5%, (1,3,5) saves 0–21 LYs and prevents 2–7 MCRCs per 1000-patients, and is associated with ICER around $39,000–$70,000/LY and $77,000–$140,000/LY for base- and high-cost scenarios compared to (3,5,5), respectively. The promising strategies are cost-effective compared to the less intensive guidelines unless cumulative MCRC incidence is very low. While ICERs of the promising strategies compared to (3,5,5) may exceed $50,000/LY for 3% cumulative MCRC incidence under high-cost scenario ($34,000–$69,200/LY), corresponding ICERs are above $50,000/LY and $100,000/LY for 1.7% cumulative MCRC incidence under base- and high-cost scenarios, respectively (See Supplementary-Materials VIII for detailed comparison).
DISCUSSION
Among the stable Pareto-efficient or close-to-Pareto-efficient strategies, only (2,2,5) is cost-saving while leading to more prevented MCRCs and saved LYs in all scenarios compared to the current US guideline. The rest improves these health-outcomes at the expense of additional surveillance colonoscopies and cost compared to (1,3,5). How preferable these alternative surveillance strategies are depends on cost and cumulative MCRC incidence levels; therefore, this study provides insights into the risks and benefits of these alternative strategies to inform discussions about the best MCRC surveillance.
Although they significantly improve health-outcomes, compared to the US guideline, (1,1,1) and (1,1,2) require around three additional colonoscopies per patient which may be infeasible given the current colonoscopy capacity. Strategies (2,2,2) and (1,2,3) are cost-effective in most scenarios incurring around 50% of the achievable health-outcome improvements in average. They can be alternative to the US guidelines if 1.1–1.5 additional surveillance colonoscopies per patient is feasible. Otherwise, (2,2,3) and (1,2,4), incurring around one-third of the achievable health-outcome improvements, can be considered as good alternatives with at most 0.67 additional colonoscopies per patient. Strategies (2,2,4) and (1,2,5) are also cost-effective in all scenarios and achieve around one-fourth of the attainable health-outcome improvements which can justify requiring at most 0.33 additional colonoscopies per patient. These promising strategies require more intensive colonoscopy surveillance than the guideline which may comply with the current clinical practice, i.e., a recent survey reported that post-treatment CRC patients may undergo around 24–76% more surveillance colonoscopies than recommended by the guideline23.
These promising alternative strategies are composed of dynamic strategies ((1,2,3), (1,2,4), (1,2,5)) which decrease surveillance intensity after a negative colonoscopy and biennial/partially-biennial strategies ((2,2,2), (2,2,3), (2,2,4)). Both dynamic and biennial/partially-biennial strategies require more intensive surveillance in the first 6–8-years than the guideline which is reasonable because several studies report most MCRC incidents within 5 years after the initial treatment5,7. The good performance of biennial/partially-biennial surveillance might be also consistent with the literature reporting significant number of MCRCs detected within the first 2–3 years after CRC treatment24,25. Clinicians may prefer the dynamic strategies because: 1) number of additional colonoscopies for them varies significantly less than the periodic-biennial strategies among different scenarios, 2) surveillance in the first year may aid in diagnosing local CRC recurrences and synchronous lesions that our analysis does not consider assuming perfect CRC treatment.
The cost-effectiveness of US guideline [(1,3,5)] compared to the less-intensive British and Canadian guidelines ((5,5,5) and (1,5,5)) implies that follow-up in the first five years after the CRC treatment has additional benefits. However, the US guideline may not be cost-effective compared to the (3,5,5) when cumulative MCRC incidence is 1.7%–5.5% implying that the additional benefits of colonoscopy in the first year may be limited in such cases. However, based on our results, following an appropriate promising strategy may still remain cost-effective compared to these less-intensive guidelines unless the cumulative MCRC incidence is very low.
Our study has several limitations. First, the MCRC-NH model was built using a modest-sized database of local post-treatment CRC patients from Mayo Clinic, Rochester. Although focusing on local patients partially justifies the assumptions of no missing data and 100% compliance to colonoscopy surveillance, this limitation has several adverse implications: i) We had to enforce the polyp-to-MCRC sequence with limited polyp or cancer stages. ii) Our patient cohort largely consisted of whites. iii) Due to limited data size and lack of appropriate benchmark studies, we could not cross-validate our model with clinical data. In order to minimize the effect of these limitations on the generalizability of our results, we conducted an extensive sensitivity analysis on cumulative MCRC incidence to analyze the performance of surveillance strategies under aggressive, mild, and slow MCRC progression. At the end, we highlighted only the promising surveillance strategies that performed well in all cumulative MCRC incidence scenarios. Therefore, we conclude that eliminating this limitation is not likely to significantly change the trends we observed about the promising strategies. We left analyzing the effect of alternative MCRC progression paths for future research.
Second, we assumed perfect compliance to colonoscopy surveillance in our cost-effectiveness analysis. Although compliance to colonoscopy surveillance is high (e.g., up to 94% and 80% for a 3- and 5-year follow-up period, respectively)23, certain patient characteristics including ethnicity and comorbidities are reported to be associated with low compliance26,27. Therefore, we conducted additional sensitivity analysis considering scenarios with 60–80% compliance levels which may slightly decrease with surveillance intensity (See Supplementary-Materials IX). This sensitivity analysis showed that the promising strategies are likely to remain cost-effective under imperfect compliance unless cumulative MCRC incidence is very low. However, the high ICER values for the low compliance and very low MCRC incidence (1.7%) scenario suggest the need for further investigation of the effectiveness of the promising strategies especially among populations with low compliance.
Third, we derived the colonoscopy characteristics and costs using the primary CRC literature. These parameters may vary for post-treatment CRC patients; therefore, we conducted intensive sensitivity analyses showing robustness of our results. We also assumed that colonoscopies are performed with excellent/good bowel preparation and completed to the cecum (i.e., no repeated colonoscopy due to inadequate practice). This assumption is reasonable given the high standards of colonoscopy practice in Mayo Clinic, Rochester, where our data is collected from. Fourth, the effects of local CRC recurrences and synchronous adenomas are not considered in our evaluation of alternative strategies. However, we discuss how they may affect the choice of the best alternative strategy above. We also did not consider CRC surveillance methods for detection of distant/metastatic recurrences (e.g., carcinoembryonic antigen test) because the primary function of colonoscopy surveillance is to detect metachronous neoplasms due to low rate of anastomotic/intraluminal CRC recurrences3. Finally, our analysis relies on LYs rather than quality-adjusted life years (QALYs). We evaluated the alternative strategies under the QALY metric and results are available in Supplementary-Materials VI. We excluded these results because the trends in ICER values and the composition of the set of Pareto-efficient strategies in LYs- and QALYs-based analysis are generally similar.
Due to these limitations, the generalizability of our results should be viewed with caution. The following conclusions should be noted: 1) the current US colonoscopy surveillance guideline may not necessarily be the best practice; 2) more intensive surveillance within the first 6–8 years, e.g., reducing the US guideline’s surveillance intervals by 1–2 years after the second negative surveillance colonoscopy, may improve health-outcomes while moderately increasing costs. 3) The set of Pareto-efficient alternative strategies varies based on the aggressiveness of MCRC progression; therefore, more research is needed to determine MCRC risk-factors and model MCRC progression accordingly for deriving more risk-stratified colonoscopy surveillance strategies as advocated in the literature28,29.
Our results show that the most cost-effective alternative strategy (e.g., the one with the highest health-outcome improvements and ICER closest to $50,000/LY) depends on the cumulative MCRC incidence. Therefore, we can theoretically identify the most-cost effective strategy as the one with the best health-outcomes among the strategies with ICER<$50,000/LY for all MCRC incidence scenarios, i.e., one of the promising alternative strategies. However, we refrain from identifying such a strategy in this paper due to the limitations listed above. We rather promote the potential of these promising alternative strategies and recommend more research investigating their true benefits in mitigating MCRC incidence.
Supplementary Material
Acknowledgments
FUNDING SOURCES: This research was partially supported by the NSERC of Canada [Discovery Grant 113788], NSF [Grant CMMI-0844423], and the CTSA program of NIH/NCRR [Grant 2UL1TR000427].
Footnotes
CONFLICT OF INTEREST DISCLOSURES: R.B. is an employee of Astellas Pharmaceuticals. F.S.E, O.A., A.S., and R.C declare no conflict of interest.
Author Contributions: FATIH SAFA ERENAY: Conceptualization, methodology, software, validation, formal analysis, investigation, writing – original draft, writing – review and editing, visualization, supervision, project administration, and funding acquisition. OGUZHAN ALAGOZ: Conceptualization, methodology, writing – review and editing, supervision, project administration, and funding acquisition. RITESH BANERJEE: Conceptualization, methodology, investigation, and writing – review and editing. ADNAN SAID: Conceptualization, writing – review and editing, visualization, and supervision. ROBERT CIMA: Validation, investigation, and writing – review and editing.
This cumulative incidence range may seem high compared to the MCRC incidence rates reported in some guidelines and studies as those rates may be defined over a shorter follow-up period (e.g., 2–5-year).
References
- 1.SEER. Surveillance Epidemiology and End Results. Bethesda, MD: National Cancer Institute; 2014. [Google Scholar]
- 2.Desch CE, Benson AB, Somerfield MR, et al. Colorectal cancer surveillance: 2005 update of an American Society of Clinical Oncology practice guideline. J Clin Oncol. 2005;23:8512–8519. doi: 10.1200/JCO.2005.04.0063. [DOI] [PubMed] [Google Scholar]
- 3.Rex DK, Kahi CJ, Levin B, et al. Guidelines for colonoscopy surveillance after cancer resection: A consensus update by the American Cancer Society and the US Multi-Society Task Force on colorectal cancer. Gastroenterology. 2006;130:1865–1871. doi: 10.1053/j.gastro.2006.03.013. [DOI] [PubMed] [Google Scholar]
- 4.Cairns SR, Scholefield JH, Steele RJ, et al. Guidelines for colorectal cancer screening and surveillance in moderate and high risk groups (update from 2002) Gut. 2010;59:666–689. doi: 10.1136/gut.2009.179804. [DOI] [PubMed] [Google Scholar]
- 5.Bouvier AM, Latournerie M, Jooste V, Lepage C, Cottet V, Faivre J. The lifelong risk of metachronous colorectal cancer justifies long-term colonoscopic follow-up. Eur J Cancer. 2008;44:522–527. doi: 10.1016/j.ejca.2008.01.007. [DOI] [PubMed] [Google Scholar]
- 6.Pfister DG, Benson AB, 3rd, Somerfield MR. Clinical practice. Surveillance strategies after curative treatment of colorectal cancer. N Engl J Med. 2004;350:2375–2382. doi: 10.1056/NEJMcp010529. [DOI] [PubMed] [Google Scholar]
- 7.Fajobi O, Yiu CY, Sen-Gupta SB, Boulos PB. Metachronous colorectal cancers. Br J Surg. 1998;85:897–901. doi: 10.1046/j.1365-2168.1998.00800.x. [DOI] [PubMed] [Google Scholar]
- 8.Newton K, Green K, Walsh S, Lalloo F, Hill J, Evans D. Metachronous colorectal cancer risk in patients with a moderate family history. Colorectal Dis. 2013;15:309–316. doi: 10.1111/codi.12005. [DOI] [PubMed] [Google Scholar]
- 9.Hollington P, Tiong L, Young G. Timing and detection of metachronous colorectal cancer. ANZ J Surg. 2011;81:272–274. doi: 10.1111/j.1445-2197.2010.05574.x. [DOI] [PubMed] [Google Scholar]
- 10.Frazier AL, Colditz GA, Fuchs CS, Kuntz KM. Cost-effectiveness of screening for colorectal cancer in the general population. JAMA. 2000;284:1954–1961. doi: 10.1001/jama.284.15.1954. [DOI] [PubMed] [Google Scholar]
- 11.Ramsey SD, Wilschut J, Boer R, van-Ballegooijen M. A decision-analytic evaluation of the cost-effectiveness of family history based colorectal cancer screening programs. Am J Gastroenterol. 2010;105:1861–1869. doi: 10.1038/ajg.2010.185. [DOI] [PubMed] [Google Scholar]
- 12.Lansdorp-Vogelaar I, van-Ballegooijen M, Zauber AG, Boer R, Wilschut J, Habbema JDF. At what costs will screening with CT colonography be competitive? A cost-effectiveness approach. Int J Cancer. 2009;124:1161–1168. doi: 10.1002/ijc.24025. [DOI] [PMC free article] [PubMed] [Google Scholar]
- 13.Vijan S, Hwang I, Inadomi J, et al. The cost-effectiveness of CT colonography in screening for colorectal neoplasia. Am J Gastroenterol. 2007;102:380–390. doi: 10.1111/j.1572-0241.2006.00970.x. [DOI] [PMC free article] [PubMed] [Google Scholar]
- 14.Hassan C, Pickhardt P, Zullo A, et al. Cost-effectiveness of early colonoscopy surveillance after cancer resection. Dig Liver Dis. 2009;41:881–885. doi: 10.1016/j.dld.2009.03.016. [DOI] [PubMed] [Google Scholar]
- 15.Park SM, Kim S-Y, Earle CC, Jeong S-Y, Yun YH. What is the most cost-effective strategy to screen for second primary colorectal cancers in male cancer survivors in Korea? World J Gastroenterol. 2009;15:3153. doi: 10.3748/wjg.15.3153. [DOI] [PMC free article] [PubMed] [Google Scholar]
- 16.Erenay FS, Alagoz O, Banerjee R, Cima RR. Estimating the unknown parameters of the natural history of metachronous colorectal cancer using discrete-event simulation. Med Decis Making. 2011;31:611–624. doi: 10.1177/0272989X10391809. [DOI] [PMC free article] [PubMed] [Google Scholar]
- 17.CENSUS. Population Estimates: US Census Bureau. 2014 [Google Scholar]
- 18.Levin TR, Zhao W, Conell C, et al. Complications of colonoscopy in an integrated health care delivery system. Ann Intern Med. 2006;145:880–886. doi: 10.7326/0003-4819-145-12-200612190-00004. [DOI] [PubMed] [Google Scholar]
- 19.Gatto NM, Frucht H, Sundararajan V, Jacobson JS, Grann VR, Neugut AI. Risk of perforation after colonoscopy and sigmoidoscopy: a population-based study. J Natl Cancer Inst. 2003;95:230–236. doi: 10.1093/jnci/95.3.230. [DOI] [PubMed] [Google Scholar]
- 20.BLS. Consumer price index-All urban consumers US Bureau of Labor Statistics. 2014 [Google Scholar]
- 21.Severens JL, Milne RJ. Discounting health outcomes in economic evaluation: The ongoing debate. Value Health. 2004;7:397–401. doi: 10.1111/j.1524-4733.2004.74002.x. [DOI] [PubMed] [Google Scholar]
- 22.Meyerhardt JA, Mangu PB, Flynn PJ, et al. Follow-up care, surveillance protocol, and secondary prevention measures for survivors of colorectal cancer: American Society of Clinical Oncology clinical practice guideline endorsement. J Clin Oncol. 2013;31:4465–4470. doi: 10.1200/JCO.2013.50.7442. [DOI] [PubMed] [Google Scholar]
- 23.Carpentier MY, Vernon SW, Bartholomew LK, Murphy CC, Bluethmann SM. Receipt of recommended surveillance among colorectal cancer survivors: a systematic review. J Cancer Surviv. 2013;7:464–483. doi: 10.1007/s11764-013-0290-x. [DOI] [PMC free article] [PubMed] [Google Scholar]
- 24.Couch D, Bullen N, Ward-Booth S, Adams C. What interval between colorectal cancer resection and first surveillance colonoscopy? An audit of practice and yield. Colorectal Dis. 2013;15:317–322. doi: 10.1111/j.1463-1318.2012.03187.x. [DOI] [PubMed] [Google Scholar]
- 25.Chen TA, Horng JT, Lin WC. Metachronous colorectal cancer in Taiwan: analyzing 20 years of data from Taiwan Cancer Registry. Int J Clin Oncol. 2013;18:267–272. doi: 10.1007/s10147-011-0373-5. [DOI] [PubMed] [Google Scholar]
- 26.Cooper GS, Payes JD. Temporal trends in colorectal procedure use after colorectal cancer resection. Gastrointest Endosc. 2006;64:933–940. doi: 10.1016/j.gie.2006.08.024. [DOI] [PubMed] [Google Scholar]
- 27.Salz T, Weinberger M, Ayanian JZ, et al. Variation in use of surveillance colonoscopy among colorectal cancer survivors in the United States. BMC Health Serv Res. 2010;10:256. doi: 10.1186/1472-6963-10-256. [DOI] [PMC free article] [PubMed] [Google Scholar]
- 28.Erenay FS, Alagoz O, Said A. Optimizing colonoscopy screening for colorectal cancer prevention and surveillance. Manuf Serv Oper Manag. 2014;16:381–400. [Google Scholar]
- 29.Macafee DAL, Whynes DK, Scholefield JH. Risk-stratified intensive follow up for treated colorectal cancer: realistic and cost saving? Colorectal Dis. 2008;10:222–230. doi: 10.1111/j.1463-1318.2007.01297.x. [DOI] [PubMed] [Google Scholar]
- 30.Lieberman DA, Weiss DG, Bond JH, et al. Use of colonoscopy to screen asymptomatic adults for colorectal cancer. N Engl J Med. 2000;343:162–168. doi: 10.1056/NEJM200007203430301. [DOI] [PubMed] [Google Scholar]
- 31.Taplin SH, Barlow W, Urban N, et al. Stage, age, comorbidity, and direct costs of colon, prostate, and breast cancer care. JNCI-J Natl Cancer Inst. 1995;87:417–426. doi: 10.1093/jnci/87.6.417. [DOI] [PubMed] [Google Scholar]
- 32.Halpern MT, Ward EM, Pavluck AL, Schrag NM, Bian J, Chen AY. Association of insurance status and ethnicity with cancer stage at diagnosis for 12 cancer sites: a retrospective analysis. Lancet Oncol. 2008;9:222–231. doi: 10.1016/S1470-2045(08)70032-9. [DOI] [PubMed] [Google Scholar]
Associated Data
This section collects any data citations, data availability statements, or supplementary materials included in this article.