

Abstract
Quantification of protein expression in single cells promises to advance a systems-level understanding of normal development. Using a bottom-up proteomic workflow and multiplexing quantification by tandem mass tags, we recently demonstrated relative quantification between single embryonic cells (blastomeres) in the frog (Xenopus laevis) embryo. In this study, we minimize derivatization steps to enhance analytical sensitivity and use label-free quantification (LFQ) for single Xenopus cells. The technology builds on a custom-designed capillary electrophoresis microflow-electrospray ionization high-resolution mass spectrometry platform and LFQ by MaxLFQ (MaxQuant). By judiciously tailoring performance to peptide separation, ionization, and data-dependent acquisition, we demonstrate an ∼75-amol (∼11 nm) lower limit of detection and quantification for proteins in complex cell digests. The platform enabled the identification of 438 nonredundant protein groups by measuring 16 ng of protein digest, or <0.2% of the total protein contained in a blastomere in the 16-cell embryo. LFQ intensity was validated as a quantitative proxy for protein abundance. Correlation analysis was performed to compare protein quantities between the embryo and n = 3 different single D11 blastomeres, which are fated to develop into the nervous system. A total of 335 nonredundant protein groups were quantified in union between the single D11 cells spanning a 4 log-order concentration range. LFQ and correlation analysis detected expected proteomic differences between the whole embryo and blastomeres, and also found translational differences between individual D11 cells. LFQ on single cells raises exciting possibilities to study gene expression in other cells and models to help better understand cell processes on a systems biology level.
A key mission of systems cell biology is to reveal the suite of gene expression differences between cells in biological systems (1, 2), particularly at the level of proteins that perform critical cellular functions. From large amounts, usually milligrams of proteins, contemporary liquid chromatography (LC) with high-resolution mass spectrometry (HRMS)1 is able to characterize the encoded proteome in deep-to-complete coverage and elucidate post-translational modifications (PTMs) (3–6). Multiplexing quantification with new strategies that overcome spectral interferences (e.g. multinotch MS3 analysis (6)) provide new molecular insights into cell development. For example, passive retention has been identified as the mechanism responsible for maintaining the nuclear and cytoplasmic proteomes in the oocyte using the South African clawed frog (Xenopus laevis) (7), a powerful model in cell and developmental biology. Most recently, quantification of 10,000 proteins and 28,000 transcripts revealed molecular dynamics in previously unknown details during Xenopus embryonic development (8). Further developments in HRMS sensitivity are expected to also raise a capability to study dynamic molecular changes at the level of individual embryonic cells (blastomeres) to help decipher the spatiotemporal evolution of cell heterogeneity during normal development of the vertebrate embryo.
Multiple analytical solutions extended HRMS sensitivity to single cells; see literature reviews elsewhere, including references (9–14). Microprobe sampling, matrix-assisted laser desorption ionization (13, 15, 16), or LC-HRMS (17) have measured peptides and proteins in a discovery (untargeted) setting in single molluscan, crustacean, frog, or mammalian oocytes (18), eggs (19), and nuclei (7). Additionally, mass cytometry was used to assay 34 targeted proteins at a high, ∼1000 cell/s, throughput during erythropoiesis (20), and this platform was recently coupled to laser-ablation to survey 32 targeted proteins between cells in the tumor environment (21). Electrophoresis is a rapidly emerging alternative technology for high-sensitivity proteomics. Electrophoretic separation affords exquisite peak capacity, is compatible with diverse types of molecules, can be hyphenated to ESI-HRMS via various interface designs, and is scalable to single cells (22–27). Using microscale chemical separation to simplify sample chemistry, capillary electrophoresis (CE), and Fourier transform MS was used to target α- and β-globulins in 5–10 human erythrocytes (28) and carbonic anhydrase (23) in lysates diluted to single cells. A microfluidic setting extended these electrophoretic studies to higher throughput, 12 erythrocytes/min (24). Continuous developments in CE separation (29, 30) and late-generation CE nano-flow ESI interfaces (31, 32) (see reviews (33, 34)) accomplished high-sensitivity detection of proteomes (35, 36) and labile PTMs, such as phosphorylation (37). These developments enabled femtogram (zeptomole) limit of detection (38) for protein digests from cell populations. For example, we recently developed metabolomic CE micro-flow electrospray ionization (μESI) HRMS platforms (26) for measuring metabolites (27, 39) and proteins (36) in single Xenopus blastomeres. Using microdissection to isolate single blastomeres, tandem mass tags to enable multiplexing quantification, and bottom-up proteomics, CE-μESI-HRMS was able to quantify 130–150 different protein groups (isoforms) in common between multiple single blastomeres in the 16-cell Xenopus embryo. The resulting data uncovered proteomic cell heterogeneity between blastomere types that give rise to nervous tissue, skin, and hindgut of the frog (36).
Here we develop label-free quantification (LFQ) for single Xenopus blastomeres to ask whether translational differences are also quantifiable between blastomeres within the same cell type. We proposed that minimization of sample preparation steps that are prone to protein/peptide losses fosters higher sensitivity to enable LFQ (40) on single cells, albeit at the expense of lower sample throughput without multiplexing. To test this hypothesis, we adopted LFQ to our proteomic CE-μESI-HRMS platform using MaxLFQ. After validation of this approach, ∼112 different protein groups were quantified between mid-line dorsal-animal cells (D11) in the 16-cell Xenopus embryo, which are precursors of nervous tissue (brain, spinal cord, and retina) (41). The resulting data suggest comparable expression for the majority of proteins and highly variable expression for 25 different protein groups between the D11 cells. Quantification of cell-to-cell differences within the same cell type demonstrates that proteomic HRMS is sensitive enough to facilitate new types of questions in basic and translational research.
EXPERIMENTAL PROCEDURES
Materials and Reagents
Chemicals, solvents, and TPCK-modified trypsin were obtained in reagent grade or higher purity from Fisher Scientific (Pittsburg, PA). Standard peptide methionine enkephalin (Met-Enk) was from Sigma Aldrich (St. Louis, MO). Samples were dissolved in LC-MS grade methanol, acetonitrile, water, or formic acid from Fisher. Bare fused silica capillaries (40/110 μm inner/outer diameter) were from Polymicro Technologies (Phoenix, AZ) and used as received.
Solutions
Steinberg's media (100 and 50%) was prepared as in references (27, 36). For CE separation, the background electrolyte (BGE) composed of 25% (v/v) acetonitrile containing 1 m formic acid in MS-grade water, which measured pH 2.3. The electrospray sheath liquid contained 50% (v/v) methanol and 0.1% (v/v) formic acid in MS-grade water, which measured pH 3.5. The lysis buffer contained 20 mm Tris-HCl (pH 7.5), 150 mm NaCl, 5 mm EDTA, and 1% sodium dodecyl sulfate.
Animals and Blastomere Isolation
Adult male and female frogs (Xenopus laevis) were obtained from Nasco (Fort Atkinson, WI) and maintained in a breeding colony. Protocols regarding the maintenance and handling of Xenopus were approved by the George Washington University Institutional Animal Care and Use Committee (IACUC no. A311). Embryos were obtained by in vitro fertilization and dejellied using a 2% cysteine solution following standard protocols (42). Embryos were raised in a Petri dish containing 100% Steinberg's media, and their development was monitored using a stereomicroscope. Upon reaching the 16-cell stage, single embryos were collected and transferred in a centrifuge tube for further processing. To isolate single blastomeres, embryos were collected on the same day from the same wild-type parents, i.e. the same genetic background, to reduce variability and were transferred into an agarose-coated Petri dish containing 50% Steinberg's solution at room temperature. Blastomeres were identified based on pigmentation and reference to established cell fate maps (41) and dissected via an earlier protocol (42). Each isolated single blastomere was immediately transferred into a separate 0.6 ml centrifuge tube for further processing. A total of n = 3 biological replicates were collected for the whole-embryo (different embryos processed) and single-cell (D11 cell types isolated from different embryos) measurements in this study.
Proteomic Sample Workup
To process the embryos and single blastomeres, standard bottom-up proteomic workflows (43) were downscaled to the total protein content of the sample as determined by standard BCA assay (Thermo). The specimens were lysed in the lysis buffer, facilitated by ultrasonic agitation. Proteins were reduced using dithiothreitol (25 mm final), carbamidomethylated using iodoacetamide (50 mm final), and precipitated in chilled acetone (−20 °C) over ∼12 h. The precipitate was separated by centrifugation at 10,000 × g for 10 min at 4 °C, the supernatant was discarded, and the protein pellet was washed once for single cell lysates and three times for whole embryo lysates with chilled acetone (−20 °C). The proteins were suspended in 50 mm ammonium bicarbonate and digested using trypsin at ∼1:50 protein/enzyme ratio with overnight incubation at 37 °C.
CE-ESI-MS2 Measurement
The tryptic digests (sample) resulting from each embryo and cell were measured in a custom-built CE-ESI platform that we previously described in detail (36). In this work, 1 μl of the digest was deposited into a sample-loading microvial, whence ∼7–16 nL of material was injected into a separation fused silica capillary (∼85 cm in length) filled with the BGE. Peptides were separated at +19 kV (inlet end of the capillary) and ionized in a custom-built co-axial sheath-flow CE-ESI interface operated in the micro-flow regime (CE-μESI) following our earlier designs (25–27, 36, 39). The sheath liquid rate was 1 μl/min. The operational parameters for the CE-ESI mass spectrometer were carefully selected to maintain the electrospray in the cone-jet spraying regime, which is most efficient for ionization (44): the flow rate and composition of the electrospray sheath liquid and the electrospray emitter-to-mass spectrometer orifice distance were controlled. The CE-μESI source was aligned on-axis with the sampling plate of the mass spectrometers to entrain peptide ions into the mass spectrometer.
To test and validate LFQ, peptide ions from whole-embryo lysates were detected using a high-resolution quadrupole orthogonal acceleration time-of-flight (Qq-TOF) mass spectrometer (Impact HD; Bruker Daltonics, Billerica, MA) via data-dependent acquisition (DDA). The mass spectrometer was tuned, operated at 40,000 full width at half maximum (FWHM) resolution, and externally mass-calibrated over the m/z 250–3000 range as instructed by the vendor. Experimental settings included: CE-ESI source potential, 0 V (earth ground); CE-ESI-to-orifice distance, 1 mm; orifice plate potential, −1700 V; survey scan (MS1) data acquisition rate, 2, 4, 8, or 12 Hz; collision-induced dissociation in nitrogen collision gas at 20–35 eV collision energy depending on m/z value and charge state. The tandem MS settings were: 4 Hz for signals lower than 3.2 × 10³ counts and 15 Hz for signals above 105 counts per 1000 summations.
For deeper proteomic coverage, the single-cell and whole-embryo digests were analyzed also using a quadrupole orbitrap linear ion trap (q-OT-LIT) tribrid mass analyzer (Fusion; Thermo Scientific). Conditions of sample injection and peptide separation were identical to the qQ-TOF experiments. In this setup, the CE-μESI emitter was positioned ∼5 mm from the orifice of the sampling cone and operated at +2,900 V spray voltage (against earth ground). Peptide ions were identified via data-dependent HRMS2. Survey scans were recorded every 3 s (cycle time) between m/z 350–1600 at ∼60,000 FWHM resolution in the Orbitrap analyzer with 100 ms maximum injection time, automatic gain control (AGC) set to 5 × 10⁵ counts (C-trap), and 1 microscan. During tandem MS experiments, the least intense ions with MS2 high-pass threshold of 103 ion counts were isolated at top speed in the quadrupole with 0.8 Da isolation window and routed for fragmentation via higher-energy collisional dissociation in the multipole cell at 30% normalized collision energy in nitrogen collision gas. The fragments were detected in the ion trap with “rapid” scan rate, 50 ms maximum injection time, AGC set to 1 × 10⁴ counts, and 1 microscan. Fragmented ions were dynamically excluded for 15 s. Ions of any charge state (including undetermined) were allowed for fragmentation in both mass spectrometers.
Experimental Design
The CE-μESI-HRMS system was evaluated for performance based on 3–4 technical replicate analyses (same digest analyzed multiple times). CE-μESI-HRMS was validated for LFQ using the Qq-TOF mass spectrometer. Cell-to-cell and cell-to-embryo differences are reported based on measurements in the q-OT-LIT mass spectrometer. To account for innate biological variability, D11 blastomeres were collected in n = 3 biological replicates, each from a different 16-cell embryo. Each whole embryo and blastomere was measured in a randomized order. This study utilized two different mass spectrometers (Qq-TOF and q-OT-LIT) to demonstrate the broad applicability of CE-μESI-HRMS for protein analysis in single blastomeres.
Statistical Data and Network Analysis
The MS proteomics data have been deposited to the ProteomeExchange Consortium via the PRIDE (45) partner repository with the data set identifier “PXD004174.” For proteins that were identified based on a single peptide, tandem mass spectra are provided in the SI. To find molecular features (unique m/z versus migration time domains), peptide signals were semi-manually profiled using a custom-written script (26) in Compass DataAnalysis 4.2 (Bruker Daltonics). Primary (raw) data were searched using MaxQuant v1.5.2.8 (46) software executing the Andromeda search engine (47) against Xenopus laevis NCBI (48) database (downloaded from Xenbase.org (49, 50) on August 19th 2015, containing 34,176 protein entries). The search parameters were: fixed modification, carbamidomethylation; variable modification, methionine oxidation and/or protein N-term acetylation; minimum peptide length, 7 amino acids; search for common contaminants, enabled. The Qq-TOF data were processed according to a protocol established elsewhere (51) using the settings: initial mass deviation for precursor ions, 70 mDa; main search for precursor ions (recalibrated), 6 mDa; fragmentation mass tolerance, <10 ppm. The q-OT-LIT data were processed using the settings: mass deviation for the main search of precursor masses, <4.5 ppm; de novo mass tolerance for tandem mass spectra, <0.25 Da. A p value of less than 0.05 (Student's t test) was chosen to indicate statistical significance. Errors were calculated as standard error of the mean (S.E.M.). Peptide and protein identifications were filtered at <1% false discovery rate (FDR) against a reversed-sequence database. Common contaminants were manually curated and excluded from the list of protein identifications reported here. Protein isoforms were grouped based on parsimony principle in MaxQuant and are reported as protein groups. Protein interaction networks were generated using Search Tool for the Retrieval of Interacting Genes/Proteins (STRING) ver. 10 (52) with a medium confidence score of 0.4 and K-means clustering at level 3.
RESULTS
Approach and Technology
The goal of this study was to compare protein production between single blastomeres of identical cell fate. Our analytical strategy (Fig. 1) builds on a volume-limited CE-ESI system that we recently developed for detecting proteins with ∼25–60 amol sensitivity in single Xenopus blastomeres (36). Using multiplexing quantification to enhance peptide abundance via tandem mass tags (TMTs), CE-ESI-HRMS was able to quantify ∼130–150 different protein groups in common between different blastomere types in the 16-cell Xenopus laevis embryo. Herein we proposed that simplification of sample-handling steps prone to protein/peptide losses will enhance sensitivity to enable the quantification of single blastomeres in a label-free manner. To test this hypothesis, we eliminated peptide derivatization by TMTs and adopted label-free quantification (LFQ) by a recent approach in MaxQuant, termed MaxLFQ (40). MaxLFQ approximates protein abundance with higher signal-to-noise ratio (S/N) and quantitative accuracy for low-intensity signals by using extracted ion currents (XICs) from MS1 events, which can be acquired at a higher duty cycle and broader m/z range than discreet MS/MS events (e.g. during spectral counting) (40). These aspects raised benefits for low-abundance peptide signals anticipated in single-cell digests in this work. The current approach, shown in Fig. 1, begins with the preparation of protein digests from single blastomeres followed by CE-μESI-HRMS analysis via DDA. Protein quantification is enhanced by balancing the duty cycle of MS/MS events underlying peptide identification and survey scans (MS1 events) underpinning quantification.
Fig. 1.
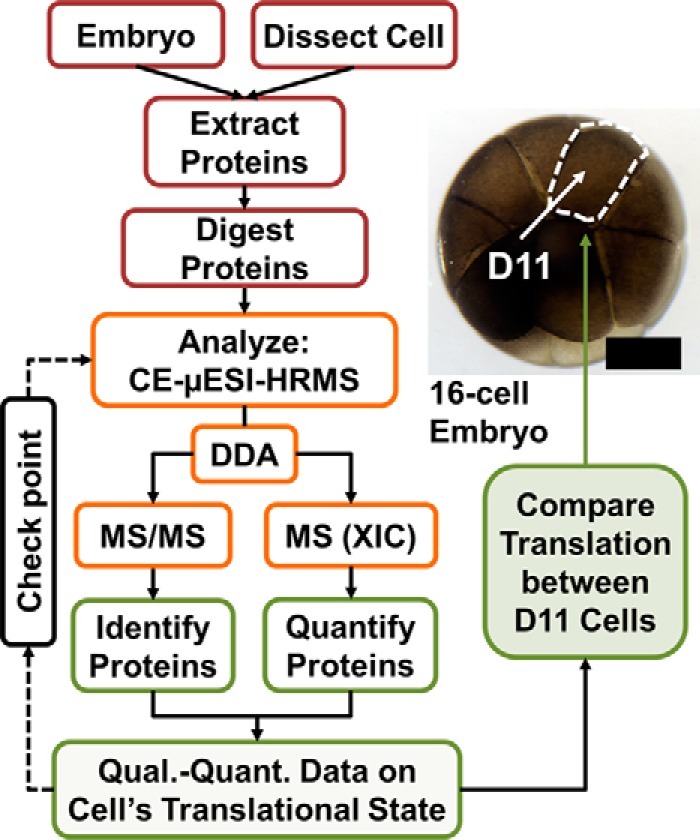
Flowchart for enabling label-free quantification (LFQ) on limited amounts of tissues and single embryonic cells in the 16-cell frog Xenopus laevis embryo. Check-points serve as feed-back mechanism to aid LFQ sensitivity. LFQ was performed to quantify protein expression between n = 3 midline dorsal-animal (D11) blastomeres, which reproducibly give rise to the nervous system (41). Scale bar = 100 μm.
Method development and validation were performed using the 16-cell Xenopus embryo, in which blastomeres are large enough (∼250 μm in spherical diameter) to aid manual cell identification and isolation. For example, the midline dorsal-animal blastomere (D11) is readily located in the embryo based on pigmentation and position along the dorsal-ventral axes (Fig. 1). Using established cell biological tools and protocols (42), we can reproducibly identify and dissect single D11 blastomeres from the embryo, which are fated to give rise to the nervous tissue (41). Blastomeres in the 16-cell embryo contain an appreciable amount, ∼10 μg, of total protein (36), which aided sensitivity refinement during the instrument development portion of this work. However, ∼90% of this protein content is dominated by yolk (vitellogenins) (53), essentially leaving only ∼1 μg of yolk-free proteins from each D11 cell. The abundance of yolk proteins in these blastomeres may beneficially minimize adsorptive losses to low-abundance proteins during sample preparation. Although this starting protein amount is already ∼100–1000-times less than typically assessed in bottom-up proteomics, we analyzed only a portion, ∼1–30 ng proteins, or 0.01–0.3% of the total protein content of the blastomeres to make advances toward measuring the protein content of larger single mammalian cells.
In preparation for bottom-up protein detection, we established trace-level peptide separation and detection using HRMS (Qq-TOF). CE was carried out in bare (unmodified) fused silica capillaries filled with BGE at pH 2.3, selected to suppress nonspecific peptide adsorption on the capillary walls by minimizing the ionization of the surface silanol groups. Enhanced Joule heating and electrolysis because of higher conductivity at lower pH were minimized by addition of organic modifiers to the BGE; 25% acetonitrile containing 1 m formic acid provided optimal performance and was used throughout this study. Furthermore, we performed on-column field-amplified sample stacking to enhance the S/N by suspending protein digests in 50% acetonitrile containing 0.05% acetic acid (versus higher conductivity of the BGE). The CE-ESI-HRMS platform was tested quantitative for peptides. The under-the-curve peak area was linear over a 3 log-order tested concentration range for Met-Enk (Fig. 2A). A 45-nm solution produced S/N = ∼12, which extrapolates to ∼11-nm or 75-amol lower limit of detection for this peptide (S/N = 3), where S/N was defined as the ratio between peak height of the signal and the root-mean-square of the noise (see Fig. 2A inset).
Fig. 2.

Trace-level separation and quantification of peptides using CE-μESI-HRMS. A, Quantification was demonstrated across a 3 log-order dynamic range with a ∼75-amol estimated lower limit of detection for Met-Enk. B, The base-peak electropherogram for a 20 ng digest of a 16-cell Xenopus embryo demonstrated complex molecular composition. The extracted-ion currents monitor 9 different peptides (mers) with ± 50-mDa window that were identified from vitellogenin b1 (vtgb1), an abundant, native protein in the embryo (see peptide sequences in supplemental Table S1A. C, Peptide detection was quantitative also in this complex matrix, as exemplified for the vtgb110-mer2+, vtgb113-mer2+, and vtgb128-mer4+ signals. Error bars show S.E.M. in all panels. Parameters of linear regression (intercept/slope/R2): 4.52/1.07/0.99 for Met-Enk; 4.94/0.815/0.98 for vtgb110-mer2+; 5.07/0.730/0.99 for vtgb113-mer2+; and 4.33/0.861/0.96 for vtgb128-mer4+.
Peptide separation and quantification was robust in complex Xenopus protein digests. A ∼20 ng digest from a 16-cell embryo yielded a rich base-peak electropherogram (Fig. 2B), demonstrating appreciable molecular complexity detectable despite this limited amount of protein digest. As efficient peptide separation is central to LFQ, we refined the peak capacity of CE-μESI-HRMS by tailoring the BGE composition and the CE separation potential for peptides from vitellogenin b1 (see supplemental Table S1A). These peptides were separated during a 20-min window with theoretical plate numbers between ∼130,000–370,000 (see Fig. 2B and supplemental Table S2), comparing favorably to traditional nanoLC. Peptide detection was quantitative also in this complex sample, as demonstrated for the 10-, 13-, and 28-mer peptide ions from Vtgb1 for a 2 log-order tested concentration range (Fig. 2C). The digitizer of the mass spectrometer is expected to extend this range to 4–5 log orders of magnitude. Additionally, the reproducibility of peptide separation was tested across multiple days. The Pearson cross-correlation coefficient calculated for ∼230 randomly selected peptides was 0.99 across 7 days (supplemental Fig. S1). Combined, these results established sensitive, quantitative, and robust peptide detection with compatibility to limited sample amounts, setting the stage for LFQ for single Xenopus blastomeres.
LFQ in Single Blastomeres
Next, we designed a set of studies to extend LFQ to an increasing number of proteins in single blastomeres. The strategy was twofold. On one hand, we aimed at enhancing peptide sequencing by increasing the success rate of MS/MS events that lead to peptide identifications. On the other hand, improvements in quantification required increasing the MS1 duty cycle for recording XICs, which serve as the basis of quantification in MaxLFQ (40). Enhancing peptide charging by supercharging agents (54, 55), such as dimethyl sulfoxide (10%) and sulfulane (100 mm), was one possibility to aid peptide identifications. However, modification to the electrospray sheath liquid compromised the stability of the Taylor cone, which in turn sacrificed protein identifications (supplemental Table S3).
Data-dependent MS/MS was configured to electrophoretic separation (Fig. 3); salient parameters included the rate of MS/MS and full-MS events as well as the lower S/N threshold to trigger fragmentation. Consecutive peptides migrated through the capillary with at least ∼0.256 s difference (Fig. 3A), suggesting that a 4 Hz survey (full-MS or MS1) scan rate was sufficient to recognize peptides. Indeed, faster survey scans lowered the cumulative success of protein identification (supplemental Table S3) because of lower S/N ratios resulting with less spectral averaging (data not shown). The distribution of peptide ion signal intensities was estimated normal in the low signal abundance range (Fig. 3A), whereas the higher-intensity domain (> ∼5 × 10⁴ counts) tailed because of abundant peptides from vitellogenins and structural proteins. To help identify lower-abundance signals, the MS/MS threshold was lowered (500 counts), even though this was also anticipated to cause the fragmentation of nonpeptide signals, such as common contaminants in ESI, at the cost of MS1 events (for quantification). To counterbalance the duty cycle, MS/MS spectra were collected faster, at 15 Hz, for high-abundance signals (>5 × 10⁴ counts) as they were likely to provide higher-quality fragmentation. For low-abundance signals (<5 × 10³ counts), which were expected to fragment with lower S/N, the MS/MS rate was dynamically adjusted to 4 Hz to boost S/N via spectral averaging. With rapidly increasing peptide identification during the peptide migration window (∼20–50 min), particularly during the section early when more highly charged and smaller peptides (3+ and 4+) eluted (see Fig. 3B), this two-pronged DDA strategy enabled the identification of 74 different protein groups in 16 ng of the embryo digest using the qQ-TOF system (see proteins listed in supplemental Table S1B).
Fig. 3.

Sequencing trace-level peptides by CE-HRMS using Qq time-of-flight HRMS. A, Data-dependent tandem MS was tailored to closely migrating (top panel) and low-abundance peptide signals (bottom panel). Key: Δ, separation time difference between consecutively migrating peptides. B, Rate of fragmented molecular features (data in open circles) and identified peptides (data in filled circles) revealing compact separation and electrophoretic migration trends in the mass versus migration time versus charge state domain. Identified proteins are listed in supplemental Table S1B.
To validate CE-μESI-HRMS for LFQ, progressively smaller amounts of protein digests were measured on the qQ-TOF MS/MS instrument (Fig. 4A). Between 33–108 nonredundant protein groups were identified from ∼2–35 ng of protein digest, corresponding to ∼0.02–0.30% of the total protein content in the average blastomere in the 16-cell embryo, respectively. LFQ intensities were correlated with the total amount of protein digest (R2 ≥ 0.90), as shown for Vtgb1, peptidylprolyl isomerase (Ppia), and lipovitellin (Lipo 1) in Fig. 4. These results demonstrated linear quantification also at the level of proteins using CE-μESI-HRMS.
Fig. 4.

Identifying and quantifying protein groups in mass-limited specimens. A, Proteins were measured in progressively smaller amounts of digests from whole 16-cell Xenopus embryos using Qq-TOF-MS/MS (top panel). LFQ-based quantification was linear also at the level of proteins (bottom panel), as shown for Vtgb1 (R2 = 0.99), Ppia (R2 = 0.98), and Lipo 1 (R2 = 0.90). Using an orbitrap-quadrupole-linear ion trap (q-OT-LIT) instrument capable of ion trapping, higher-resolution analysis, and parallelization of MS1-MS/MS events, protein identification was enhanced fivefold. Quantified proteins are listed for the Qq-TOF in supplemental Table S1C and q-OT-LIT in supplemental Table S1D. Error bars show S.E.M. B, Gene ontology annotation of biological processes (top panel) and molecular functions (bottom panel) for proteins identified in the 16-cell embryo.
To enhance protein quantification, we coupled CE-μESI-HRMS to late-generation q-OT-LIT HRMS. This tribrid instrument design enabled ion trapping to accumulate low-abundance signals prior to MS/MS, higher-resolution mass analysis to resolve spectral interferences (60,000 FWHM used versus 40,000 FWHM by the Qq-TOF earlier), and synchronous MS and MS/MS operation to boost the overall acquisition duty cycle. As a result, protein identifications were enhanced ∼fivefold (Fig. 4A). Gene ontology annotation suggests that the identified proteins participate in catalysis, binding, and other cellular biological processes by carrying out metabolic, developmental, or regulatory mechanisms (Fig. 4B).
Comparing Protein Expression
CE-μESI-HRMS (q-OT-LIT) was applied to compare protein expression between the whole embryo and n = 3 single D11 blastomeres; a left D11 (D111) and two right D11 (D112 and D113) cells were analyzed in technical duplicate. A total of 438 different protein groups were identified in union between the cells (see Table I and proteins listed in supplemental Table S1E). Among these proteins were many known to be involved in brain or spinal cord development, major derivatives of D11 blastomeres (41). For example, chaperonin containing TCP1 subunit 3 (Cct3), creatine kinase-brain (Ckb), malate dehydrogenase 1 (Mdh1), and nucleoside diphosphate kinase 2 (Nme2), which were detected in all three biological replicates, and voltage-dependent ion channel 2 (Vdac2), which was detected in two of the three biological replicates, are known to be expressed in the brain and spinal cord structures of the embryo (49, 50). Of the 438 identified proteins, a total of 335 nonredundant protein groups were quantified in union between the three D11 blastomeres, and 62 proteins were common to all biological replicates (intercept). LFQ intensities suggested that these proteins encompassed a ∼4-log-order-magnitude of concentration range.
Table I. Identification and quantification of peptides and proteins between n = 3 (biological replicate) D11 blastomeres dissected from 16-cell Xenopus embryos using CE-μESI-HRMS (q-OT-LIT). A list of identified protein groups and their LFQ scores is provided in supplemental Table S1E (Not applicable, n/a.).
| Blastomere type | Cell ID | Identified |
Quantified protein groups |
|||
|---|---|---|---|---|---|---|
| Peptides (Average) | Proteins (Average) | Protein groups | Average/Cell | Cumulative | ||
| Left D11 | D111 | 449 ± 21 | 91 ± 1 | 138 | 82 ± 2 | 125 |
| Right D11 | D112 | 649 ± 33 | 167 ± 7 | 244 | 130 ± 28 | 181 |
| Right D11 | D113 | 704 ± 4 | 197 ± 18 | 280 | 163 ± 2 | 231 |
| Cumulative | n/a | n/a | 438 | n/a | 335 | |
The LFQ intensity values allowed us to compare the translational state between the embryo and individual D11 blastomeres (Fig. 5B). In traditional cell-averaging HRMS, protein expression data can be compared based on LFQ intensities after normalization to total protein amounts or reference (e.g. stably expressed) proteins. However, these data are not readily available for single blastomeres: the total protein amount and the size of the cells are difficult or impractical to measure, especially for aspherical and rapidly dividing blastomeres. As an alternative, we proposed a correlation, rather than protein abundance-based model, to gauge protein expression. The LFQ intensities for each quantified protein group were log-transformed and plotted between the samples. As the relative concentration between stable proteins (not expressed or not degrading) is independent of blastomere/embryo dimensions or sample amounts analyzed by CE-HRMS, the LFQ scores for these proteins are expected to follow correlation. In contrast, proteins with changing copy numbers are expected to deviate from the correlation, for example, because of biological events, such as differential gene expression, protein degradation, or sampling biases including nonspecific adsorption on surfaces (vials, pipette tips, etc.). Indeed, high Pearson correlation coefficients (ρ ∼ 0.9) calculated based on protein LFQ intensities revealed good technical reproducibility (Fig. 5A, left panel). For a systematic analysis of correlation, we computed the Euclidean distance, d, of each quantified protein from the linear regression curve (see mock sample). The resulting distances essentially served as a “proteomic ruler” with d ≈ 0 indicating stable expression and larger d values signifying variable expression (middle panel). Based on the single-cell technical replicates, a d > 0.5 was selected to mark significant dysregulation in this study. LFQ intensities were reproducible with a mean of ∼20% RSD, suggesting biological significance detectable at fold change ≥ 1.5 (right panel).
Fig. 5.

Correlation analysis for uncovering translational differences between three D11 blastomeres (D111, D112, D113) and the 16-cell embryo. Each data point represents a different protein group. A, LFQ intensities of proteins were reproducibly quantified between technical replicates (D112 shown, left panel), as indicated by high Pearson correlation coefficients (ρ) between the data sets. Prediction band with 95% confidence is shown in gray surrounding the linear fit. For any given protein (see mock protein in gray square), correlation was calculated as the Euclidean distance (d) from the linear fit. Based on the technical reproducibility, a d > 0.5 was considered to mark significant dysregulation in protein abundance (middle panel). LFQ intensities were repeatable with ∼20% relative standard deviation (RSD); therefore, a fold change of ≥1.5 was chosen to mark biological significance (right panel). B, Comparison of protein expression between the D11 cells and the whole 16-cell embryo revealing accumulation for 17 proteins in the cells and eight proteins in the average embryo (left panel). Using correlation distance and median-normalized fold change to query differentially expressed proteins (right panel). C, Correlation analysis also revealed graded translational differences between the D11 blastomeres (left panel). Categorization of protein expresion as stable and variable (see Table II) based on d values (right panel). Key: ρ = 0.72 for D111 versus embryo, 0.76 for D112 versus embryo, 0.61 for D112 versus embryo, 0.61 for D111 versus D112, 0.75 for D111 versus D113, and 0.73 for D112 versus D113. Vitellogenin proteins (LFQ intensity > ∼1 × 10⁹) were excluded from the analysis and are not shown.
The correlation model was validated based on known molecular cell heterogeneity in the 16-cell embryo. Although expression levels were correlated for the majority of proteins, a ρ < 0.76 indicated graded translational differences between D11 blastomeres (n = 3) and the embryo (see Fig. 5B, left panel). Protein ratios were normally distributed with Gaussian medians of 0.24 between D111 versus embryo, 0.52 between D112 versus embryo, and 0.85 between D113 versus embryo. We ascribe these shifts to a combination of factors, including different protein amounts contained by whole 16-cell embryos and single blastomeres, heterogeneous protein content between different types of blastomeres (36), and likely size differences between D11 blastomeres. After median-normalizing the fold change values, protein expression was readily queried using volcano plots. A d > 0.5 and fold change ≥ 1.5 was taken to screen for significant dysregulation (right panel). Compared with the whole embryo, D11 blastomeres contained higher amounts for 17 protein groups and lower amounts for eight different protein groups (Table II). For example, higher LFQ intensity for actin-b and lower for vitellogenin-a1 in the D11 blastomeres indicated an advanced level of metabolic activity compared with the average embryo. This is not unexpected considering that blastomeres on the dorsal-animal side of the embryo (i.e. D11) are known to complete mitosis/cytokinesis faster than those in the vegetal hemisphere, and vegetal cells are known to contain more yolk platelets. These protein differences also agree with known blastomere mRNA (56–58) and protein heterogeneity (36) along the animal-vegetal and dorsal-ventral axes of the embryo. Additionally, many of the proteins accumulating in D11 blastomeres (e.g. Gnb2l1, Cct3, Wyhaq) have higher expression in nervous tissue (compare with data on Xenbase (49, 50)), which is the fate of the D11 blastomeres (49, 50). Combined, these results validate the utility of LFQ to meaningfully capture expression differences between cells and the embryo, which would have been hidden during whole-embryo measurements.
Table II. Protein expression differences between D11 blastomeres vs. the 16-cell embryo and between individual D11 blastomeres. The number of sequence-specific peptides used to identify each protein is listed.
| UniProt ID | Protein name | Abbrev. | Unique peptides | Function (UniProt) |
|---|---|---|---|---|
| Blastomeres vs. Whole 16-cell Embryo | ||||
| Higher amounts in D11 | ||||
| A1L3K7 | Alpha enolase | Eno1 | 1 | Glycolysis |
| A2BDB0 | Actin, cytoplasmic 2 | Actg1 | 2 | Cell motility |
| P04751 | Actin, alpha cardiac muscle 1 | Actc1 | 2 | Cell structure |
| P17508 | Elongation factor 1-alpha, oocyte form | Eef1a | 6 | Protein synthesis |
| P18709 | Vitellogenin A2 | Vtga2 | 139 | Precursor to protein synthesis |
| P50143 | T-complex protein 1 subunit gamma | Cct3 | 4 | Protein folding, ciliogenesis |
| P52301 | GTP-binding nuclear protein | Ran | 6 | Nucleocytoplasmic transport, cell cycle control |
| Q5FWK8 | Arachidonate 12-lipoxygenase, 12R-type | Alox12b | 9 | Metal (iron) binding |
| Q5XHE0 | Transaldolase | Taldo1 | 3 | Pentose-phosphate pathway |
| Q66KY6 | 60S ribosomal protein L11 | Rpl11 | 2 | Protein translation |
| Q7ZTK0 | 60 kDa heat shock protein | Hspd1 | 4 | Protein refolding |
| Q7ZTL5 | Chaperonin containing TCP1, subunit 8 (Theta) | Cct8 | 2 | Protein folding |
| Q7ZXH6 | Tyrosine 3-monooxygenase | Ywhaq | 1 | Monooxygenase activity |
| Q8AVI3 | 60S acidic ribosomal protein P0 | Rplp0 | 4 | Protein translation |
| Q8AVP6 | Guanine nucleotide binding protein (G protein), beta polypeptide 2-like 1 | Gnb2l1 | 8 | Gastrulation, cell division, cell polarity |
| Q91375 | Elongation factor 1-gamma-B | Eef1g-b | 1 | Protein synthesis |
| Q92122 | Pyruvate kinase | Pkm | 4 | Regulation of metamorphic processes |
| Lower amounts in D11 | ||||
| P15107 | Superoxide dismutase | Sod1-b | 4 | Antioxidant |
| P17507 | Elongation factor 1-alpha, oocyte form | Eef1a-o | 6 | Protein synthesis |
| P19009 | Vitellogenin A1 | Vtga1 | 1 | Storage protein, nutrient |
| Q00387 | Serine protease inhibitor A6 | Serpina6 | 18 | Endopeptidase inhibitor |
| Q6GPT0 | Fatty acid binding protein 4 | Fabp4 | 7 | Lipid binding, transport activity |
| Q7ZYS1 | 60S ribosomal protein L19 | Rpl19 | 3 | Protein translation |
| Q8AVP8 | Peptidyl-prolyl cis-trans isomerase | Ppia | 8 | Protein folding |
| Q9PSX0 | Fructose-bisphosphate aldolase | Aldoc | 7 | Glycolysis |
| Variable Expression between D11 Blastomeres | ||||
| A0AUT4 | Chaperonin containing TCP1, subunit 5 | Cct5 | 3 | Protein folding |
| P17507 | Elongation factor 1-alpha, oocyte form | Eef1a-o | 6 | Protein synthesis |
| P18709 | Vitellogenin A2 | Vtga2 | 124 | Precursor to protein synthesis |
| P19009 | Vitellogenin A1 | Vtga1 | 1 | Precursor to protein synthesis |
| P45695 | Cofilin 1A | Cfl1a | 4 | Cell morphology, cytoskeletal organization |
| P52297 | Karyopherin (importin) beta 1 | Kpnb1 | 3 | Nuclear import |
| Q3KQ54 | 5-aminoimidazole-4-carboxamide ribonucleotide formyltransferase/IMP cyclohydrolase | Atic | 7 | Convergent extension, axis elongation, Wnt signaling |
| Q68EY5 | ATP synthase subunit alpha | Atp5a1 | 4 | ATP production, energy |
| Q6DJL4 | ATPase inhibitory factor 1 | Atpif1 | 4 | Negative regulation of ATPase activity |
| Q6GNF4 | Ribosomal protein S17 | Rps17 | 5 | Protein translation |
| Q6INS0 | Glutathione S-transferase theta 1 | Gstt1 | 5 | Transferase |
| Q6NRQ9 | Glutathione S-transferase omega 2* | Gsto2 | 4 | Glutathione transferase activity |
| Q6PB22 | Hyaluronan binding protein 4 | Habp4 | 5 | Transcription regulation, |
| Q7SYU5 | Fructose-bisphosphate aldolase | Aldoa | 3 | Glycolysis |
| Q7SZF6 | Vitellogenin B1 | Vtgb1 | 122 | Lipid transport, protein synthesis |
| Q7ZWR6 | ATP synthase subunit beta | Atp5b | 20 | ATP production, energy |
| Q7ZY52 | Glyceraldehyde-3-phosphate dehydrogenase | Gapdh | 8 | Carbohydrate degradation: Glycolysis |
| Q7ZYR1 | Ribosomal protein L3 | Rpl3 | 4 | Protein translation |
| Q7ZYS8 | Ribosomal protein L10a | Rpl10a | 3 | Protein translation |
| Q801S3 | Ribosomal protein S3a-A | Rps3a-a | 6 | Protein translation |
| Q8AVP6 | Guanine nucleotide binding protein (G protein), beta polypeptide 2-like 1 | Gnb2l1 | 8 | Gastrulation, cell division, cell polarity |
| Q8AVP8 | Peptidyl-prolyl cis-trans isomerase | Ppia | 9 | Protein folding |
| Q9DED4 | Cold-inducible RNA-binding protein B | Cirbp-b | 3 | Essential for cell movement, neural development, gastrulation |
| Q9I9M9 | Adenine nucleotide translocase* | Slc25a5 | 6 | Spinal cord motor neuron differentiation; organ development |
| Q9PSX0 | Fructose-bisphosphate aldolase | Aldoc | 7 | Glycolysis |
Last, we asked whether there are also translational differences between the individual D11 cells; a left D11 (D111), and two right D11 blastomeres (D112 and D113) were analyzed (each in technical duplicate) using CE-ESI-HRMS (q-OT-LIT). The analysis revealed good correlation for the majority of the proteins and notable dysregulation for others (see Fig. 5C, left panel). Based on the distribution of the d values, proteins were categorized as stably (95 proteins with 0 ≤ d ≤ 0.05) and variably (e.g. 25 proteins with d ≥ 0.5) expressed between the cells (right panel). Dysregulated proteins are listed in Table II. Among the most stably quantified proteins were products of many traditional “housekeeping genes,” including Eno1, Hadha, Hsp90, and Mdh1, considered to be invariantly expressed across tissues (59). Other proteins, such as Vdac2 and Cofilin-1, were also in this category. Cofilin-1 is an essential molecular player during vertebrate cytokinesis that accumulates in the cleavage furrow of diving cells (60). This supports that the D11 blastomeres were isolated in similar phases of the cell cycle from different embryos. In contrast, proteins with differential expression (see Table II) are linked to Wnt signaling, protein translation and protein folding, cell differentiation, morphology, motility, and cycle control, as well as cytoskeleton organization, and energy balance, whereas others have been implicated in the development of nervous tissues, the known fates of D11 blastomeres.
Possible functional associations were predicted between proteins in the D11 blastomeres (Fig. 6). The gene names corresponding to the proteins that were quantified between D11 blastomeres were imported into STRING 10 to predict protein-protein interactions using the Xenopus silurana reference database. With K-means filtering, subnetworks of ribosomal, mitochondrial, cell structural, and metabolic activities can be distinguished in the resulting interaction map (supplemental Fig. S2). This analysis was also repeated for the proteins that exhibited similar levels between the individual D11 blastomeres (d > 0.5 in Fig. 5C, left). Associations are apparent for proteins with similar KEGG functions (Fig. 6A). For example, those involved in metabolic and oxidative phosphorylation and the ribosome are readily recognized. Furthermore, functional interactions for the 25 most variably quantified proteins indicated associations in protein synthesis and metabolism (Fig. 6B). Many of these proteins or related transcripts are known to accumulate in the neural plate in early-stage embryos and the eye, retina, head, somites, heart, or tail-bud structures in the tadpole (see Xenbase (49, 50)). The observed translational differences between the individual D11 cells would have been lost to averaging during traditional approaches in which an ensemble of cells is measured. These results underscore the power of single-cell measurements to aid cell and developmental biological investigations.
Fig. 6.
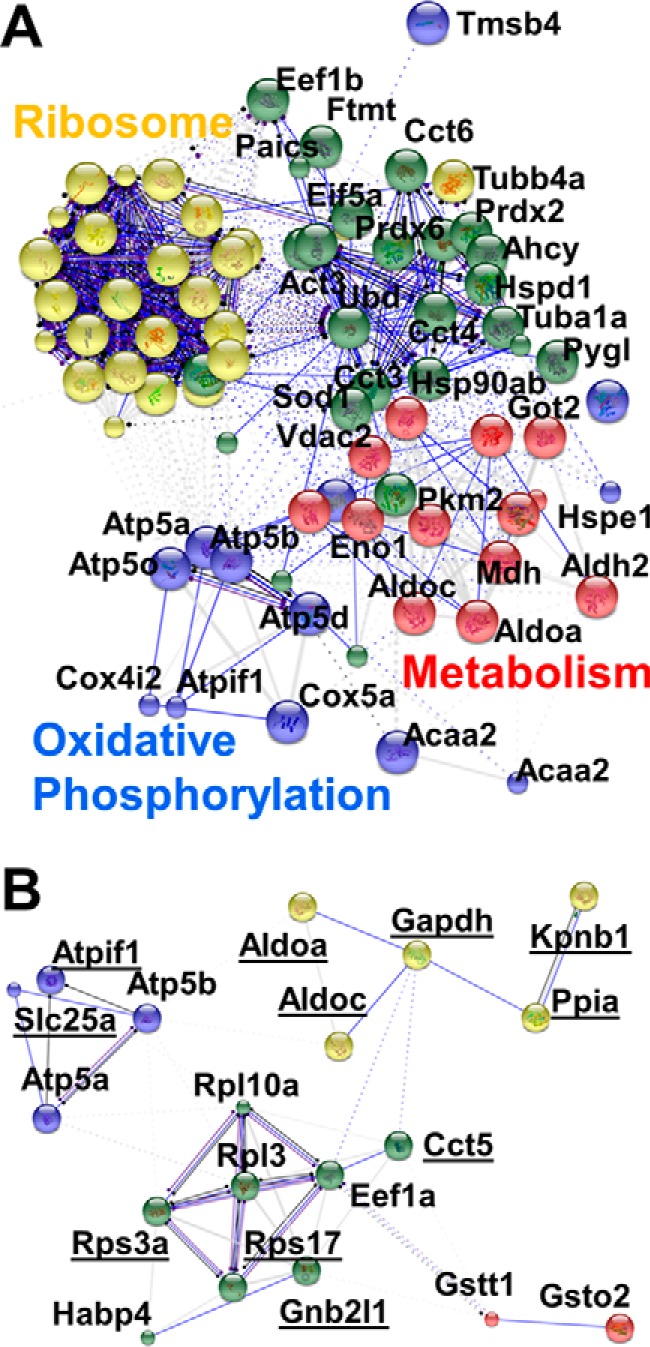
Protein interaction networks in single D11 blastomeres. Networks were predicted using STRING 10 based on proteins with (A) stable (d ≤ 0.5) and (B) variable (d > 0.5) abundance between the blastomeres. KEGG functions are labeled for proteins with associations. Among the differentially quantified proteins were many that are known to express in the neural plate, eye, head, nervous tissue, heart, or tail-bud of the embryo (see underlined proteins) (49, 50). An enlarged network is shown for stable proteins in supplemental Fig. S3. STRING parameters: actions view shown; disconnected nodes removed (Atic, Cirbp-p, and Vtga1 in panel B); k-means clustering = 3.
DISCUSSION
LFQ by CE-μESI-HRMS is sufficiently sensitive to compare protein expression between single blastomeres in the developing embryo. By simplifying sample preparation, this strategy raises benefits for measuring samples that are precious, rare, or limited in size or when sample losses are of concern. Here we extended LFQ to single blastomeres in the 16-cell Xenopus laevis embryo, a powerful model in cell and developmental biology and health research. The platform accomplished an ∼75-amol (∼11 nm) lower limit of detection and was compatible with a few tens of nanoliters (nanograms), i.e. ∼1000–10,000-times smaller amounts of samples than analyzed in typical bottom-up proteomic workflows. We found that CE separated peptides fast (∼4 Hz sequential migration time) with comparable separation efficiency than contemporary nanoLC. This corroborates with the growing body of investigations that demonstrate the utility of CE for fast and sensitive analysis of limited amounts of proteins (29, 36–38). Data-dependent acquisition was judiciously tailored to CE-based separation to maximize duty cycle between full-scan (MS1) events leading to quantification and MS/MS scans achieving peptide identification. New-generation tribrid HRMS (quadrupole-orbitrap-ion trap) rose to the challenge particularly well by boosting fragmentation success via ion trapping, resolving spectral interferences with higher mass resolution, and importantly, parallelizing MS/MS and survey scans for enhancing the acquisition duty cycle. The approach was able to identify 438 nonredundant protein groups and quantify 335 of these proteins in union between three D11 blastomeres by measuring ∼16 ng, or <0.2% of the total protein content from each cell. These results suggest that the presented single-cell analysis technology is applicable to smaller cells and other types of cells, including blastomeres, neurons, and limited tissues.
Proteomics on single cells necessitates new considerations in data evaluation. Because embryonic cells rapidly divide and change their transcriptional and translational activities (8, 57, 61), measurement of cell size or protein content is technologically difficult or impractical. This in turn hinders the normalization of LFQ intensities during the comparison of protein abundances between samples. As an alternative, we implemented correlation analysis to compare protein levels (estimated by LFQ intensities) between blastomeres. Pearson correlation and fold-change values based on the calculated LFQ intensities helped identify stably and variably expressed proteins between blastomeres and the whole embryo. These translational cell-to-cell differences complement known molecular differences between cells in the embryo at the level of transcripts (56–58), proteins (36), and also metabolites (27, 39). These outcomes provide leverage for using correlation analysis to compare gene expression between single cells.
The presented study also detected graded proteomic heterogeneity between different D11 blastomeres from three different embryos. Although protein levels were comparable for a large number of “housekeeping” and cell structural genes, a small number of proteins exhibited significant cell-to-cell variability. Independent studies by immunohistochemistry and in situ hybridization have implicated these proteins in the development of the neural plate, eye, brain, head, and somites structures of the embryo, which are the known fates of D11 blastomeres. Although addressing the origin and biological significance of the observed protein differences goes beyond the scope of this work, detection of translational heterogeneity between cells of the same “cell type” underscores the importance of single-cell measurements. High-sensitivity HRMS, such as the single-cell analysis platform presented here, supports new investigative possibilities in how spatiotemporal heterogeneity in gene expression organizes subcellular organelles (7), cells, and tissues, and the whole embryo (8, 19) during normal development and disease.
New and continuing technological advances raise exciting potentials to adopt proteomic measurements from large Xenopus blastomeres to smaller single cells, including mammalian systems. To this end, we demonstrated the detection/quantification of a considerable number of proteins from ∼20 ng protein digests from single blastomeres, approaching the total protein content of larger mammalian cells. Microscale sample preparation can help collect peptides and proteins with high sensitivity, using, for example, patch-clamp electrophysiological tools (62) and microanalysis probes (17, 63). For smaller mammalian cells containing fewer amounts of proteins, addition of carrier proteins may be beneficial to minimize adsorptive losses for low-abundance proteins. To assess proteins at trace levels, various CE approaches can help enrich molecules on-column and separate them in increased peak capacity (64). New-generation interfaces that minimize/eliminate sample dilution between CE and ESI may be used to ionize peptides more efficiently (see reviews in Ref (33, 65–67)); electrokinetically pumped sheath-flow (32, 38) and sheathless (68, 69) interfaces are promising designs in this direction. Based on recent successes in proteome coverage and post-translational analysis by CE (35, 37, 69), we expect these innovative solutions combined with new-generation mass spectrometers capable of ever-increasing sensitivity, speed, and multiplexing to further advance protein identification in the miniscule amounts of proteins afforded by single cells.
In parallel, proteomic measurements should be made faster or parallelized to empower statistics on cells and cell populations. Although we demonstrated an ability by HRMS to measure single blastomeres, the presented workflow would benefit from higher throughput. Multiplexing quantification of the proteome by, e.g. TMTs (36) and imaging HRMS (e.g. MALDI (16) and laser ablation mass cytometry (21)) deliver complementary throughput over separation-based single-cell measurements. Furthermore, lab-on-a-chip devices capable of encapsulating cells in nanoliter droplets are attractive to sort, lyse, and treat thousands-to-tens of thousands of cells (70), raising a potential to measure a sufficiently large cohort of cells that capture the cell populations' overall behavior also at the level of the proteome. We anticipate that continuous developments in cell handling, proteomic processing, and HRMS will open new doors to study systems biology at the level of the basic functional building block of life: the cell.
Supplementary Material
Acknowledgments
We thank Leonid Peshkin (Harvard Medical School, Boston, MA) for helpful discussions during the preparation of the manuscript.
Footnotes
Author contributions: P.N. and C.L-B designed the research; S.A.M. provided the Xenopus cells and commented on the manuscript; C.L-B, S.R., and P.N. analyzed the cells; P.N. and C.L-B interpreted the data and wrote the manuscript.
* This work was supported by the National Science Foundation Grant DBI-1455474 (to P.N. and S.A.M.) and the George Washington University Department of Chemistry Start-Up Funds (to P.N.) and Columbian College Facilitating Funds (to P.N. and S.A.M.). The content of the presented work was solely the responsibility of the authors and does not necessarily represent the official views of the funding agencies.
 This article contains supplemental material.
1 The abbreviations used are:
- CE
- capillary electrophoresis
- HRMS
- high-resolution mass spectrometry
- ESI
- electrospray ionization
- LC
- liquid chromatography
- LFQ
- label-free quantification
- D11
- midline dorsal-animal blastomere.
REFERENCES
- 1. Altschuler S. J., and Wu L. F. (2010) Cellular heterogeneity: Do differences make a difference? Cell 141, 559–563 [DOI] [PMC free article] [PubMed] [Google Scholar]
- 2. Singh D. K., Ku C. J., Wichaidit C., Steininger R. J., Wu L. F., and Altschuler S. J. (2010) Patterns of basal signaling heterogeneity can distinguish cellular populations with different drug sensitivities. Mol. Syst. Biol. 6, 1–10 [DOI] [PMC free article] [PubMed] [Google Scholar]
- 3. Picotti P., Clement-Ziza M., Lam H., Campbell D. S., Schmidt A., Deutsch E. W., Rost H., Sun Z., Rinner O., Reiter L., Shen Q., Michaelson J. J., Frei A., Alberti S., Kusebauch U., Wollscheid B., Moritz R. L., Beyer A., and Aebersold R. (2013) A complete mass-spectrometric map of the yeast proteome applied to quantitative trait analysis. Nature 494, 266–270 [DOI] [PMC free article] [PubMed] [Google Scholar]
- 4. Nagaraj N., Kulak N. A., Cox J., Neuhauser N., Mayr K., Hoerning O., Vorm O., and Mann M. (2012) System-wide perturbation analysis with nearly complete coverage of the yeast proteome by single-shot ultra HPLC runs on a bench top orbitrap. Mol. Cell. Proteomics 11, M111.013722. [DOI] [PMC free article] [PubMed] [Google Scholar]
- 5. Hebert A. S., Richards A. L., Bailey D. J., Ulbrich A., Coughlin E. E., Westphall M. S., and Coon J. J. (2014) The one hour yeast proteome. Mol. Cell. Proteomics 13, 339–347 [DOI] [PMC free article] [PubMed] [Google Scholar]
- 6. McAlister G. C., Nusinow D. P., Jedrychowski M. P., Wuhr M., Huttlin E. L., Erickson B. K., Rad R., Haas W., and Gygi S. P. (2014) MultiNotch MS3 enables accurate, sensitive, and multiplexed detection of differential expression across cancer cell line proteomes. Anal. Chem. 86, 7150–7158 [DOI] [PMC free article] [PubMed] [Google Scholar]
- 7. Wuhr M., Guttler T., Peshkin L., McAlister G. C., Sonnett M., Ishihara K., Groen A. C., Presler M., Erickson B. K., Mitchison T. J., Kirschner M. W., and Gygi S. P. (2015) The nuclear proteome of a vertebrate. Curr. Biol. 25, 2663–2671 [DOI] [PMC free article] [PubMed] [Google Scholar]
- 8. Peshkin L., Wuhr M., Pearl E., Haas W., Freeman R. M., Gerhart J. C., Klein A. M., Horb M., Gygi S. P., and Kirschner M. W. (2015) On the relationship of protein and mRNA dynamics in vertebrate embryonic development. Dev. Cell 35, 383–394 [DOI] [PMC free article] [PubMed] [Google Scholar]
- 9. Rubakhin S. S., Romanova E. V., Nemes P., and Sweedler J. V. (2011) Profiling metabolites and peptides in single cells. Nat. Methods 8, S20–S29 [DOI] [PMC free article] [PubMed] [Google Scholar]
- 10. Svatos A. (2011) Single-cell metabolomics comes of age: New developments in mass spectrometry profiling and imaging. Anal. Chem. 83, 5037–5044 [DOI] [PubMed] [Google Scholar]
- 11. Zenobi R. (2013) Single-cell metabolomics: analytical and biological perspectives. Science 342, 1201–1212 [DOI] [PubMed] [Google Scholar]
- 12. Rubakhin S. S., Lanni E. J., and Sweedler J. V. (2013) Progress toward single cell metabolomics. Curr. Opin. Biotechnol. 24, 95–104 [DOI] [PMC free article] [PubMed] [Google Scholar]
- 13. Lanni E. J., Rubakhin S. S., and Sweedler J. V. (2012) Mass spectrometry imaging and profiling of single cells. J. Proteomics 75, 5036–5051 [DOI] [PMC free article] [PubMed] [Google Scholar]
- 14. Sun L. L., Zhu G. J., Yan X. J., Zhang Z. B., Wojcik R., Champion M. M., and Dovichi N. J. (2016) Capillary zone electrophoresis for bottom-up analysis of complex proteomes. Proteomics 16, 188–196 [DOI] [PMC free article] [PubMed] [Google Scholar]
- 15. Ye H., Greer T., and Li L. J. (2012) Probing neuropeptide signaling at the organ and cellular domains via imaging mass spectrometry. J. Proteomics 75, 5014–5026 [DOI] [PMC free article] [PubMed] [Google Scholar]
- 16. Ong T. H., Kissick D. J., Jansson E. T., Comi T. J., Romanova E. V., Rubakhin S. S., and Sweedler J. V. (2015) Classification of large cellular populations and discovery of rare cells using single cell matrix-assisted laser desorption/ionization time-of-flight mass spectrometry. Anal. Chem. 87, 7036–7042 [DOI] [PMC free article] [PubMed] [Google Scholar]
- 17. Buchberger A., Yu Q., and Li L. J. (2015) Advances in mass spectrometric tools for probing neuropeptides. In: Cooks R. G., and Pemberton J. E., eds. Annual Review of Analytical Chemistry, Vol 8, pp. 485–509, Annual Reviews, Palo Alto: [DOI] [PMC free article] [PubMed] [Google Scholar]
- 18. Virant-Klun I., Leicht S., Hughes C., and Krijgsveld J. (2016) Identification of maturation-specific proteins by single-cell proteomics of human oocytes. Mol. Cell. Proteomics, in print [DOI] [PMC free article] [PubMed] [Google Scholar]
- 19. Wuhr M., Freeman R. M. Jr., Presler M., Horb M. E., Peshkin L., Gygi S. P., and Kirschner M. W. (2014) Deep proteomics of the Xenopus laevis egg using an mRNA-derived reference database. Curr. Biol. 24, 1467–1475 [DOI] [PMC free article] [PubMed] [Google Scholar]
- 20. Bendall S. C., Simonds E. F., Qiu P., Amir E. A. D., Krutzik P. O., Finck R., Bruggner R. V., Melamed R., Trejo A., Ornatsky O. I., Balderas R. S., Plevritis S. K., Sachs K., Pe'er D., Tanner S. D., and Nolan G. P. (2011) Single-cell mass cytometry of differential immune and drug responses across a human hematopoietic continuum. Science 332, 687–696 [DOI] [PMC free article] [PubMed] [Google Scholar]
- 21. Giesen C., Wang H. A. O., Schapiro D., Zivanovic N., Jacobs A., Hattendorf B., Schuffler P. J., Grolimund D., Buhmann J. M., Brandt S., Varga Z., Wild P. J., Gunther D., and Bodenmiller B. (2014) Highly multiplexed imaging of tumor tissues with subcellular resolution by mass cytometry. Nat. Methods 11, 417–422 [DOI] [PubMed] [Google Scholar]
- 22. Hofstadler S. A., Swanek F. D., Gale D. C., Ewing A. G., and Smith R. D. (1995) Capillary electrophoresis electrospray ionization Fourier transform ion cyclotron resonance mass spectrometry for direct analysis of cellular proteins. Anal. Chem. 67, 1477–1480 [DOI] [PubMed] [Google Scholar]
- 23. Valaskovic G. A., Kelleher N. L., and McLafferty F. W. (1996) Attomole protein characterization by capillary electrophoresis mass spectrometry. Science 273, 1199–1202 [DOI] [PubMed] [Google Scholar]
- 24. Mellors J. S., Jorabchi K., Smith L. M., and Ramsey J. M. (2010) Integrated microfluidic device for automated single-cell analysis using electrophoretic separation and electrospray ionization mass spectrometry. Anal. Chem. 82, 967–973 [DOI] [PMC free article] [PubMed] [Google Scholar]
- 25. Nemes P., Knolhoff A. M., Rubakhin S. S., and Sweedler J. V. (2011) Metabolic differentiation of neuronal phenotypes by single-cell capillary electrophoresis electrospray ionization mass spectrometry. Anal. Chem. 83, 6810–6817 [DOI] [PMC free article] [PubMed] [Google Scholar]
- 26. Nemes P., Rubakhin S. S., Aerts J. T., and Sweedler J. V. (2013) Qualitative and quantitative metabolomic investigation of single neurons by capillary electrophoresis electrospray ionization mass spectrometry. Nat. Protoc. 8, 783–799 [DOI] [PMC free article] [PubMed] [Google Scholar]
- 27. Onjiko R. M., Moody S. A., and Nemes P. (2015) Single-cell mass spectrometry reveals small molecules that affect cell fates in the 16-cell embryo. Proc. Natl. Acad. Sci. U.S.A. 112, 6545–6550 [DOI] [PMC free article] [PubMed] [Google Scholar]
- 28. Hofstadler S. A., Severs J. C., Smith R. D., Swanek F. D., and Ewing A. G. (1996) Analysis of single cells with capillary electrophoresis electrospray ionization Fourier transform ion cyclotron resonance mass spectrometry. Rapid Commun. Mass Spectrom. 10, 919–922 [DOI] [PubMed] [Google Scholar]
- 29. Wang Y., Fonslow B. R., Wong C. C. L., Nakorchevsky A., and Yates J. R. (2012) Improving the comprehensiveness and sensitivity of sheathless capillary electrophoresis tandem mass spectrometry for proteomic analysis. Anal. Chem. 84, 8505–8513 [DOI] [PMC free article] [PubMed] [Google Scholar]
- 30. Sun L. L., Zhu G. J., and Dovichi N. J. (2013) Integrated capillary zone electrophoresis electrospray ionization tandem mass spectrometry system with an immobilized trypsin microreactor for online digestion and analysis of picogram amounts of RAW 264.7 cell lysate. Anal. Chem. 85, 4187–4194 [DOI] [PMC free article] [PubMed] [Google Scholar]
- 31. Moini M. (2007) Simplifying CE-MS operation. 2. Interfacing low-flow separation techniques to mass spectrometry using a porous tip. Anal. Chem. 79, 4241–4246 [DOI] [PubMed] [Google Scholar]
- 32. Sun L. L., Zhu G. J., Zhang Z. B., Mou S., and Dovichi N. J. (2015) Third-generation electrokinetically pumped sheath-flow nanospray interface with improved stability and sensitivity for automated capillary zone electrophoresis mass spectrometry analysis of complex proteome digests. J. Proteome Res. 14, 2312–2321 [DOI] [PMC free article] [PubMed] [Google Scholar]
- 33. Bonvin G., Schappler J., and Rudaz S. (2012) Capillary electrophoresis-electrospray ionization-mass spectrometry interfaces: Fundamental concepts and technical developments. J. Chromatogr., A 1267, 17–31 [DOI] [PubMed] [Google Scholar]
- 34. Lindenburg P. W., Haselberg R., Rozing G., and Ramautar R. (2015) Developments in interfacing designs for CE-MS: Towards enabling tools for proteomics and metabolomics. Chromatographia 78, 367–377 [Google Scholar]
- 35. Sun L. L., Hebert A. S., Yan X. J., Zhao Y. M., Westphall M. S., Rush M. J. P., Zhu G. J., Champion M. M., Coon J. J., and Dovichi N. J. (2014) Over 10000 peptide identifications from the HeLa proteome by using single-shot capillary zone electrophoresis combined with tandem mass spectrometry. Angew. Chem. Int. Ed. 53, 13931–13933 [DOI] [PMC free article] [PubMed] [Google Scholar]
- 36. Lombard-Banek C., Moody S. A., and Nemes P. (2016) Single-cell mass spectrometry for discovery proteomics: Quantifying translational cell heterogeneity in the 16-cell frog (Xenopus) embryo. Angew. Chem. Int. Ed. 55, 2454–2458 [DOI] [PMC free article] [PubMed] [Google Scholar]
- 37. Ludwig K. R., Sun L. L., Zhu G. J., Dovichi N. J., and Hummon A. B. (2015) Over 2300 phosphorylated peptide identifications with single-shot capillary zone electrophoresis tandem mass spectrometry in a 100 min separation. Anal. Chem. 87, 9532–9537 [DOI] [PMC free article] [PubMed] [Google Scholar]
- 38. Sun L. L., Zhu G. J., Zhao Y. M., Yan X. J., Mou S., and Dovichi N. J. (2013) Ultrasensitive and fast bottom-up analysis of femtogram amounts of complex proteome digests. Angew. Chem. Int. Ed. 52, 13661–13664 [DOI] [PMC free article] [PubMed] [Google Scholar]
- 39. Onjiko R. M., Morris S. E., Moody S. A., and Nemes P. (2016) Single-cell mass spectrometry with multi-solvent extraction identifies metabolic differences between left and right blastomeres in the 8-cell frog (Xenopus) embryo. Analyst 141, 3648–3656 [DOI] [PMC free article] [PubMed] [Google Scholar]
- 40. Cox J., Hein M. Y., Luber C. A., Paron I., Nagaraj N., and Mann M. (2014) Accurate proteome-wide label-free quantification by delayed normalization and maximal peptide ratio extraction, termed MaxLFQ. Mol. Cell. Proteomics 13, 2513–2526 [DOI] [PMC free article] [PubMed] [Google Scholar]
- 41. Moody S. A. (1987) Fates of the blastomeres of the 16-cell stage Xenopus embryo. Dev. Biol. 119, 560–578 [DOI] [PubMed] [Google Scholar]
- 42. Grant P. A., Herold M. B., and Moody S. A. (2013) Blastomere explants to test for cell fate commitment during embryonic development. J. Visualized Exp. 71, 4458. [DOI] [PMC free article] [PubMed] [Google Scholar]
- 43. Zhang Y. Y., Fonslow B. R., Shan B., Baek M. C., and Yates J. R. (2013) Protein analysis by shotgun/bottom-up proteomics. Chem. Rev. 113, 2343–2394 [DOI] [PMC free article] [PubMed] [Google Scholar]
- 44. Nemes P., Marginean I., and Vertes A. (2007) Spraying mode effect on droplet formation and ion chemistry in electrosprays. Anal. Chem. 79, 3105–3116 [DOI] [PubMed] [Google Scholar]
- 45. Vizcaino J. A., Cote R. G., Csordas A., Dianes J. A., Fabregat A., Foster J. M., Griss J., Alpi E., Birim M., Contell J., O'Kelly G., Schoenegger A., Ovelleiro D., Perez-Riverol Y., Reisinger F., Rios D., Wang R., and Hermjakob H. (2013) The proteomics identifications (PRIDE) database and associated tools: status in 2013. Nucleic Acids Res. 41, D1063–D1069 [DOI] [PMC free article] [PubMed] [Google Scholar]
- 46. Cox J., and Mann M. (2008) MaxQuant enables high peptide identification rates, individualized p.p.b.-range mass accuracies and proteome-wide protein quantification. Nat. Biotechnol. 26, 1367–1372 [DOI] [PubMed] [Google Scholar]
- 47. Cox J., Neuhauser N., Michalski A., Scheltema R. A., Olsen J. V., and Mann M. (2011) Andromeda: A peptide search engine integrated into the MaxQuant environment. J. Proteome Res. 10, 1794–1805 [DOI] [PubMed] [Google Scholar]
- 48. Bateman A., Martin M. J., O'Donovan C., Magrane M., Apweiler R., Alpi E., Antunes R., Ar-Ganiska J., Bely B., Bingley M., Bonilla C., Britto R., Bursteinas B., Chavali G., Cibrian-Uhalte E., Da Silva A., De Giorgi M., Dogan T., Fazzini F., Gane P., Cas-Tro L. G., Garmiri P., Hatton-Ellis E., Hieta R., Huntley R., Legge D., Liu W. D., Luo J., MacDougall A., Mutowo P., Nightin-Gale A., Orchard S., Pichler K., Poggioli D., Pundir S., Pureza L., Qi G. Y., Rosanoff S., Saidi R., Sawford T., Shypitsyna A., Turner E., Volynkin V., Wardell T., Watkins X., Watkins, Cowley A., Figueira L., Li W. Z., McWilliam H., Lopez R., Xenarios I., Bougueleret L., Bridge A., Poux S., Redaschi N., Aimo L., Argoud-Puy G., Auchincloss A., Axelsen K., Bansal P., Baratin D., Blatter M. C., Boeckmann B., Bolleman J., Boutet E., Breuza L., Casal-Casas C., De Castro E., Coudert E., Cuche B., Doche M., Dornevil D., Duvaud S., Estreicher A., Famiglietti L., Feuermann M., Gasteiger E., Gehant S., Gerritsen V., Gos A., Gruaz-Gumowski N., Hinz U., Hulo C., Jungo F., Keller G., Lara V., Lemercier P., Lieberherr D., Lombardot T., Martin X., Masson P., Morgat A., Neto T., Nouspikel N., Paesano S., Pedruzzi I., Pilbout S., Pozzato M., Pruess M., Rivoire C., Roechert B., Schneider M., Sigrist C., Sonesson K., Staehli S., Stutz A., Sundaram S., Tognolli M., Verbregue L., Veuthey A. L., Wu C. H., Arighi C. N., Arminski L., Chen C. M., Chen Y. X., Garavelli J. S., Huang H. Z., Laiho K. T., McGarvey P., Natale D. A., Suzek B. E., Vinayaka C. R., Wang Q. H., Wang Y. Q., Yeh L. S., Yerramalla M. S., Zhang J., and UniProt C. (2015) UniProt: a hub for protein information. Nucleic Acids Res. 43, D204–D212 [DOI] [PMC free article] [PubMed] [Google Scholar]
- 49. James-Zorn C., Ponferrada V. G., Burns K. A., Fortriede J. D., Lotay V. S., Liu Y., Karpinka J. B., Karimi K., Zorn A. M., and Vize P. D. (2015) Xenbase: Core features, data acquisition, and data processing. Genesis 53, 486–497 [DOI] [PMC free article] [PubMed] [Google Scholar]
- 50. Karpinka J. B., Fortriede J. D., Burns K. A., James-Zorn C., Ponferrada V. G., Lee J., Karimi K., Zorn A. M., and Vize P. D. (2015) Xenbase, the Xenopus model organism database; new virtualized system, data types and genomes. Nucleic Acids Res. 43, D756–D763 [DOI] [PMC free article] [PubMed] [Google Scholar]
- 51. Beck S., Michalski A., Raether O., Lubeck M., Kaspar S., Goedecke N., Baessmann C., Hornburg D., Meier F., Paron I., Kulak N. A., Cox J., and Mann M. (2015) The Impact II, a very high-resolution quadrupole time-of-flight instrument (QTOF) for deep shotgun proteomics. Mol. Cell. Proteomics 14, 2014–2029 [DOI] [PMC free article] [PubMed] [Google Scholar]
- 52. Szklarczyk D., Franceschini A., Wyder S., Forslund K., Heller D., Huerta-Cepas J., Simonovic M., Roth A., Santos A., Tsafou K. P., Kuhn M., Bork P., Jensen L. J., and von Mering C. (2015) STRING v10: protein-protein interaction networks, integrated over the tree of life. Nucleic Acids Res. 43, D447–D452 [DOI] [PMC free article] [PubMed] [Google Scholar]
- 53. Jorgensen P., Steen J. A., Steen H., and Kirschner M. W. (2009) The mechanism and pattern of yolk consumption provide insight into embryonic nutrition in Xenopus. Development 136, 1539–1548 [DOI] [PMC free article] [PubMed] [Google Scholar]
- 54. Lomeli S. H., Peng I. X., Yin S., Loo R. R., and Loo J. A. (2010) New reagents for increasing ESI multiple charging of proteins and protein complexes. J. Am. Soc. Mass Spectrom. 21, 127–131 [DOI] [PMC free article] [PubMed] [Google Scholar]
- 55. Sterling H. J., Prell J. S., Cassou C. A., and Williams E. R. (2011) Protein conformation and supercharging with DMSO from aqueous solution. J. Am. Soc. Mass Spectrom. 22, 1178–1186 [DOI] [PMC free article] [PubMed] [Google Scholar]
- 56. Flachsova M., Sindelka R., and Kubista M. (2013) Single blastomere expression profiling of Xenopus laevis embryos of 8 to 32-cells reveals developmental asymmetry. Sci. Rep. 3, 2278. [DOI] [PMC free article] [PubMed] [Google Scholar]
- 57. Collart C., Owens N. D. L., Bhaw-Rosun L., Cooper B., De Domenico E., Patrushev I., Sesay A. K., Smith J. N., Smith J. C., and Gilchrist M. J. (2014) High-resolution analysis of gene activity during the Xenopus mid-blastula transition. Development 141, 1927–1939 [DOI] [PMC free article] [PubMed] [Google Scholar]
- 58. Domenico E. D., Owens N. D. L., Grant I. M., Gomes-Faria R., and Gilchrist M. J. (2015) Molecular asymmetry in the 8-cell stage Xenopus tropicalis embryo described by single blastomere transcript sequencing. Dev. Biol. 408, 252–268 [DOI] [PMC free article] [PubMed] [Google Scholar]
- 59. Eisenberg E., and Levanon E. Y. (2003) Human housekeeping genes are compact. Trends Genet. 19, 362–365 [DOI] [PubMed] [Google Scholar]
- 60. Abe H., Obinata T., Minamide L. S., and Bamburg J. R. (1996) Xenopus laevis actin-depolymerizing factor cofilin: A phosphorylation-regulated protein essential for development. J. Cell Biol. 132, 871–885 [DOI] [PMC free article] [PubMed] [Google Scholar]
- 61. Sun L. L., Bertke M. M., Champion M. M., Zhu G. J., Huber P. W., and Dovichi N. J. (2014) Quantitative proteomics of Xenopus laevis embryos: Expression kinetics of nearly 4000 proteins during early development. Sci. Rep. 4, 4365. [DOI] [PMC free article] [PubMed] [Google Scholar]
- 62. Aerts J. T., Louis K. R., Crandall S. R., Govindaiah G., Cox C. L., and Sweedler J. V. (2014) Patch clamp electrophysiology and capillary electrophoresis mass spectrometry metabolomics for single cell characterization. Anal. Chem. 86, 3203–3208 [DOI] [PMC free article] [PubMed] [Google Scholar]
- 63. Pan N., Rao W., Kothapalli N. R., Liu R., Burgett A. W. G., and Yang Z. (2014) The single-probe: A miniaturized multifunctional device for single cell mass spectrometry analysis. Anal. Chem. 86, 9376–9380 [DOI] [PubMed] [Google Scholar]
- 64. Zhang Z., Sun L., Zhu G., Cox O. F., Huber P. W., and Dovichi N. J. (2016) Nearly 1000 protein identifications from 50 ng of Xenopus laevis zygote homogenate using online sample preparation on a strong cation exchange monolith based microreactor coupled with capillary zone electrophoresis. Anal. Chem. 88, 877–882 [DOI] [PMC free article] [PubMed] [Google Scholar]
- 65. Breadmore M. C., Tubaon R. M., Shallan A. I., Phung S. C., Keyon A. S. A., Gstoettenmayr D., Prapatpong P., Alhusban A. A., Ranjbar L., See H. H., Dawod M., and Quirino J. P. (2015) Recent advances in enhancing the sensitivity of electrophoresis and electrochromatography in capillaries and microchips (2012–2014). Electrophoresis 36, 36–61 [DOI] [PubMed] [Google Scholar]
- 66. Kitagawa F., and Otsuka K. (2014) Recent applications of on-line sample preconcentration techniques in capillary electrophoresis. J. Chromatogr. 1335, 43–60 [DOI] [PubMed] [Google Scholar]
- 67. Kler P. A., Sydes D., and Huhn C. (2015) Column-coupling strategies for multidimensional electrophoretic separation techniques. Anal. Bioanal. Chem. 407, 119–138 [DOI] [PubMed] [Google Scholar]
- 68. Whitt J. T., and Moini M. (2003) Capillary electrophoresis to mass spectrometry interface using a porous junction. Anal. Chem. 75, 2188–2191 [DOI] [PubMed] [Google Scholar]
- 69. Han X., Wang Y., Aslanian A., Bern M., Lavallee-Adam M., and Yates J. R. (2014) Sheathless capillary electrophoresis tandem mass spectrometry for top-down characterization of Pyrococcus furiosus proteins on a proteome scale. Anal. Chem. 86, 11006–11012 [DOI] [PMC free article] [PubMed] [Google Scholar]
- 70. Macosko E. Z., Basu A., Satija R., Nemesh J., Shekhar K., Goldman M., Tirosh I., Bialas A. R., Kamitaki N., Martersteck E. M., Trombetta J. J., Weitz D. A., Sanes J. R., Shalek A. K., Regev A., and McCarroll S. A. (2015) Highly parallel genome-wide expression profiling of individual cells using nanoliter droplets. Cell 161, 1202–1214 [DOI] [PMC free article] [PubMed] [Google Scholar]
Associated Data
This section collects any data citations, data availability statements, or supplementary materials included in this article.