

Abstract
Lumen formation of breast epithelium is rapidly lost during tumorigenesis along with expression of cell adhesion molecule CEACAM1. CEACAM1 induces lumena in a three-dimensional culture of MCF7/CEACAM1 cells that otherwise fail to form lumena. We hypothesized miRNAs may be involved because >400 genes were up- or down-regulated in MCF7/CEACAM1 cells and miRNAs may modify global expression patterns. Comparative analysis of miRNA expression in MCF7 versus MCF7/CEACAM1 cells revealed two miRNAs significantly down-regulated (hsa-miR-30a-3p by 6.73-fold and hsa-miR-342–5p by 5.68-fold). Location of miR-342 within an intron of the EVL gene, hypermethylated and involved in tumorigenesis, suggested that miR-342 overexpression may block lumen formation. In fact, overexpression of miR-342 in MCF7/CEACAM1 cells significantly blocked lumen formation (p < 0.001). ID4, a dominant-negative inhibitor of basic helix-loop-helix transcription factors, up-regulated in MCF7/CEACAM1 cells, down-regulated in breast cancer, and containing a miR-342 binding site, was tested as a potential target of miR-342. The ratio of ID4 to miR-342 increased from 1:2 in MCF7 cells to 30:1 in MCF7/CEACAM1 cells and a miR-342 inhibitor was able to induce 3′-UTR ID4 reporter activity in MCF7 cells. Because 5-methylcytosine methyltransferase DNMT1 is also a potential target of miR-342, we inhibited miR-342 in MCF7 cells and found DNMT1 was up-regulated with no change in EVL expression, suggesting that miR-342 regulates DNMT1 expression but DNMT1 does not affect the EVL expression in these cells. We conclude that the regulation of lumen formation by miR-342 involves at least two of its known targets, namely ID4 and DNMT1.
Keywords: breast cancer, cell adhesion, mammary gland, microRNA (miRNA), RNA interference (RNAi), CEACAM1
Introduction
Lumen formation of mammary epithelial cells in a three-dimensional culture is an in vitro assay that phenocopies mammary epithelial gland formation (1–3). The loss of lumen formation as exhibited by most, if not all, breast cancer cells in the three-dimensional culture assay phenocopies the premalignant stage of breast cancer know as ductal carcinoma in situ. One approach to identify genes that may govern the change from normal to (pre)malignancy is to transfect breast cancer cells with genes down-regulated in breast cancer and assay their regain of function in the lumen formation assay. A second approach is to block suspect gene expression in breast cancer cells for regain of function, or block gene expression in normal breast epithelial cells for loss of function. One gene that stands out in these assays is the cell-cell adhesion molecule CEACAM1 that is highly expressed in normal breast with a luminal expression pattern (4, 5), and is consistently down-regulated in premalignant and invasive breast cancer (4, 5).
Previously, we have shown that transfection of CEACAM1 into MCF7 breast cancer cells resulted in lumen formation when the cells were cultured three-dimensionally (6), whereas anti-CEACAM1 antibodies blocked lumen formation of the normal breast epithelial cell line MCF10F that express CEACAM1 (5). Although CEACAM1 is expressed as multiple mRNA isoforms in cells, the major isoform expressed in the mammary gland has only 12 amino acids in its cytoplasmic domain, and this isoform (referred to as the short isoform or CEACAM1-SF) is sufficient and necessary for lumen formation (5, 6). Due to its small size it was possible to mutate each of the 12 amino acids and determine which were critical for lumen formation. We identified critical amino acids Phe-454 and Thr-457, the former for interaction with actin and calmodulin (6, 7), and the latter for phosphorylation by calmodulin kinase 2D (8). Although these studies indicated that the cytoplasmic domain of CEACAM1-SF interacted with the cytoskeleton, they did not reveal which downstream genes were, in turn, regulated to enable lumen formation. When MCF-7 cells were transfected with either wild type CEACAM1-SF or a phosphorylation site mutant (T457A,S459A; hereafter referred to as the DA mutant), the transcription of over 400 genes were found to change significantly during lumen formation (9). At the level of transcription regulation, the DNA-binding protein inhibitor ID4 exhibited the largest change (increase by a log2 ratio of 6.7). ID4 has been identified as a tumor suppressor gene in breast cancer where it is epigentically silenced by methylation of its promoter (10, 11). Among other transcriptional regulators, there was an increase in the levels of SOCS2, a critical regulator of mammary gland formation (12–14), and down-regulation of RUNX2, a gene associated with a poor prognosis in breast cancer (15, 16).
Given the complexity of regulating so many genes during lumen formation, we examined the possibility that many of the critical genes were regulated by microRNAs (miRNAs),2 because these small noncoding RNAs can globally regulate gene expression at the post-transcriptional level, affecting multiple pathways (17, 18). Among possible mechanisms of gene regulation, miRNAs may partly base pair with the 3′-UTR target mRNAs, resulting in gene silencing via translational repression (19). A recent review summarizes the many miRNAs that have been implicated in mammary gland development or are altered in breast cancer (52). In particular, one study demonstrated that miR200a expression was required for lumen formation in a murine model of mammary morphogenesis (20), yet it is unclear if this or other miRNAs participate in the CEACAM1-induced lumen formation in human breast epithelial cells. To address this question, we performed a miRNA screen of MCF7 cells transfected with either wild type (SW) or phosphorylation site mutant (DA) CEACAM1. Although, we observed significant up-regulation of 11 miRNAs, only 3 were significantly down-regulated. This result suggested that ablation of expression of an inhibitory miRNA may play a major role in the lumen formation process. Importantly, one of the two miRNAs was miR-342 that has a known role in tumorigenesis (21–25) and regulation of ID4 (26).
The miR-342 gene is located in the intron of the EVL gene (27), whose protein product enhances actin nucleation, polymerization, and bundling (28, 29). The EVL gene is a target of methylation in colon cancer where both EVL and the MIR-342 genes are coordinately down-regulated (27). Given its potential role in tumorigenesis, there has been an active search for gene targets of miR-342. For example, GEMIN4, DNMT1, and BMP7 are experimentally confirmed targets for miR-342 (30, 31). More recently ID4 was reported to be a direct target of miR-342 in MCF7 cells (26). These authors show that miR-342 expression is high, whereas ID4 expression is low in MCF7 cells, perhaps explaining a transformative event that led to the cancer phenotype in these cells (no lumen formation in three-dimensional culture). We now show that transfection of ID4 into MCF-7 cells (in the absence of CEACAM1) enables lumen formation, whereas knockdown of ID4 in MCF-7 transfected with CEACAM1-SF where ID4 expression is high, abrogates lumen formation. In addition, ectopic expression of miR-342 in MCF7 cells transfected with CEACAM1-SF blocks lumen formation. We conclude that ID4 and miR-342 are reciprocally regulated, that expression of miR-342 blocks lumen formation, and expression of CEACAM1-SF reverses the expression patterns of both miR-342 and ID4 in MCF7 cells, enabling lumen formation, a phenotype of normal mammary epithelial cells.
Results
miRNA Microarray Analysis
Although normal breast epithelial cells can form acini with lumen in a three-dimensional culture, breast cancer cells lose this ability (6, 32). Because this is a relatively easy phenotypic analysis for normal versus malignant behavior, we, and others, have used it to identify gene expression changes that are characteristic of the malignant phenotype. Among the many gene expression changes associated with breast cancer, CEACAM1 stands out for its high luminal expression in normal breast and almost complete absence in breast cancer (33). MCF-7 cells are a well characterized breast cancer epithelial cell line that lack CEACAM1 and fail to form lumena in a three-dimensional culture (6, 32). Because we previously found over 400 gene expression changes between MCF-7 cells transfected with wild type CEACAM1-SF (SW) versus a phosphorylation site mutant CEACAM1 (DA) using lumen formation in a three-dimensional culture (6), we explored the possibility that global changes in expression levels may be regulated by miRNAs.
Using an Agilent miRNA gene chip to compare miRNA levels, ∼100 mature human miRNAs demonstrated more than 1.5-fold difference between SW versus DA cells, whereas 14 miRNAs showed more than a 5-fold change (Table 1). Three miRNAs were significantly down-regulated and 11 miRNAs were up-regulated. Because pre-miRNAs are an obligate precursor to generation of mature miRNAs, including them in the analysis allows selection of the most relevant miRNA for further study. In fact, only four pre-miRNAs showed more than 2-fold difference between SW and DA cells (Table 2). Because the miR-342 family is the only miRNA family that appears in both Tables 1 and 2, and the expressions of miR-342 members were down-regulated at both the mature miRNA and pre-miRNA level, this family was selected for further study. Validation of their expression levels by qRT-PCR (Fig. 1), revealed significant down-regulation of miR-342-3p, miR-342-5p, and miR-30a-3p comparing SW to DA cells, confirming the gene chip results.
TABLE 1.
Differentially expressed miRNAs between SW and DA cells
The log2 ratios of SW/DA from microarray analysis were converted to fold-change (− for down-regulated, + for up-regulated). Only values above 2-fold are shown.
| miRNA | SW/DA |
|---|---|
| hsa-miRNA-30a-3p | −6.73 |
| hsa-miRNA-342–5p | −5.68 |
| hsa-miRNA-342–3p | −5.22 |
| hsa-miRNA-379 | +5.93 |
| hsa-miRNA-376c | +6.88 |
| hsa-miRNA-487a | +9.49 |
| hsa-miRNA-431 | +10.7 |
| hsa-miRNA-495 | +11.3 |
| hsa-miRNA-487b | +20.2 |
| hsa-miRNA-139–5p | +21.3 |
| hsa-miRNA-543 | +22.3 |
| hsa-miRNA-127–3p | +26.3 |
| hsa-miRNA-432 | +27.6 |
| hsa-miRNA-409–3p | +48.0 |
TABLE 2.
Differential expressed pre-miRNAs between SW and DA cells
The log2 ratios of SW/DA were converted to fold-change (− for down-regulated, + for up-regulated). Only values above ±2-fold are shown.
| Pre-miRNA | SW/DA |
|---|---|
| hp_hsa-mir-650 | −2.37 |
| hp_hsa-mir-342 | −2.33 |
| hp_hsa-mir-363 | −2.13 |
| hp_hsa-mir516a-2 | +2.03 |
FIGURE 1.
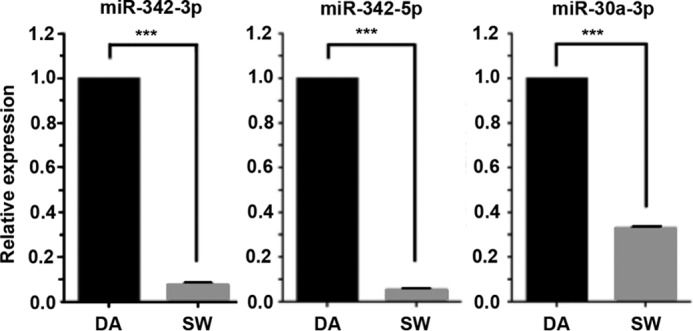
qRT-PCR validation of miRNA microarray results for key miRNAs. Real-time PCR demonstrated miR-342-3p, miR-342-5p, and miR-30a-3p expressions were lower in day 4 three-dimensional-cultured SW cells than in DA cells (triplicate analyses, ***, p < 0.001, p values by Fischer's exact test).
miR-342 Overexpression in SW Cells Prevents Lumen Formation
Because the differential expression of the miR-342 family in SW versus DA cells suggested their overexpression blocks lumen formation and inhibition enables lumen formation, the functional involvement of these miRNAs in CEACAM1-induced lumen formation was examined. We first performed an overexpression analysis on SW cells to determine the influence of the miR-342 family on lumen formation. Mimics of miR-342-3p or miR-342-5p were transfected into SW cells 24 h before transfer to the three-dimensional culture and the expression level of transfected miRNAs was examined by real-time PCR on day 6 in the three-dimensional culture to confirm the success of transfection (Fig. 2). Real-time PCR results showed that high expressions levels were attained all the way to day 6. In addition, when miR-342 expression in DA cells were inhibited with anti-miRNAs the levels of each miRNA were reduced (Fig. 3).
FIGURE 2.
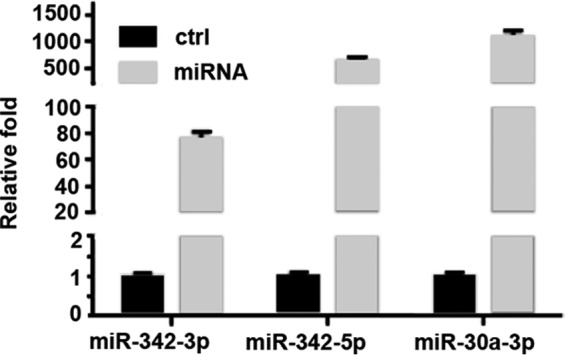
Expression analysis of miRNA transfected SW cells at day 6 in three-dimensional culture. Real-time PCR analysis on day 6 of transfected miRNA mimics into SW cells (miR-342-3p, miR-342-5p, or miR-30a-3p). Transfection was performed at day −1 before transfer to a three-dimensional culture, comparison of scrambled controls versus miRNA mimics.
FIGURE 3.
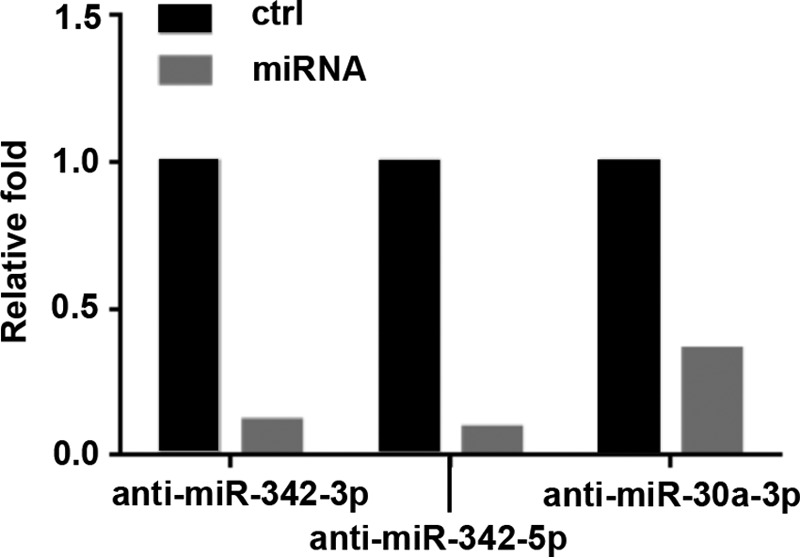
Expression analysis of anti-miRNA transfected DA cells at day 6 in three-dimensional culture. Real-time PCR analysis on day 6 of DA cells transfected with miRNA inhibitors (anti-miR-342-3p, anti-miR-342-5p, or anti-miR-30a-3p). Cells were transfected at day −1 before transfer to a three-dimensional culture, scrambled controls were compared with miRNA inhibitors.
Because miR-342 is down-regulated in SW compared with DA cells, we asked if expression of miR-342 mimics would block lumen formation in SW cells. Lumen formation analysis at day 6 in three-dimensional cultures showed that SW cells (MCF7 cells transfected with CEACAM1) form lumen as examined by confocal microscopy (Fig. 4, A–C) and that lumena can be scored by phase-contrast microscopy (Fig. 4D). When SW cells are transfected with a miR-342 mimic, lumen formation is inhibited from 64 (control Fig. 4E) to 25% (Fig. 4F). Quantitation of lumen formation for this experiment shown in Fig. 4G shows that a miR-342-3p mimic, but not a miR-342-5p or miR30a-3p mimic were able to inhibit lumen formation. We interpret the difference between the two strands of miR-342 as evidence that only miR-342-3p has inhibitory activity due to a complimentary mRNA.
FIGURE 4.

Lumen formation of SW cells transfected with miRNA mimics and DA cells transfected with anti-miRNAs. A–D, microscopic analysis of lumen formation in SW controls: confocal analysis of acinus stained with phalloidin (A), DAPI (B), and merged image (C). Phase-contrast image of an SW acinus with lumen (D). Phase-contrast image of SW cells transfected with a miR-342 scrambled control (E) or a miR-342-3p mimic (F) showing low and high magnification views. The percent lumen formation for 200 colonies counted was 64% in E and 25% in F. G, quantitation of lumen formation for SW cells transfected with scrambled miR342 control, miR342-3p, miR342-5p, or miR30a-3p mimics (***, p < 0.006). H, lumen formation for miRNA inhibitor transfected DA cells analyzed in triplicate at days 3–6 compared with lumen forming SW cells.
Because the DA cells (MCF7 cells transfected with the phosphorylation site mutant of CEACAM1) have high levels of miR-342 and do not form lumena, we asked if they would regain lumen formation when transfected with anti-miR-342 antagonists; however, neither anti-miR-342-3p or anti-miR-342-5p nor anti-miR-30a-3p were able to restore lumen formation when compared with the SW control cells that do form lumena (Fig. 4H).
Taken together, we conclude that miR-342-3p is necessary, but not sufficient for lumen formation in this model system. Because miRNAs exert fine control over many possible targets that may be directly or indirectly affected by their expression, this result suggested that indirect effects were likely, as well as a contribution from other genes.
EVL and miR-342-3p Expression Are Coordinately Regulated in SW Cells
Because EVL is the host gene of MIR-342, not unexpectedly, most studies show that they are coordinately regulated (27, 34). Therefore, we examined the expression of EVL in SW and vector control cells at both the RNA and protein level, and found that, like miR-342-3p, EVL expression was high in vector control and low in SW cells (Fig. 5, A and B). This suggested that one of the effects of CEACAM1-SF transfection into MCF-7 cells was a reversal of the expression patterns of EVL and miR-342-3p, likely due to changes in transcriptional regulation. In one respect this observation is puzzling, because in normal colon where CEACAM1 levels are high (35), EVL and miR-342 are also high, whereas in colon cancer the opposite is true (36, 37). This tissue difference prompted us to begin a search for possible regulators of EVL and miR-342 that may be differentially expressed in breast versus colon and that involved CEACAM1 expression. Inhibition of miR-342 in parental MCF7 cells had no effect on EVL expression (Fig. 5, C and D), demonstrating that miR-342 does not regulate EVL gene expression in these cells.
FIGURE 5.

EVL expression is correlated with miR-342-3p expression. EVL expression is lower in SW cells in both mRNA level (A) and protein level (B) than in vector-transfected parental MCF7 cells (V), which is consistent with the expression of miR-342-3p. mRNA or protein levels were measured on both plastic and three-dimensional culture conditions at day 4 (A) or days 2 and 4 (B). mRNA expression is relative to GAPDH. Equal amounts of protein (50 μg) from cell lysates were loaded onto gels that were immunoblotted with antibodies to EVL (green channel) or actin (red channel). Immunoblots were scanned and the integrated values of EVL for vector controls set to 1.00 for comparison to SW cells. No correction was made for actin loading. Knockdown of miR-342 with inhibitors in parental MCF7 cells (C) has no effect on EVL expression (D).
EVL and miR-342-3p Expression Is Regulated by IRF1
Interferon regulatory factor-1 (IRF1) is a transcription factor that is reported to regulate miR-342-3p expression (38) in acute promyelocytic leukemia (APL). The APL study determined that there is an IRF-1 binding site in the EVL promoter that maintains low levels of EVL and miR-342 in those cells and that ectopic expression of miR-342 stimulated all-trans-retinoic acid-stimulated differentiation (38). Interestingly, we have previously shown that IRF-1 regulates CEACAM1 expression and mRNA splicing in both colon and breast cancer cell (39). In addition, CEACAM1 is strongly expressed in mature granulocytes (40, 41), and all-trans-retinoic acid that regulates differentiation of APL cells, also regulates expression of CEACAM1 (42). Therefore, we examined possible IRF-1 regulation of the EVL/MIR-342 promoter in this model system. IRF1 exhibited lower expression in SW compared with vector-transfected MCF7 cells (Fig. 6A). When SW cells were treated with RNAi to IRF1, IRF-1 expression was further reduced (Fig. 6B) leading to a further reduction in expression of both EVL and miR-342-3p (Fig. 6, C and D). When the levels of IRF-1 at the EVL promoter were measured by ChIP analysis, we found higher levels of IRF-1 in vector control versus SW cells, indicating a change in IRF-1 occupancy at the EVL promoter (Fig. 6E). Protein expression levels of both IRF-1 and EVL were reduced after treatment of SW cells with RNAi to IRF-1, confirming that the effect was found at both the mRNA and protein expression levels (Fig. 6F). This is a second example where EVL and miR-342 are low in cancer (APL cells) and high in differentiated cells (all-trans-retinoic acid-treated APL cells), further suggesting that their regulation may differ between tissues with very different outcomes. Importantly, IRF-1 appears to positively regulate EVL and miR342 expression whether in APL or SW cells. Because, in our hands, we have not been able to induce CEACAM1 protein expression in parental MCF-7 cells either with all-trans-retinoic acid or IRF-1 (data not shown), our system is not dependent on IRF-1 at the level of CEACAM1, hence the necessity for ectopic transfection of CEACAM1 in SW cells.
FIGURE 6.

IRF1 regulates EVL and miR-342-3p expression. IRF1 showed lower expression in SW cells compared with vector-transfected parental MCF7 cells whether on plastic or a three-dimensional culture (4 days) (A). When IRF1 was knocked down by two different RNAi to IRF-1 versus untreated, Lipofectamine (lipo) or RNAi controls in SW cells (B), both EVL (C) and miR-342-3p (D) expression levels were further decreased. The relative enrichment (adjusted for input) of IRF1 at the promoter of EVL was compared for vector (V) versus CEACAM1-transfected MCF7 (SW) cells by ChIP analysis (E). When protein levels of IRF-1 were measured by immunoblot after treatment of SW cells with RNAi to IRF1 versus controls, EVL protein levels were concomitantly reduced (F). Immunoblots were quantified as described in the legend to Fig. 5B.
ID4 Expression Inversely Correlates with miR-342 Expression
Having found a potential regulator of expression of miR-342 in our model system, we next began a search for targets of miR-342 with the goal that genes that exhibited an inverse expression pattern from miR-342 were possible candidates. ID4 was an obvious candidate in that it was high in SW and low in DA cells, up-regulated by a log2 of 6.7 (6). In addition, ID4 had been previously identified as a miR-342 target in both MDA-MB-231 and MCF7 cells (26). ID4, an inhibitor of basic helix-loop-helix transcription factors (43), often exhibits tumor suppressor activity in many cancers including breast cancer (10, 11). However, the exact mechanism of ID4 regulation is unclear (44), and ID4 may also exert its activity by forming heterodimers with ID1–3, allowing certain basic helix-loop-helix transcription factors to regain function (44). This idea is appealing because ID2 is a critical regulator of murine mammary morphogenesis (45). To test the possibility that miR-342 and ID4 play linked roles in lumen formation, we first measured their expression levels in parental MCF7 cells (Fig. 7A). As expected, ID4 expression was low in parental MCF7 cells where miR-342 expression is high. Conversely, ID4 expression was high and miR-342 was low in the “normal” cell line MCF10A and SW cells that are lumen forming cells in a three-dimensional culture (3). Interestingly, ID4 is low in colon cancer cell lines SW480 and LOVO (46) and HT29 (Fig. 7A), results in common with the MCF7 breast cancer cells.
FIGURE 7.

miR-342 regulates ID4 expression. A, relative expression levels of ID4 and miR-342 in SW cells normalized to GAPDH. B, a luciferase reporter assay for the 3′-UTR of ID4 in parental MCF7 cells transfected with two different miR-342 inhibitors. The effect of miR-342 levels (C) in SW cells transfected with miR-342 pre-miRNAs on ID4 expression (D).
Because miR-342 has been reported to directly inhibit ID4 expression (26), we tested two inhibitors of miR-342 in an ID4 3′-UTR reporter system in parental MCF7 cells and found that one of the two inhibitors significantly increased reporter activity (Fig. 7B). We interpret the differential effect between the two inhibitors as evidence that the two, acting on different sequences within miR-342, affect their ability to form stable complexes with the 3′-UTR of ID4, but have no direct evidence that this is the case. Thus, the results only partly support a direct effect of miR-342 on the ID4 3′-UTR.
We also tested the effect of overexpression of miR-342 on ID4 in SW cells where miR-342 is low and ID4 is high and found an unexpected increase in ID4 expression (Fig. 7, C and D). Because the overexpression levels of miR-342 were very high (Fig. 7C), it is possible that there is an off-target effect. However, we believe it is more likely that the low expression of ID4 in parental MCF7 cells is due to promoter silencing of ID4, whereas the ID4 promoter is reactivated in SW cells. As discussed in our accompanying article (49), the latter explanation was worth considering based on previous studies showing epigenetic silencing of the ID4 promoter in various cell lines.
DNMT1 Is a Target of miR-342 in MCF7 Cells
The ID4 promoter has been shown to be hypermethylated in prostate cancer via recruitment of EZH2 and DNMT1 that methylate histone 3 at lysine 27, and a CpG island in the ID4 promoter, respectively (47). Although the EVL promoter is hypermethylated in many cancers, leading to the coordinated suppression of both EVL and miR-342 (27), we must conclude that the opposite situation exists in MCF7 cells because both EVL and miR-342 expression are high (Fig. 5). Thus, we considered the possibility that in MCF7 cells, the promoter of EVL is hypomethylated, because its expression is high, whereas the promoter of ID4 is hypermethylated, because its expression is low. Because promoter methylation is maintained by the enzyme DNMT1 (48) and miR-342 has been shown to control the expression of DNMT1 (31), these possible connections in MCF7 cells merited further investigation. First we established that DNMT1 expression, which is low in parental MCF7 cells where miR-342 is high, could be up-regulated by inhibition of miR-342. Indeed, this was the case, where inhibitors of miR-342-3p but not miR-342-5p were effective in increasing the protein levels of DNMT1 (Fig. 8A). Notably, this treatment did not change the mRNA expression of EVL (Fig. 5D), which is already high in MCF7 cells, suggesting that the unmethylated promoter of EVL is insensitive to DNMT1 as expected for an enzyme that acts only on hemimethylated DNA. However, the protein expression of DNMT1 is lowered by overexpression of miR-342 in SW cells (Fig. 8B).
FIGURE 8.
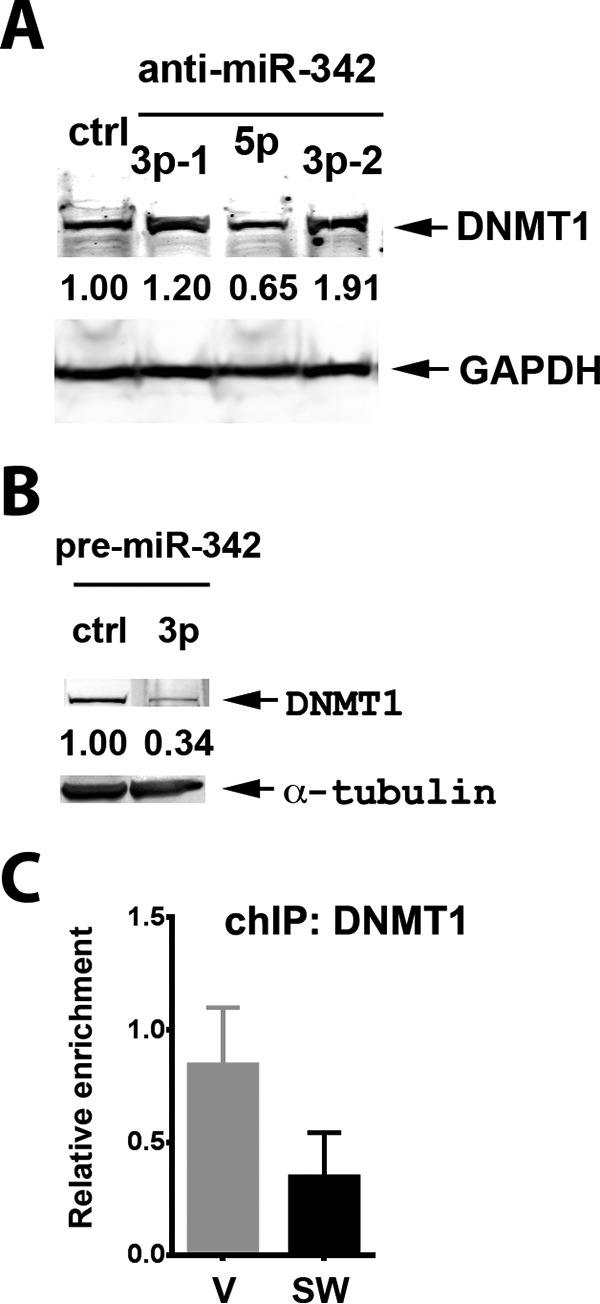
miR-342 regulates DNMT1 expression in MCF7 or SW cells. A, protein levels of DNMT1 in parental MCF7 cells transfected with Lipofectamine control versus miR-342 inhibitors, 3p-1, 5p, and 3p-2. Equivalent protein loading (50 μg) per lane was normalized to control cells. GAPDH is shown as a loading control marker only. B, effect of overexpression of pre-miR-342-3p on DNMT1 protein levels in SW cells. Immunoblots were quantified as described in the legend to Fig. 5B. C, ChIP analysis of DNMT1 at ID4 promoter in vector-transfected MCF7 controls versus SW cells, triplicate analysis (relative enrichment is corrected for input).
We also tested the role of DNMT1 in SW cells where miR-342 expression is low and ID4 expression is high, suggesting a change in the promoter methylation status from parental to SW cells. As previously shown, when SW cells were transfected with miR-342, miR-342 expression was dramatically increased (Fig. 2), and when ID4 expression levels were analyzed by qRT-PCR, ID4 expression was further increased (Fig. 7D). Thus, regulation of DNMT1 by miR-342 in SW cells may be one mechanism of ID4 regulation. The fully methylated ID4 promoter in MCF7 cells becomes hypomethylated in SW cells. To further investigate this mechanism, we performed ChIP analysis of the ID4 promoter for localization of DNMT1. The results show about a 3-fold higher level of DNMT1 on the ID4 promoter of MCF7 versus SW cells (Fig. 8C), in agreement with this mechanism. Further evidence of an epigenetic mechanism for control of the ID4 promoter is provided in the accompanying article (49). Thus, both miRNA and epigenetic mechanisms work together to regulate the levels of ID4 in MCF7 versus SW cells.
Discussion
Normal mammary epithelial cells strongly express the short isoform of CEACAM1 (CEACAM1-SF) in a luminal orientation, whereas breast cancer tissues and cell lines down-regulate CEACAM1 and fail to form lumena (6, 32). Transfection of CEACAM1 can transform the breast tumor cell line MCF7 to a lumen-forming phenotype in a three-dimensional culture (6) or in humanized murine mammary glands (50), a phenotype that mimics healthy functional breast epithelial cells. Because the cytoplasmic domain of CEACAM1-SF has only 12 amino acids, it has been a mystery how such a short signaling domain may re-establish this normal phenotype in otherwise cancerous cells. Although we have previously shown that this domain can bind actin and calmodulin (6, 7), and be phosphorylated by CaMK2D (8), these activities still do not explain how over 400 genes can change upon the addition of just this active domain (in SW cells) compared with its mutated version (DA cells) (6). In the search for mechanisms that can globally regulate many genes, we turned to pathway regulation by miRNAs. Importantly, whereas many miRNAs were up-regulated in the screening assay, only two were down-regulated, and only one of these, miR-342, met all the criteria for expressional regulation. We validated the down-regulation of miR-342 by qPCR in CEACAM1-SF-transfected MCF7 (SW) cells during a three-dimensional ECM culture and showed that overexpression of miR-342 in SW cells that express functional CEACAM1-SF significantly decreases lumen formation.
ID4 is a possible target for miR-342 in MCF7 cells (26), and also proved to be significantly up-regulated in CEACAM1-SF-induced lumen formation in SW cells (6). Because ID4 was shown in our accompanying article (49) to be both necessary and sufficient for lumen formation, we can propose that expression of miR-342 is at least partly responsible for its regulation. Assuming both ID4 and miR-342 expression are directly connected, there are two possible models for CEACAM1-SF-induced lumen formation. In model one, CEACAM1 decreases miR-342 expression that, in turn, relieves ID4 suppression enabling lumen formation. In model two, CEACAM1 up-regulates the expression of ID4, that in turn, targets suppression of miR-342 by a sponge effect, abrogating possible anti-lumen effects of miR-342 expression. In support of the second model, overexpression of miR-342 mimics in the lumen-enabled SW cells, abrogates lumen formation. In the accompanying article (49) we show that CEACAM1 can restore ID4 expression by an epigenetic mechanism. Because ID4 may regulate the levels of ID1–3, that in turn, regulate the levels of other transcription factors, the situation could be more complex (44).
As a first step in unraveling these mysteries, we examined yet another aspect of miR-342 regulation, namely, that of DNMT1, an enzyme responsible for gene silencing by methylation of hemimethylated CpG islands. Because both ID4 and EVL (the host gene for mir-342) promoters have been reported to be hypermethylated in cancer, one possibility is that they may be reciprocally methylated, leading to opposite results depending on the tissue affected. In our current model, consistent with known targets of miR-342, we proposed that the ID4 promoter is hypermethylated and the EVL promoter hypomethylated in parental MCF7 cells, and that ectopic expression of CEACAM1 is able to reverse the methylation status of the two genes. Further studies in our accompanying article (49) support an epigenetic model for the regulation of the ID4 promoter. Thus, miR-342 may indirectly affect the ID4 promoter by regulating the expression of DNMT1.
An important conclusion from this study is that because ID4 expression depends on the presence or absence miR-342 only when the ID4 promoter becomes hemimethylated, thus, the expression of miR-342 is necessary, but not sufficient for lumen formation because it only affects ID4 in one state, and likely by regulating the expression levels of DNMT1. The evidence for regulation of DNMT1 by miR-342 is further supported by studies on prostate cells, where both ID4 and DNMT1 show interactions in both cell lines and prostate cancer tissue (47) where up- or down-regulation of CEACAM1 is also observed (51). Taken together, the fine-tuning of the lumen formation program involves two negative acting signals. One is ID4, a transcription factor that can inhibit other transcription factors (26), and the other is miR-342 that negatively regulates both IRF-1 (38) and DNMT1 (49). The missing upstream regulator not mentioned in the earlier studies is likely CEACAM1. Thus, CEACAM1 expression (or lack thereof) is able to affect the downstream expression of ID4, because ectopic expression of ID4 can completely substitute for ectopic expression of CEACAM1.
Experimental Procedures
Cell Lines
SW cells are MCF7 cells stably transfected with wild type CEACAM1-SF. DA cells are MCF-7 cells stably transfected with T457A,S459A mutated CEACAM1-SF. MCF-7V cells are MCF-7 cells stably transfected with empty vector. MCF7 (ATCC HTB-22) and HT-29 (ATCC HTB-38) cells were cultured in minimal essential medium and McCoy's 5a medium modified media, respectively, and supplemented with 10% fetal bovine serum and 1% penicillin/streptomycin/ampicillin. The MCF 10A (ATCC CRL-1031) cells were cultured in mammary epithelial basal medium supplemented with the MEGM kit (Lonza/Clonetics Corporation).
Antibodies and Reagents
Anti-EVL polyclonal antibody was from Sigma; monoclonal anti-IRF-1 was from Cell Signaling, and anti-DNMT1 was from Epigentek (Farmingdale, NY); anti-β-actin, tubulin, and GAPDH were from GeneTex (Irvine, CA). Lipofectamine 2000 and RNAiMAX transfecting reagent, Opti-MEM I reduced serum medium, Stealth RNAi, and Silencer® siRNAs for IRF1, Ambion Anti-miRNA Inhibitors, and Pre-mi miRNA Precursors were from Invitrogen. The LightSwitch 3′-UTR Reporter GoClone for ID4 and miRNA inhibitors and control were from Active Motif (Carlsbad, CA). pCMV6-ID4 plasmid was obtained from OriGene Technologies, Inc. (Rockville, MD).
miRNA Microarray
miRNA microarray analysis was performed on an Agilent 2100 Bioanalyzer with RNA isolated from day 4 DA and SW cells cultured in three-dimension. Positive values indicate up-regulation, whereas negative values suggest down-regulation.
Reverse Transcription and Quantitative Real-time PCR
The expressions of the most differentially expressed miRNAs were confirmed by real-time qPCR. miScript I RT Kit (Qiagen, Germantown, MD) was used for miRNA reverse transcription. miScript miRNA PCR Arrays (Qiagen) and miScript Primer Assays (Qiagen) were employed for miRNA real-time qPCR analysis. TaqMan Gene Expression Assays were used to quantitate the transcript expression levels of ID4, EVL, and IRF1 with the TaqMan Universal Master Mix II kit. Levels of mRNA were compared after correction by use of concurrent GAPDH message amplification using the TaqMan GAPDH control reagents. TaqMan MicroRNA and the TaqMan Endogenous Control Assays were used to assess expression levels of the miRNAs (Invitrogen).
Transfection
Cells were seeded onto plastic 1 day before transfection. miRNA (50 nm) mimics or inhibitor were transfected into SW or DA cells using Lipofectamine RNAiMAX (Life Technologies). After 24 h, cells were then transferred to three-dimensional Matrigel for further culture. Six days after three-dimensional Matrigel culture, acini with or without lumena were counted (>200 per experiment) and lumena percentage was calculated. RNA was isolated from day 6 cells for miRNA expression detection.
Three-dimensional Culture
One hundred percent Matrigel basement membrane matrix (BD Biosciences, San Jose, CA) was coated onto plastic first, cells were allowed to attach for 30 min, and then media with 50% Matrigel was added to sandwich the cells between two layers of Matrigel. Media was changed every other day. Lumen formation was observed over a 1–6 day period using an inverted light microscope (phase-contrast) with maximal lumen formation usually seen at 6 days. In each case more than 200 acini were scored for lumen formation and statistical analysis was performed using Fisher's exact test.
Luciferase Assays
Parental MCF7 cells was split and seeded at 80% confluence overnight in 96-well plate in 100 μl total volume. 100 ng of the pLightSwitch-3UTR ID4 plasmid was cotransfected with 100 nm of the miRNA inhibitors and control. The reporter assays were carried out using the LightSwitch Luciferase Assay System (Active Motif) and read on the CLARIOstar instrument (BMG LABTECH, Inc., Cary, NC).
Chromatin Immunoprecipitation (ChIP)
ChIP was carried out using the ChIP Assay Kit from EMD Millipore per the manufacturer's instructions. Briefly, MCF7 (V and SW) cells (1 × 10⁶) were cross-linked with 1% formaldehyde (Sigma) for 10 min at 37 °C. After washing with PBS, cells were lysed on ice for 10 min in 200 μl of SDS lysis buffer containing protease inhibitors. Lysates were subjected to sonication on a Branson digital sonifier for 4 × 30 s at 30% amplitude to shear DNA to lengths between 200 and 1000 base pairs. The lysates were cleared by centrifugation at 13,000 rpm for 10 min at 4 °C. The lysates were then diluted 10-fold in ChIP dilution buffer, precleared with 75 μl of Protein A-agarose/salmon sperm DNA (50% Slurry), incubated with 5 μg of anti-DNMT1 or anti-IRF-1 antibody overnight at 4 °C with rotation, followed by addition of Protein A-agarose/salmon sperm DNA (50% slurry) for 1 h. The agarose beads were pelleted and washed at 4 °C once in low salt-high salt-LiCl immune complex wash and twice in TE buffer. DNA was eluted twice with 250 μl each of 1% SDS, 0.1 m NaHCO3 and the cross-links were reversed by incubating with 20 μl of 5 m NaCl for 4 h at 65 °C. The DNA was purified by treatment with Proteinase K (Sigma) for 1 h at 45 °C, extracted with the ChIP DNA Clean & Concentrator kit (Zymo Research Corp., Irvine, CA). DNA was dissolved in Tris-HCl, pH 7.5, and amplified with ID4 promoter-specific primers (forward 5′-GACTCCCACTCAGCTCTCTT-3′, reverse 5′-TGGAGTGGCCAGCCAATCA-3′) and EVL-specific primers (forward 5′-TCAACATAGGCTGGTGGGAG-3′, reverse 3′-GCACTGGTTCCAATACTCAC-3′) using the iQ SYBR Green Supermix on the CFX-96 Real-time System (Bio-Rad). Normalization was taken into account for differences in input/starting materials.
Western Blotting Analysis
Cells were lysed (in 10 mm Tris-HCl, pH 7.4, 100 mm NaCl, 1 mm EDTA, 1 mm EGTA, 50 mm NaF, 1 mm PMSF, 1 mm Na3VO4, 0.05% sodium deoxycholate, 10% glycerol, 1% Triton X-100, and proteinase inhibitor mixture (Roche Applied Science)) on ice for 30 min, and protein concentration from total lysates was determined using the PierceTM Coomassie Plus Assay kit. Fifty micrograms of protein from each sample were resolved by SDS-gel electrophoresis and Western blotting analysis with appropriate antibodies. Detection was carried out using the Odyssey® Infrared Imaging System (LI-COR Biotechnology, Lincoln, NE) according to the manufacturer's instructions.
Author Contributions
J. E. S. designed the study. J. E.S. and C. W. wrote the paper. C. W. and T. N. performed the experiments and analyzed the data.
This work was supported, in whole or in part, by National Institutes of Health Grant CA84202. The authors declare that they have no conflicts of interest with the contents of this article. The content is solely the responsibility of the authors and does not necessarily represent the official views of the National Institutes of Health.
- miRNA
- microRNA
- IRF1
- interferon regulatory factor-1
- APL
- acute promyelocytic leukemia
- qPCR
- quantitative PCR.
References
- 1. Mailleux A. A., Overholtzer M., Schmelzle T., Bouillet P., Strasser A., and Brugge J. S. (2007) BIM regulates apoptosis during mammary ductal morphogenesis, and its absence reveals alternative cell death mechanisms. Dev. Cell 12, 221–234 [DOI] [PMC free article] [PubMed] [Google Scholar]
- 2. Bissell M. J., Radisky D. C., Rizki A., Weaver V. M., and Petersen O. W. (2002) The organizing principle: microenvironmental influences in the normal and malignant breast. Differentiation 70, 537–546 [DOI] [PMC free article] [PubMed] [Google Scholar]
- 3. Mailleux A. A., Overholtzer M., and Brugge J. S. (2008) Lumen formation during mammary epithelial morphogenesis: insights from in vitro and in vivo models. Cell Cycle 7, 57–62 [DOI] [PubMed] [Google Scholar]
- 4. Huang J., Simpson J. F., Glackin C., Riethorf L., Wagener C., and Shively J. E. (1998) Expression of biliary glycoprotein (CD66a) in normal and malignant breast epithelial cells. Anticancer Res. 18, 3203–3212 [PubMed] [Google Scholar]
- 5. Huang J., Hardy J. D., Sun Y., and Shively J. E. (1999) Essential role of biliary glycoprotein (CD66a) in morphogenesis of the human mammary epithelial cell line MCF10F. J. Cell Sci. 112, 4193–4205 [DOI] [PubMed] [Google Scholar]
- 6. Chen C. J., Kirshner J., Sherman M. A., Hu W., Nguyen T., and Shively J. E. (2007) Mutation analysis of the short cytoplasmic domain of the cell-cell adhesion molecule CEACAM1 identifies residues that orchestrate actin binding and lumen formation. J. Biol. Chem. 282, 5749–5760 [DOI] [PubMed] [Google Scholar]
- 7. Yokoyama S., Chen C. J., Nguyen T., and Shively J. E. (2007) Role of CEACAM1 isoforms in an in vivo model of mammary morphogenesis: mutational analysis of the cytoplasmic domain of CEACAM1–4S reveals key residues involved in lumen formation. Oncogene 26, 7637–7646 [DOI] [PubMed] [Google Scholar]
- 8. Nguyen T., Chen C. J., and Shively J. E. (2014) Phosphorylation of CEACAM1 molecule by calmodulin kinase IID in a three-dimensional model of mammary gland lumen formation. J. Biol. Chem. 289, 2934–2945 [DOI] [PMC free article] [PubMed] [Google Scholar]
- 9. Chen C. J., Nguyen T., and Shively J. E. (2010) Role of calpain-9 and PKC-δ in the apoptotic mechanism of lumen formation in CEACAM1 transfected breast epithelial cells. Exp. Cell Res. 316, 638–648 [DOI] [PMC free article] [PubMed] [Google Scholar]
- 10. Umetani N., Mori T., Koyanagi K., Shinozaki M., Kim J., Giuliano A. E., and Hoon D. S. (2005) Aberrant hypermethylation of ID4 gene promoter region increases risk of lymph node metastasis in T1 breast cancer. Oncogene 24, 4721–4727 [DOI] [PubMed] [Google Scholar]
- 11. Noetzel E., Veeck J., Niederacher D., Galm O., Horn F., Hartmann A., Knüchel R., and Dahl E. (2008) Promoter methylation-associated loss of ID4 expression is a marker of tumour recurrence in human breast cancer. BMC Cancer 8, 154. [DOI] [PMC free article] [PubMed] [Google Scholar]
- 12. Harris J., Stanford P. M., Sutherland K., Oakes S. R., Naylor M. J., Robertson F. G., Blazek K. D., Kazlauskas M., Hilton H. N., Wittlin S., Alexander W. S., Lindeman G. J., Visvader J. E., and Ormandy C. J. (2006) Socs2 and elf5 mediate prolactin-induced mammary gland development. Mol. Endocrinol. 20, 1177–1187 [DOI] [PubMed] [Google Scholar]
- 13. Sutherland K. D., Lindeman G. J., and Visvader J. E. (2007) Knocking off SOCS genes in the mammary gland. Cell Cycle 6, 799–803 [DOI] [PubMed] [Google Scholar]
- 14. Rico-Bautista E., Flores-Morales A., and Fernández-Pérez L. (2006) Suppressor of cytokine signaling (SOCS) 2, a protein with multiple functions. Cytokine Growth Factor Rev. 17, 431–439 [DOI] [PubMed] [Google Scholar]
- 15. Tandon M., Chen Z., and Pratap J. (2014) Runx2 activates PI3K/Akt signaling via mTORC2 regulation in invasive breast cancer cells. Breast Cancer Res. 16, R16. [DOI] [PMC free article] [PubMed] [Google Scholar]
- 16. Ferrari N., McDonald L., Morris J. S., Cameron E. R., and Blyth K. (2013) RUNX2 in mammary gland development and breast cancer. J. Cell. Physiol. 228, 1137–1142 [DOI] [PubMed] [Google Scholar]
- 17. Ambros V. (2004) The functions of animal microRNAs. Nature 431, 350–355 [DOI] [PubMed] [Google Scholar]
- 18. Bartel D. P. (2004) MicroRNAs: genomics, biogenesis, mechanism, and function. Cell 116, 281–297 [DOI] [PubMed] [Google Scholar]
- 19. He L., and Hannon G. J. (2004) MicroRNAs: small RNAs with a big role in gene regulation. Nat. Rev. Genet. 5, 522–531 [DOI] [PubMed] [Google Scholar]
- 20. Nagaoka K., Zhang H., Watanabe G., and Taya K. (2013) Epithelial cell differentiation regulated by MicroRNA-200a in mammary glands. PLoS ONE 8, e65127. [DOI] [PMC free article] [PubMed] [Google Scholar]
- 21. Blenkiron C., Goldstein L. D., Thorne N. P., Spiteri I., Chin S. F., Dunning M. J., Barbosa-Morais N. L., Teschendorff A. E., Green A. R., Ellis I. O., Tavaré S., Caldas C., and Miska E. A. (2007) MicroRNA expression profiling of human breast cancer identifies new markers of tumor subtype. Genome Biol. 8, R214. [DOI] [PMC free article] [PubMed] [Google Scholar]
- 22. Wang L., Qin Y., Tong L., Wu S., Wang Q., Jiao Q., Guo Z., Lin L., Wang R., Zhao W., and Zhong Z. (2012) MiR-342-5p suppresses coxsackievirus B3 biosynthesis by targeting the 2C-coding region. Antiviral Res. 93, 270–279 [DOI] [PubMed] [Google Scholar]
- 23. Li X. R., Chu H. J., Lv T., Wang L., Kong S. F., and Dai S. Z. (2014) miR-342-3p suppresses proliferation, migration and invasion by targeting FOXM1 in human cervical cancer. FEBS Lett. 588, 3298–3307 [DOI] [PubMed] [Google Scholar]
- 24. Zhao L., and Zhang Y. (2015) miR-342-3p affects hepatocellular carcinoma cell proliferation via regulating NF-κB pathway. Biochem. Biophys. Res. Commun. 457, 370–377 [DOI] [PubMed] [Google Scholar]
- 25. Xie X., Liu H., Wang M., Ding F., Xiao H., Hu F., Hu R., and Mei J. (2015) miR-342-3p targets RAP2B to suppress proliferation and invasion of non-small cell lung cancer cells. Tumour Biol. 36, 5031–5038 [DOI] [PubMed] [Google Scholar]
- 26. Crippa E., Lusa L., De Cecco L., Marchesi E., Calin G. A., Radice P., Manoukian S., Peissel B., Daidone M. G., Gariboldi M., and Pierotti M. A. (2014) miR-342 regulates BRCA1 expression through modulation of ID4 in breast cancer. PLoS ONE 9, e87039. [DOI] [PMC free article] [PubMed] [Google Scholar]
- 27. Grady W. M., Parkin R. K., Mitchell P. S., Lee J. H., Kim Y. H., Tsuchiya K. D., Washington M. K., Paraskeva C., Willson J. K., Kaz A. M., Kroh E. M., Allen A., Fritz B. R., Markowitz S. D., and Tewari M. (2008) Epigenetic silencing of the intronic microRNA hsa-miR-342 and its host gene EVL in colorectal cancer. Oncogene 27, 3880–3888 [DOI] [PubMed] [Google Scholar]
- 28. Lambrechts A., Kwiatkowski A. V., Lanier L. M., Bear J. E., Vandekerckhove J., Ampe C., and Gertler F. B. (2000) cAMP-dependent protein kinase phosphorylation of EVL, a Mena/VASP relative, regulates its interaction with actin and SH3 domains. J. Biol. Chem. 275, 36143–36151 [DOI] [PubMed] [Google Scholar]
- 29. Rotter B., Bournier O., Nicolas G., Dhermy D., and Lecomte M. C. (2005) αII-spectrin interacts with Tes and EVL, two actin-binding proteins located at cell contacts. Biochem. J. 388, 631–638 [DOI] [PMC free article] [PubMed] [Google Scholar]
- 30. Cittelly D. M., Das P. M., Spoelstra N. S., Edgerton S. M., Richer J. K., Thor A. D., and Jones F. E. (2010) Downregulation of miR-342 is associated with tamoxifen resistant breast tumors. Mol. Cancer 9, 317. [DOI] [PMC free article] [PubMed] [Google Scholar]
- 31. Wang H., Wu J., Meng X., Ying X., Zuo Y., Liu R., Pan Z., Kang T., and Huang W. (2011) MicroRNA-342 inhibits colorectal cancer cell proliferation and invasion by directly targeting DNA methyltransferase 1. Carcinogenesis 32, 1033–1042 [DOI] [PubMed] [Google Scholar]
- 32. Kirshner J., Chen C. J., Liu P., Huang J., and Shively J. E. (2003) CEACAM1–4S, a cell-cell adhesion molecule, mediates apoptosis and reverts mammary carcinoma cells to a normal morphogenic phenotype in a three-dimensional culture. Proc. Natl. Acad. Sci. U.S.A. 100, 521–526 [DOI] [PMC free article] [PubMed] [Google Scholar]
- 33. Kirshner J., Hardy J., Wilczynski S., and Shively J. E. (2004) Cell-cell adhesion molecule CEACAM1 is expressed in normal breast and milk and associates with β1 integrin in a three-dimensional model of morphogenesis. J. Mol. Histol. 35, 287–299 [DOI] [PMC free article] [PubMed] [Google Scholar]
- 34. Ronchetti D., Lionetti M., Mosca L., Agnelli L., Andronache A., Fabris S., Deliliers G. L., and Neri A. (2008) An integrative genomic approach reveals coordinated expression of intronic miR-335, miR-342, and miR-561 with deregulated host genes in multiple myeloma. BMC Med. Genomics 1, 37. [DOI] [PMC free article] [PubMed] [Google Scholar]
- 35. McCuaig K., Rosenberg M., Nédellec P., Turbide C., and Beauchemin N. (1993) Expression of the Bgp gene and characterization of mouse colon biliary glycoprotein isoforms. Gene 127, 173–183 [DOI] [PMC free article] [PubMed] [Google Scholar]
- 36. Tao K., Yang J., Guo Z., Hu Y., Sheng H., Gao H., and Yu H. (2014) Prognostic value of miR-221-3p, miR-342-3p and miR-491-5p expression in colon cancer. Am. J. Transl Res. 6, 391–401 [PMC free article] [PubMed] [Google Scholar]
- 37. Yi J. M., Dhir M., Van Neste L., Downing S. R., Jeschke J., Glöckner S. C., de Freitas Calmon M., Hooker C. M., Funes J. M., Boshoff C., Smits K. M., van Engeland M., Weijenberg M. P., Iacobuzio-Donahue C. A., Herman J. G., Schuebel K. E., Baylin S. B., and Ahuja N. (2011) Genomic and epigenomic integration identifies a prognostic signature in colon cancer. Clin. Cancer Res. 17, 1535–1545 [DOI] [PMC free article] [PubMed] [Google Scholar]
- 38. De Marchis M. L., Ballarino M., Salvatori B., Puzzolo M. C., Bozzoni I., and Fatica A. (2009) A new molecular network comprising PU.1, interferon regulatory factor proteins and miR-342 stimulates ATRA-mediated granulocytic differentiation of acute promyelocytic leukemia cells. Leukemia 23, 856–862 [DOI] [PubMed] [Google Scholar]
- 39. Dery K. J., Kujawski M., Grunert D., Wu X., Ngyuen T., Cheung C., Yim J. H., and Shively J. E. (2014) IRF-1 regulates alternative mRNA splicing of carcinoembryonic antigen-related cell adhesion molecule 1 (CEACAM1) in breast epithelial cells generating an immunoreceptor tyrosine-based inhibition motif (ITIM) containing isoform. Mol. Cancer 13, 64. [DOI] [PMC free article] [PubMed] [Google Scholar]
- 40. Pan H., and Shively J. E. (2010) Carcinoembryonic antigen-related cell adhesion molecule-1 regulates granulopoiesis by inhibition of granulocyte colony-stimulating factor receptor. Immunity 33, 620–631 [DOI] [PMC free article] [PubMed] [Google Scholar]
- 41. Lu R., Kujawski M., Pan H., and Shively J. E. (2012) Tumor angiogenesis mediated by myeloid cells is negatively regulated by CEACAM1. Cancer Res. 72, 2239–2250 [DOI] [PMC free article] [PubMed] [Google Scholar]
- 42. Ozeki M., and Shively J. E. (2008) Differential cell fates induced by all-trans retinoic acid-treated HL-60 human leukemia cells. J. Leukoc. Biol. 84, 769–779 [DOI] [PMC free article] [PubMed] [Google Scholar]
- 43. Riechmann V., van Crüchten I., and Sablitzky F. (1994) The expression pattern of Id4, a novel dominant negative helix-loop-helix protein, is distinct from Id1, Id2 and Id3. Nucleic Acids Res. 22, 749–755 [DOI] [PMC free article] [PubMed] [Google Scholar]
- 44. Patel D., Morton D. J., Carey J., Havrda M. C., and Chaudhary J. (2015) Inhibitor of differentiation 4 (ID4): from development to cancer. Biochim. Biophys. Acta 1855, 92–103 [DOI] [PMC free article] [PubMed] [Google Scholar]
- 45. Wang S., Sdrulla A., Johnson J. E., Yokota Y., and Barres B. A. (2001) A role for the helix-loop-helix protein Id2 in the control of oligodendrocyte development. Neuron 29, 603–614 [DOI] [PubMed] [Google Scholar]
- 46. Umetani N., Takeuchi H., Fujimoto A., Shinozaki M., Bilchik A. J., and Hoon D. S. (2004) Epigenetic inactivation of ID4 in colorectal carcinomas correlates with poor differentiation and unfavorable prognosis. Clin. Cancer Res. 10, 7475–7483 [DOI] [PubMed] [Google Scholar]
- 47. Chinaranagari S., Sharma P., and Chaudhary J. (2014) EZH2 dependent H3K27me3 is involved in epigenetic silencing of ID4 in prostate cancer. Oncotarget 5, 7172–7182 [DOI] [PMC free article] [PubMed] [Google Scholar]
- 48. Mohan K. N., and Chaillet J. R. (2013) Cell and molecular biology of DNA methyltransferase 1. Int. Rev. Cell Mol. Biol. 306, 1–42 [DOI] [PubMed] [Google Scholar]
- 49. Nguyen T., and Shively J. E. (2016) Induction of lumen formation in a three-dimensional model of mammary morphogenesis by transcriptional regulator ID4: role of CamK2D in the epigenetic regulation of ID4 gene expression. J. Biol. Chem. 291, 16766–16776 [DOI] [PMC free article] [PubMed] [Google Scholar]
- 50. Li C., Chen C. J., and Shively J. E. (2009) Mutational analysis of the cytoplasmic domain of CEACAM1–4L in humanized mammary glands reveals key residues involved in lumen formation: stimulation by Thr-457 and inhibition by Ser-461. Exp. Cell Res. 315, 1225–1233 [DOI] [PMC free article] [PubMed] [Google Scholar]
- 51. Zhang H., Eisenried A., Zimmermann W., and Shively J. E. (2013) Role of CEACAM1 and CEACAM20 in an in vitro model of prostate morphogenesis. PLoS ONE 8, e53359. [DOI] [PMC free article] [PubMed] [Google Scholar]
- 52. Piao H. L., and Ma L. (2012) Non-coding RNAs as regulators of mammary development and breast cancer. J. Mammary Gland Biol. Neoplasia 17, 33–42 [DOI] [PMC free article] [PubMed] [Google Scholar]