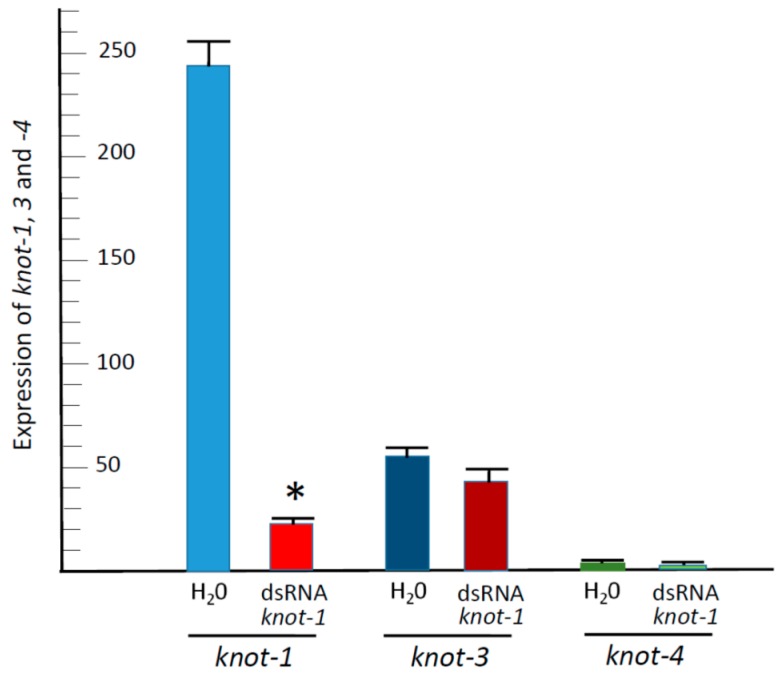
Figure 4.
Expression of knot-1; -3; and -4 upon knot-1 silencing. qPCR quantification of knot transcripts (relative to β-actin transcripts) from whiteflies caged for 48 h with tomato leaflets bathing in water (H2O) or in knot-1; -3 and -4 dsRNA (dsRNA); (n = 3; mean ± SEM). An asterisk above the bars indicates significant differences between treatments at p < 0.05.

