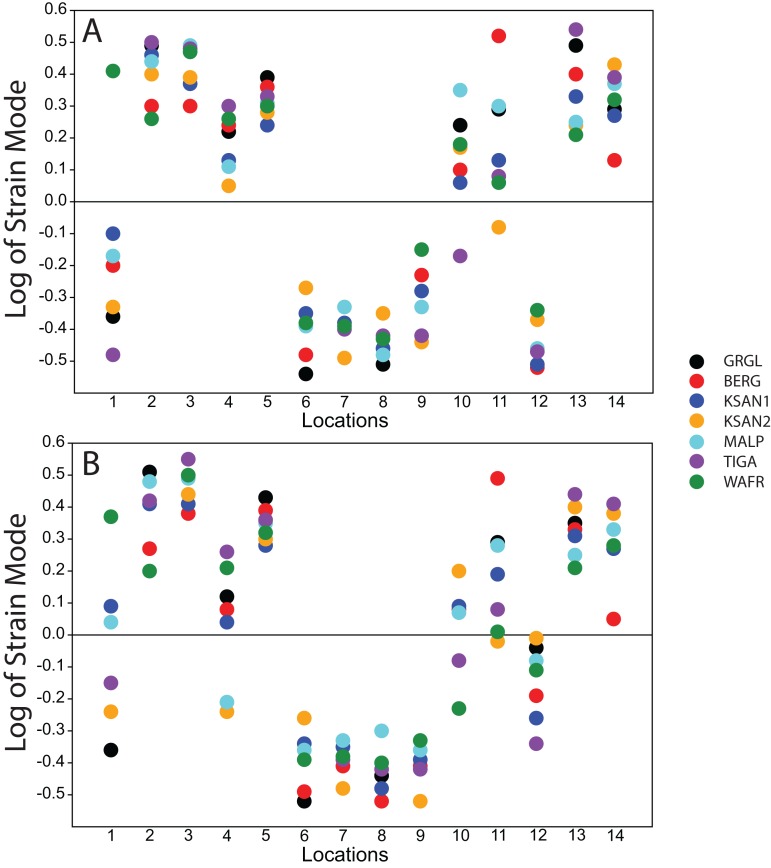
Figure 6. Strain mode in the ALL-HUM models.
Distribution of strain mode (log of ratio of maximum to minimum principal strain, y-axis) plotted by location (x-axis) in the ALL-HUM models. Plots show (A) premolar (P3) and (B) molar (M2) biting. Logging the data listed in Tables S2 and S3 centers strain mode data around zero. Values above zero indicate mainly tension, while values below zero indicate mainly compression. Site numbers follow Fig. 4.

